CE-BEARING FESI ALLOY INOCULATION OF ELECTRICALLY MELTED, LOW SULPHUR GREY CAST IRONS FOR THIN WALL CASTINGS - MDPI
←
→
Page content transcription
If your browser does not render page correctly, please read the page content below
metals
Article
Ce-Bearing FeSi Alloy Inoculation of Electrically Melted, Low
Sulphur Grey Cast Irons for Thin Wall Castings
Irina Varvara Balkan and Iulian Riposan *

                                          Materials Science and Engineering Faculty, “Politehnica” University of Bucharest, 313 Spl. Independentei,
                                          060042 Bucharest, Romania; irinavarvarabalkan@yahoo.com
                                          * Correspondence: iulian.riposan@upb.ro; Tel.: +40-745371462

                                          Abstract: Electrically melted and over-heated (>1500 ◦ C) grey cast iron at less than 0.04%S, as
                                          commonly used, solidifies large amounts of carbides and/or undercooled graphite, especially in thin
                                          wall castings; this is necessary to achieve a stronger inoculation. The efficiency of Ce-bearing FeSi alloy
                                          is tested for lower ladle addition rates (0.15 and 0.25 wt.%), compared to the base and conventional
                                          inoculated iron (Ba,Ca-bearing FeSi alloy). The present work explores chill and associated structures
                                          in hypoeutectic grey iron (3.6–3.8%CE, 0.02%S, (%Mn) × (%S) = 0.013–0.016, Alres < 0.002%), in
                                          wedge castings W1 , W2 and W3 (ASTM A 367, furan resin sand mould), at a lower cooling modulus
                                          (1.1–3.5 mm) that is typically used to control the quality of thin wall iron castings. Relatively clear and
                                          total chill well correlated with the standard thermal (cooling curve) analysis parameters and structural
                                          characteristics in wedge castings, at different wall thickness, displayed as the carbides/graphite ratio
                                and presence of undercooled graphite morphologies. The difference in effects of the two inoculants

                                          addition is seen as the ability to decrease the amount of carbides and undercooled graphite, with
Citation: Balkan, I.V.; Riposan, I.       Ce-bearing FeSi alloy outperforming the conventional inoculant, especially as the wall thickness
Ce-Bearing FeSi Alloy Inoculation of      decreased. It appears that Ce-bearing FeSi alloy could be a solution for low sulphur, electric melt,
Electrically Melted, Low Sulphur          thin wall iron castings production.
Grey Cast Irons for Thin Wall
Castings. Metals 2021, 11, 1122.          Keywords: thin wall castings; grey cast iron; low sulphur; inoculation; solidification; thermal analysis;
https://doi.org/10.3390/met
                                          cerium; chill tendency; structure; carbides; graphite
11071122

Academic Editors:
Alexander McLean, Jon Sertucha,
                                          1. Introduction
Ramón Suárez and Gorka Zarrabeitia
                                                According to the “Census of World Casting Production” [1], the annual global metal-
Received: 8 June 2021                     casting production reached around 110 million metric tons, including both ferrous (78.6%)
Accepted: 13 July 2021                    and non-ferrous (21.4%) alloys. Both of these groups of alloys include representative
Published: 15 July 2021                   metallic materials, such as cast irons (69.3%) and cast steel (9.3%), and Al-based (15.8%)
                                          and other non-ferrous materials (5.6%), respectively (Figure 1).
Publisher’s Note: MDPI stays neutral            Comprising more than two-thirds of production, cast irons are represented by grey
with regard to jurisdictional claims in   (lamellar graphite) (46.9%) cast iron, ductile (nodular graphite) cast iron (21.7%) and
published maps and institutional affil-   malleable (temper carbon graphite) cast iron (0.7%). Grey (lamellar graphite) cast iron
iations.                                  continues to be the most produced metallic material in the world foundry industry, despite
                                          its rate having decreased due to its replacement by more performant ductile cast iron or by
                                          reduced weight Al-based alloys.
                                                Figure 2 shows that the increasing of the total world metal-casting production in the
Copyright: © 2021 by the authors.         last ten years was also sustained by an increase in grey iron castings production, despite its
Licensee MDPI, Basel, Switzerland.        rate having decreased (in favour of the ductile iron and Al-alloys).
This article is an open access article          Important changes are noted in the evolution of grey cast iron production, especially
distributed under the terms and           affecting the nomenclature of parts, the size and weight characteristics of castings, as well
conditions of the Creative Commons        as its chemical composition and melting procedure [2,3].
Attribution (CC BY) license (https://
creativecommons.org/licenses/by/
4.0/).

Metals 2021, 11, 1122. https://doi.org/10.3390/met11071122                                                     https://www.mdpi.com/journal/metals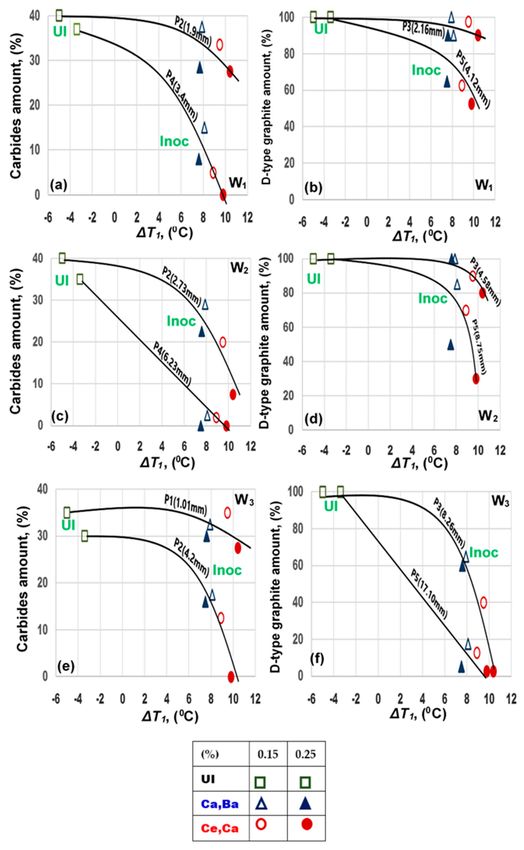
Metals 2021, 11, 1122                                                                                                             2 of 16

      Figure 1. World metal-casting production in 2019 (GI—grey iron; DI—ductile iron; MI—malleable iron; OTN—other
      non-ferrous).

      Figure 2. Evolution of grey (lamellar graphite) cast iron production (a) reported in the context of total world metal-casting
      production (2009–2019) (b).

                                  •     Drastic decreasing of the grey iron castings for use in the steel industry, such as iron
                                        mould and bottom plates, due to the increasing of the continued casting technique.
                                  •     Replacing of some traditional grey iron castings, such as thick wall pipes, radiators,
                                        bathtubs, etc.
                                  •     The automotive industry, as a major application field for metal-castings, particularly
                                        forced the reduction in the casting weight, leading to the use of “thin wall castings”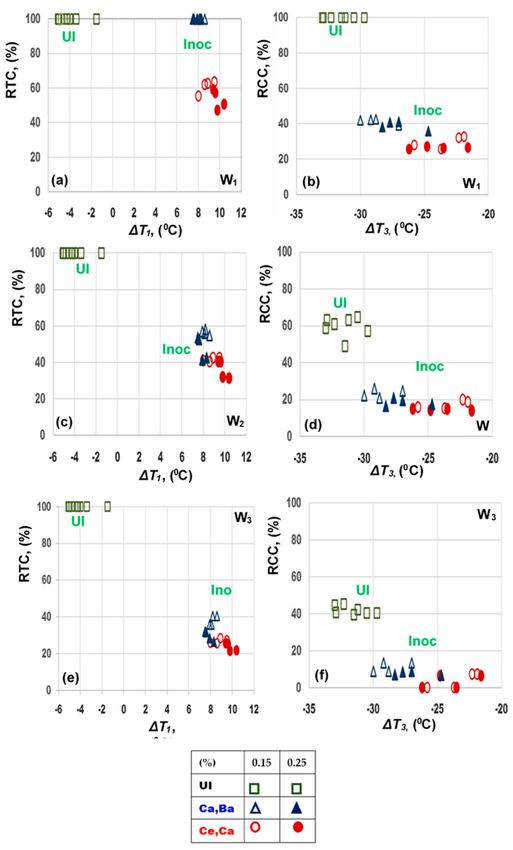
Metals 2021, 11, 1122                                                                                            3 of 16

                             (
Metals 2021, 11, 1122                                                                                                               4 of 16

                                  sulphur content in the base iron to an amount that is less than 0.05%S, and especially less
                                  than 0.03%S.
                                        The solidification cooling rate, carbon equivalent, sulphur and residual aluminium
                                  content in the base iron melt were found to be important factors that determine the chilling
                                  tendency of the grey cast irons [21]. Previous experiments [22] pointed out that the base
                                  iron obtained in an induction electric furnace at 0.024%S is more sensitive to chill (free
                                  carbides formation) than after its re-sulphurization to 0.072%S. Conventional Ca-FeSi
                                  inoculation led to decreasing of the chill tendency, evaluated on the wedge sample, for
                                  both sulphur levels, but it remains at a higher level for lower sulphur content (Figure 3a).
                                  Clear chill (CC) is the portion that is nearest to the apex, which is entirely free of grey areas,
                                  while the region from the junction of the grey fracture to the first appearance of chilled iron
                                  (apex) is designated the total chill (TC) (Figure 3b). The portion from the end of the clear
                                  chill zone to the location where the last presence of cementite or white iron is visible is
                                  designated the mottled zone (MZ) [23].

      Figure 3. The influence of sulphur content of base iron on the chill sensitiveness of un-inoculated (UI) and Ca-FeSi inoculated
      grey cast irons (a), such as clear chill (CC) and total chill (TC), on the wedge casting evaluation (b).

                                        Thermal (cooling curve) analysis showed non-equilibrium solidification of commercial
                                  cast irons, with significant levels of undercooling, promoting chill (carbides) as result of
                                  the increasing of the bath iron temperature from 1350 to 1600 ◦ C in an acid lined induction
                                  furnace; this was especially visible in thin wall castings [24–26]. A recent review covering
                                  90 years of thermal analysis as a control tool in the melting of cast irons identified the
                                  most important factors that influence the quality of iron castings [27]. In addition, the
                                  events at the end of solidification that influence the shrinkage porosity of iron castings
                                  were identified by thermal analysis [28].
                                        The main objective of the present work is to evaluate the inoculation capacity of Ce-
                                  bearing FeSi alloy, comparing it with the commercial Ca,Ba-FeSi inoculant as reference, as,
                                  in the actual global production of grey iron castings, especially in the automotive foundry
                                  industry, the electric melting procedure at high superheating and the low sulphur content
                                  (>1500 ◦ C and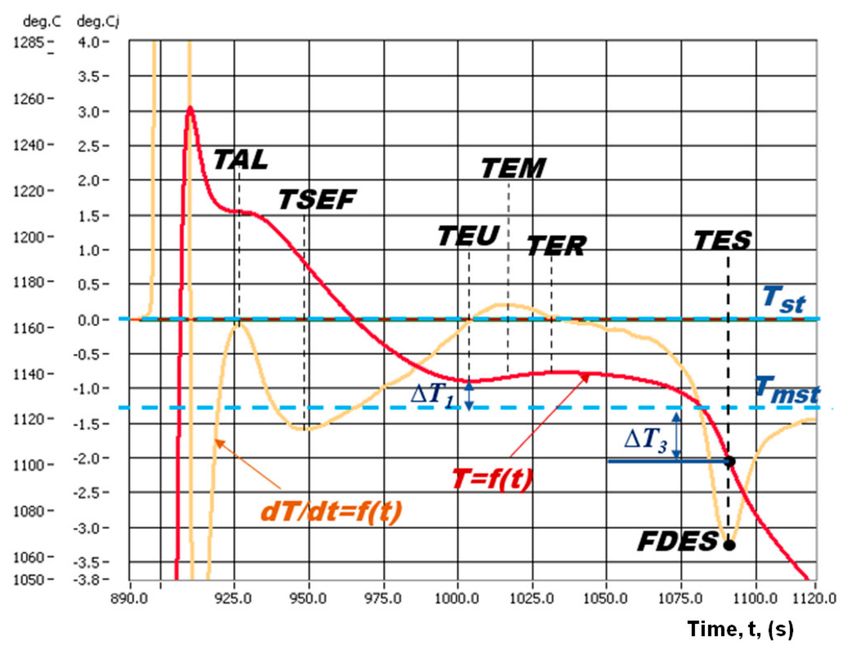
Metals 2021, 11, 1122 5 of 16
2. Materials and Methods
An acid lined, electric induction furnace (100 kg capacity, 2400 Hz frequency, Inductro,
Bucharest, Romania) was used to obtain the experimental heats. To ensure similar thermal
histories, each heat was controlled. The iron melt was heated to 1540–1545 ◦ C for 10 min,
then tapped (1525–1539 ◦ C) into the inoculation ladle (10 kg), allowing a final pouring
temperature of 1338–1350 ◦ C. An immersion thermocouple DIGILANCE IV (K (NiCr-
Ni)-thermocouple) (Heraeus Electro-Nite International, Houthalen, Belgium) was used
for temperature control. A FeSi alloy employing Ca and Ba as the inoculating elements
(1.53%Ca, 0.96%Ba, 0.86%Al, 63%Si, Fe-bal) was used as the reference inoculant. A Ce-
bearing FeSi alloy was used as the test inoculant (0.91%Ca, 1.03%Al, 1.64%Ce, 74.2%Si,
Fe-bal). The alloy had a 0.2–1.0 mm particle size range. Inoculant was added at two
levels—0.15 wt.% and 0.25 wt.%—into the pouring ladle during tapping. Each inoculated
iron batch was held for 2.0–2.5 min before pouring.
Wedges of the type W1 (B = 5.1 mm, H = 25.4 mm, CM = 1.1 mm), W2 (B = 10.2 mm,
H = 31.8 mm, CM = 2.1 mm) and W3 (B = 19.1 mm, H = 38.1 mm, CM = 3.5 mm) (see
Figure 3b), typically used to characterize the solidification pattern of thin-medium size iron
castings, as specified in the ASTM A-wedge test [29], were considered (furan resin mould).
The ratio between volume and the total external casting surface is defined as Cooling
Modulus (CM) and it is an expression of the capacity to transfer a given quantity of heat
through an existing surface to the mould. A higher cooling modulus equates with a slower
cooling rate and lower undercooling during eutectic solidification. Each wedge sample
size was cast two times, with average values considered.
To evaluate the representative areas where chilling occurred, the samples listed in
Figure 3b were used, and the structural characteristics (metallographic analysis and OM-
NIMET ENTERPRISE Image Analyzer, 70× magnification) (Lake Bluff, IL, USA) were
evaluated at representative points, located on the central axis, from the apex up the base of
wedge casting (Figure 4).
Figure 4. Analysed points on the height of the test wedge castings.
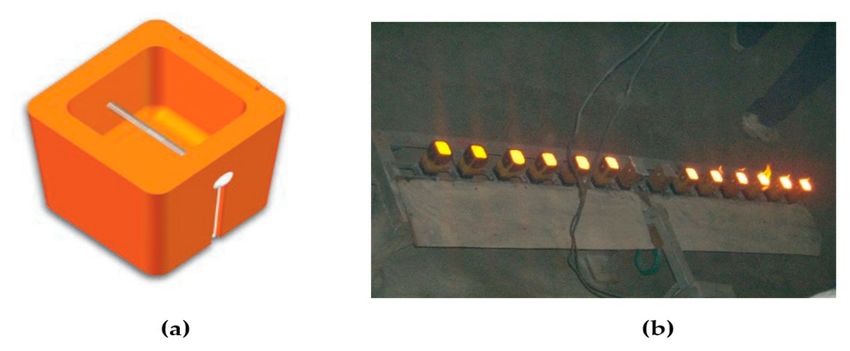
A standard thermal (cooling curve) analysis Quick-cupTM (Heraeus Electro-Nite
International, Houthalen, Belgium) [30] was used, with standard 7.3 mm cooling modulus
ceramic cups (Figure 5a), but a test station with multiple simultaneous work positions
(Figure 5b) was chosen to allow for simultaneous thermal (cooling curve) analysis. In
this way, it is possible to have similar pouring and solidifications conditions for all of the
tested cast irons. For each test variant, two ceramic cups were used—un-inoculated and
inoculated irons—at two levels and two inoculants, respectively. Only average values
were considered.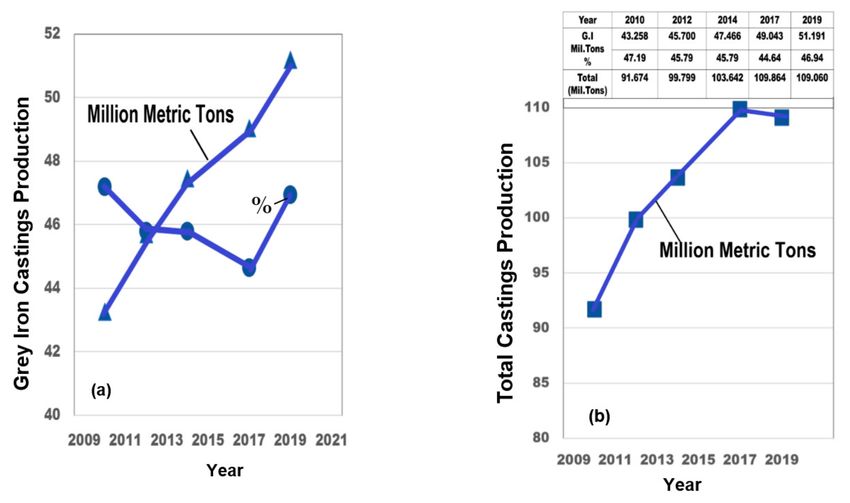
Metals 2021, 11, 1122                                                                                                                        6 of 16

                                    Figure 5. Ceramic cup (a) included in a test station for simultaneous thermal (cooling curve)
                                    analysis (b).

                                    3. Results and Discussion
                                    3.1. Chemical Composition
                                         The obtained chemical composition (Table 1) characterizes a hypoeutectic grey cast
                                    iron (3.61–3.78% carbon equivalent) that is typically of grade 300 according to the ISO
                                    185:2020 standard and of EN-GJL grade300 according to European Standard EN1561-2011,
                                    respectively. A high-end SPECTROLAB spectrometer (Sylmar, CA, USA) that simultane-
                                    ously includes hybrid optic (photomultiplier tubs (PMT)) and CCD (Spectroscopic Charge
                                    Coupled Device detection system) detectors is used for high precision metal analysis.

                                                      Table 1. Inoculated grey cast iron.

                                  Chemical Composition * (wt.%)
                                                                                                         CE (%)       (%Mn) × (%S)        Mn/S
      C             Si         Mn            P              S             Zr              Al
  3.12–3.29      1.49–1.52   0.67–0.70   0.12–0.13     0.020–0.022      0.0005      0.0011–0.0016       3.61–3.78      0.013–0.016        30–35
     * Other elements (wt.%): 0.05–0.06 Cu, 0.03–0.05 Ni,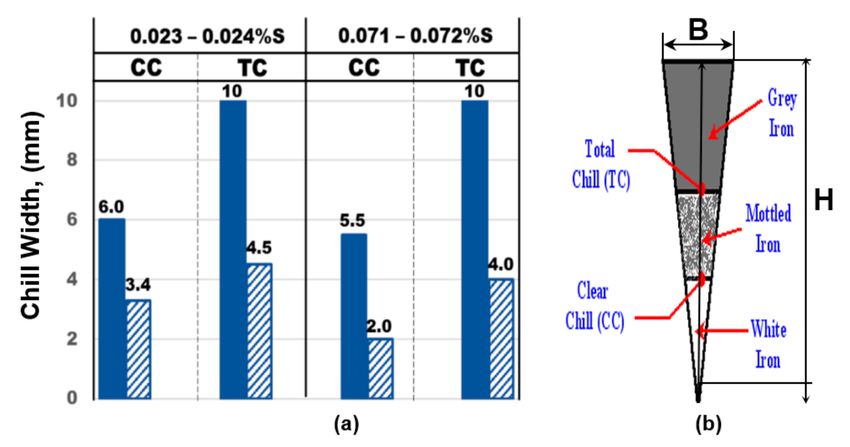
Metals 2021, 11, 1122                                                                                                           7 of 16

      Figure 6. Influence of 0.25 (wt.%) inoculation on the graphite characteristics at different wedge widths of W2 and W3 wedge
      samples (ASTM A 367) (un-etched) and lower free carbides occurrence, respectively. As expected, the increasing of the
      inoculant addition rate led to higher graphitizing power, but this depended on the inoculant type.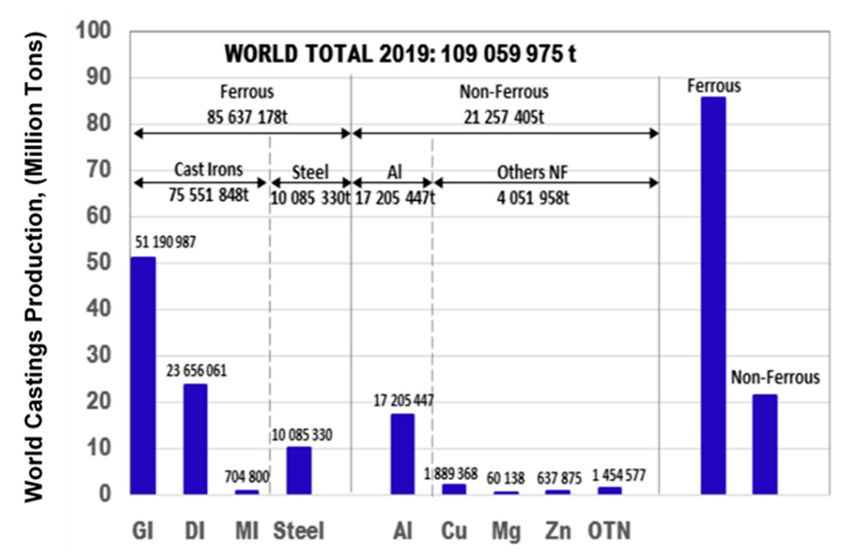
Metals 2021, 11, 1122 8 of 16
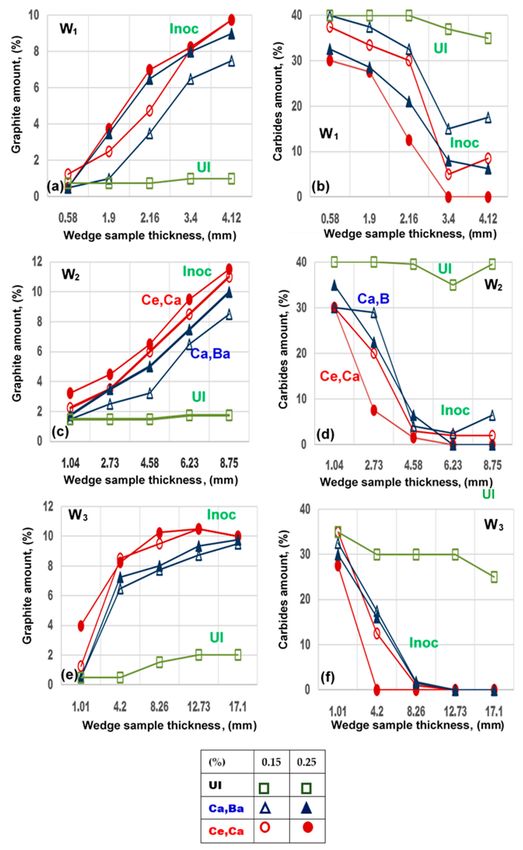
Figure 7. Influence of thickness of wedge samples W1 (a,b), W2 (c,d) and W3 (e,f) on the graphite amount (a,c,e) and
carbides amount (b,d,f) (UI/Inoc—un-inoculated/inoculated (Ca,Ba/Ce,Ca) grey cast irons).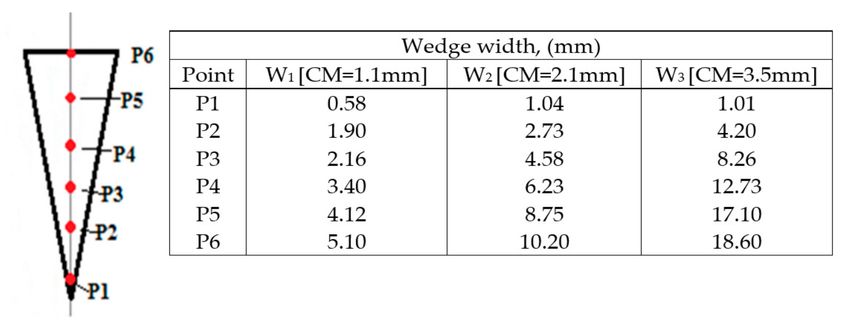
Metals 2021, 11, 1122                                                                                             9 of 16

                              Critical conditions of the chemical composition, mainly expressed by low sulphur
                        content (30)
                        and very low content of oxide forming elements (Al, Zr), led to strong sensitivity to free
                        carbides and undercooled graphite morphologies formation in un-inoculated cast irons.
                        The increasing of the cooling modulus (1.1 mm for W1 up to 3.5 mm for W3 casting) and
                        wall thickness for each wedge casting, which implies the decreasing of the solidification
                        cooling rate, led to the increasing of the graphite amount (but this was limited to 2%) and
                        the decreasing of the carbides amount (but this remained at more than 25%). A mottled
                        structure, characterized by low amounts of graphite at undercooled morphologies (D and
                        E-types) and high amounts of free carbides, is typical for un-inoculated cast irons in the
                        test solidification conditions.
                              Inoculation, as a metallurgical treatment applied to the liquid cast iron, before solidifi-
                        cation, shows a visible graphitizing effect, depending on the type and addition amount of
                        inoculant, and the solidification-cooling rate, expressed by casting cooling modulus and
                        wall thickness, respectively. The higher the wall thickness (lower cooling rate), the greater
                        the difference between un-inoculated and inoculated cast irons, due to the larger amount
                        of graphite.
                              Ce-bearing FeSi inoculant appears to be more effective compared with the reference
                        Ca,Ba-FeSi alloy, especially at lower addition rates and lower wall thicknesses. The de-
                        creasing of the solidification cooling modulus (cooling rate increasing), by transition from
                        W3 up to W1 wedge casting, leads to the increasing of the efficiency of higher inoculant
                        addition rates and of the Ce-bearing FeSi alloy, respectively. For excessively high cool-
                        ing rates, typically for W1 wedge casting solidification, the difference is clearest between
                        un-inoculated, Ca,Ba-FeSi and Ce,Ca-FeSi inoculated cast irons, as well as for the two
                        test inoculant addition rates. For W2 and W3 solidification conditions, the graphitizing
                        efficiency of 0.15 wt.% Ce,Ca-FeSi alloy is higher than that of 0.25 wt.% Ca,Ba-FeSi alloy.
                              According to the microstructures included in Figure 6, the solidification-cooling rate
                        (casting cooling modulus and wall thickness) and the applied inoculation affected the
                        lamellar graphite morphology and distribution. If undercooled graphite morphologies
                        characterize un-inoculated cast irons, independently of the cooling rate, the inoculation
                        changes the lamellar graphite up to the A-type graphite; this is more visible for W3
                        compared to W2 wedge casting, for higher wall thickness and for Ce-bearing FeSi inoculant
                        for each casting, respectively. For all of the solidification conditions, the efficiency of
                        Ce,Ca-FeSi alloy is higher compared to conventional Ca,Ba-FeSi inoculant, as a result of its
                        graphitizing power and the quality of the lamellar graphite that is formed.
                              The base metal matrix of inoculated cast irons is mainly pearlitic for all of the test
                        conditions (more than 95% pearlite and less than 5% ferrite), according to the restricted
                        carbon equivalent level and manganese content. Ferrite is associated with undercooled
                        graphite presence, and is limited in Ce,Ca-FeSi inoculated cast irons.

                        3.3. Solidification Undercooling—Relationship between Structural Characteristics
                             Figure 8 shows the typical obtained cooling curve and its first derivative (0.25% Ce,Ca-
                        FeSi inoculation). The representative temperatures on the cooling curve (T = f(t)), which
                        are mainly measured also with the contribution of the first derivative of the cooling curve
                        (∆T/ ∆t = f(t)), are the following:
                             TAL—temperature of austenitic liquidus, ◦ C; TSEF—temperature of start of eutectic
                        freezing (eutectic nucleation), ◦ C; TEU—temperature of eutectic undercooling, ◦ C; TER—
                        temperature of graphitic recalescence, ◦ C; TES—temperature of the end of solidification
                        (end of solidus), ◦ C; TEM—maximum recalescence rate, ◦ C /s.
Metals 2021, 11, 1122 10 of 16
Figure 8. Typical cooling curve-first derivative curve assembly with representative parameters of
0.25 (wt.%) Ce,Ca-FeSi inoculated grey cast iron.
Equilibrium temperatures in stable (graphitic) Tst and metastable (carbidic) Tmst ,
and the ∆Ts range of the equilibrium eutectic temperature (∆Ts = Tst − Tmst , ◦ C), are
important to evaluate the real undercooling degree during solidification in specific heat
release conditions.
These two important parameters were calculated depending on the final silicon con-
tent in un-inoculated and different inoculated cast irons, as silicon is generally the most
important element influencing factor, by increasing Tst and decreasing Tmst [32]:
Tst = 1153 ◦ C + 6.7 (%Si) (◦ C) (1)
Tmst = 1147 ◦ C − 12 (%Si) (◦ C) (2)
Table 2 shows the obtained values for Tst and Tmst parameters. The silicon contribution
of inoculation generally increased the Tst and decreased the Tmst levels, independently of
the inoculant type, but depending on the inoculant addition rate. As result, the eutectic
range (∆Ts = Tst − Tmst ) was enlarged. It is worth noting that the low level of FeSi-based
alloys’ addition (0.15–0.25 wt.%) has a limited effect on the eutectic temperature variation.
Table 2. Calculated stable (Tst ) and metastable (Tmst ) eutectic temperatures.
Iron (%) Inoc Tst , (◦ C) Tmst , (◦ C) ∆Ts = Tst − Tmst , (◦ C)
UI - 1163.0–1163.2 1128.8–1129.1 33.9–34.4
0.15 1163.4–1163.9 1127.4–1128.4 35.0–36.5
Inoc
0.25 1163.7–1164.2 1127.0–1127.6 35.9–37.2
In the present paper, the undercooling degree at the lowest eutectic temperature
TEU reported to the eutectic temperature in the metastable (carbidic) solidification system
(∆T1 = TEU − Tmst, ◦ C) was considered (standard ceramic cup evaluation) in relation to
the structural characteristics of un-inoculated and inoculated grey cast irons, such as free
carbides amount and undercooled graphite (D-type) amount variation, depending on the
wall thickness of the tested castings (W1 , W2 , W3 ) (Figure 9).Metals 2021, 11, 1122 11 of 16
Figure 9. Influence of undercooling at the lowest eutectic temperature (∆T1 ), or metastable eutectic temperature, on the
carbides amount (a,c,e) and undercooled (D-type) graphite amount (b,d,f) at different thicknesses of the wedge samples
(W1 , W2 , W3 ) (UI/Inoc—un-inoculated and inoculated (Ca,Ba/Ce,Ca) grey cast irons) (P1 . . . P5—analysed points on the
wedge samples, Figure 4).Metals 2021, 11, 1122 12 of 16
Un-inoculated cast irons are characterized by negative values of the ∆T1 parameter
(−3 . . . −5 ◦ C), reflecting the carbides’ formation sensitivity of 7.3 mm cooling modulus
castings solidified in standard ceramic cup, which was TEU < Tmst in these conditions.
Inoculated cast irons are defined by positive values ∆T1 = 7 . . . 11 ◦ C (TEU > Tmst ), which
refer tothe graphite formation in the first part of the eutectic reaction, under specified
solidification conditions.
It appears that the standard solidification conditions (ceramic cup, 7.3 mm cool-
ing modulus), which are typical for thermal (cooling curve) analysis systems, could be
used to evaluate the solidification pattern of the wedge test castings, at cooling modulus
1.1 . . . 3.5 mm, depending on the wall thickness that expresses the cooling rate.
Figure 9 shows the relationship of ∆T1 with carbides and undercooled graphite (D-
type) formation, for un-inoculated and inoculated cast irons.
The increasing of the ∆T1 parameter as the effect of inoculation (higher ∆T1 for higher
inoculant addition) led to lower carbides amount, for all of the three tested castings and
for thicker sections. It is clear that Ce-bearing FeSi increased the ∆T1 parameter compared
to the reference inoculant (Ca,Ba-FeSi), resulting in lower carbide amounts. The use of
0.25 wt.% Ce,Ca-FeSi inoculated cast irons led to the avoidance of free carbides’ formation
at 3.4 mm thickness W1 casting, 6.23 mm W2 casting and 4.2 mm W3 casting, respectively.
Similarly, the ∆T1 parameter illustrates the sensitiveness of tested castings to form
undercooled graphite morphology, typically of the D-type. Un-inoculated iron castings
contain the highest amount of carbides and only undercooled D-type graphite. The positive
effect of inoculation could also be expressed through the decreasing of the incidence of
undercooled graphite, with Ce,Ca-FeSi alloy as a performance-related variable, for all of
the solidification conditions. It remains at a higher level (more than 80%) at a very low (W1
casting) and low (W2 casting) cooling modulus, especially at lower wall thickness.
3.4. Solidification Undercooling–Chill Tendency Relationship
The chill tendency is one of the most used qualitative parameter of the grey iron
castings, while the wedge samples (Figures 3 and 4) are used mainly in this respect.
Usually, the clear chill (CC) and total chill (TC) are used (Figure 3b). For a more accuracy
in chill tendency evaluation, the Relative Clear Chill (RCC) and Relative Total Chill (RTC)
parameters were proposed [23].
Figure 10 shows the relationship between the undercooling degree at the lowest
eutectic temperature (∆T1 = TEU − Tmst ) and at the end of solidification (∆T3 = TES − Tmst )
obtained by standard ceramic cup thermal analysis and the RCC and RTC, measured on
the three test wedge castings, at different cooling modulus levels (CM), W1 (CM = 1.1 mm),
W2 (CM = 2.1 mm) and W3 (CM = 3.5 mm), which are typically used for control of thin
wall iron castings.
RCC = (CC/B) × 100 (%) (3)
RTC = (TC/B) × 100 (%) (4)
where B is the maximum width of the test wedge (Figure 3b).
According to the mentioned critical solidification conditions, a strong sensitivity to
chill formation characterizes the un-inoculated cast irons. Relative Total Chill (RTC) has a
maximum value (100%) for the all of the test wedge castings (CM = 1.1 . . . 3.5 mm), also
with RCC = 100% for W1 casting, and high values for W2 and W3 , respectively.
Inoculation moved the ∆T1 parameter from negative range to a positive range. The
∆T3 parameter characterizes the end of solidification, with negative values in all of the test
conditions, which means that, for the temperature at the end of solidification, TES < Tmst .Metals 2021, 11, 1122 13 of 16
Figure 10. Relative Total Chill (RTC) in relation to undercooling at the beginning of eutectic reaction (∆T1 ) (a,c,e) and
Relative Clear Chill (RCC) in relation to undercooling at the end of solidification (∆T3 ) (b,d,f) of wedge samples (W1 , W2 ,
W3 ) (UI/Inoc—un-inoculated and inoculated (Ca,Ba/Ce,Ca) grey cast irons).Metals 2021, 11, 1122 14 of 16
Inoculation also has a visibly positive effect in the last part of solidification, as ∆T3 is
less negative (−20 . . . −30 ◦ C versus −30 . . . −35 ◦ C), but at different values, depending
on the inoculant type and inoculant addition rate, respectively.
∆T3 is less negative for 0.25 wt.% versus 0.15 wt.% addition and for Ce,Ca-FeSi versus
Ca,Ba-FeSi alloy (−22 . . . −27 ◦ C versus −28 . . . −30 ◦ C). Usually, less negative values
for ∆T3 indicate a high quality of iron castings, as a lower sensitivity for contraction
defects (shrinkage, micro-shrinkage) and inter eutectic cells phase formation, at the end of
solidification, is implied [8].
For both RCC and RTC parameters’ evaluation, the difference between un-inoculated
and inoculated cast irons increases as the casting cooling modulus decreases (solidifica-
tion cooling rate increases). As result, for thin wall castings production, inoculation is
compulsory to control chill (carbides) and undercooled graphite formation.
The performance of Ce-bearing FeSi inoculant is also sustained if the effects of the
two inoculants are compared at the two used addition rates: in many cases, the positive
effects of 0.15 wt.%Ce,Ca-FeSi alloy are, at least, equal to those of 0.25 wt.%Ca,Ba-FeSi alloy
inoculation (and are better in many cases).
4. Conclusions
The structural characteristics along the central axis of wedge castings, as effects of
casting characteristics (solidification cooling modulus and wall thickness) and metallurgical
treatment applied in the liquid state (un-inoculation and inoculation with two different
alloys at two addition rates), were correlated with the standard thermal (cooling curve)
parameters, and the following conclusions could be drawn:
• The critical conditions of the chemical composition, mainly expressed by SMetals 2021, 11, 1122 15 of 16
Institutional Review Board Statement: Not applicable.
Informed Consent Statement: Not applicable.
Data Availability Statement: Not applicable.
Conflicts of Interest: The authors declare no conflict of interest.
References
1. Census of World Casting Production: A Modern Casting Staff Report; Modern Casting: Schaumburg, IL, USA, 2021; pp. 28–30.
2. Riposan, I.; Chisamera, M.; Stan, S. Enhanced quality in electric melt grey cast irons. ISIJ Int. 2013, 53, 1683–1695. [CrossRef]
3. Riposan, I.; Chisamera, M.; Stan, S. New developments in high quality grey cast irons. China Foundry 2014, 11, 351–364.
4. Loper, C.R.; Gundlach, R.B. Inoculation what is it and how does inoculation work? In Proceedings of the AFS International
Inoculation Conference, Rosemont, IL, USA, 6–8 April 1998; p. 1.
5. Loper, C.R. Inoculation of cast ironsummary of current understanding. AFS Trans. 1999, 107, 523–528.
6. Chisamera, M.; Riposan, I.; Stan, S.; Skaland, T. Effects of calcium and strontium on the undercooling, chill and microstructure in
grey irons of varying sulphur and oxygen contents. In Proceedings of the 64th World Foundry Congress, Paris, France, 11–14
September 2000; p. 62.
7. Riposan, I.; Chisamera, M.; Stan, S.; Skaland, T.; Onsoien, M.I. Analyses of possible nucleation sites in Ca/SrOverinoculated grey
irons. AFS Trans. 2001, 109, 1151–1162.
8. Riposan, I.; Skaland, T. Modification and inoculation of cast iron. In Cast Iron Science and Technology Handbook; Stefanescu, D.M.,
Ed.; American Society of Materials: Materials Park, OH, USA, 2017; pp. 160–176.
9. Riposan, I.; Chisamera, M.; Stan, S. The role of compounds in graphite formation in cast iron-a review. Mater. Sci. Forum 2018,
925, 3–11. [CrossRef]
10. Sommerfeld, A.; Bottger, B.; Tonn, B. Graphite nucleation in cast iron melts based on solidification experiments and microstructure
simulation. J. Mater. Sci. Technol. 2008, 24, 321–324.
11. Sommerfeld, A.; Tonn, B. Nucleation of graphite in cast iron melts depending on manganese, sulphur and oxygen. Int. J. Cast
Met. Res. 2008, 21, 23–26. [CrossRef]
12. Alonso, G.; Stefanescu, D.M.; Larranaga, P.; De la Fuente, E.; Suarez, R. On the nucleation of graphite in lamellar graphite cast
iron. AFS Tran. 2016, 124, 16–20.
13. Stefanescu, D.M.; Alonso, G.; Larranaga, P.; Suarez, R. On the stable eutectic solidification of iron–carbon–silicon alloys. Acta
Mater. 2016, 103, 103–114. [CrossRef]
14. Stefanescu, D.M.; Alonso, G.; Larranaga, P.; De la Fuente, E.; Suarez, R. On the crystallization of graphite from liquid iron-carbon
silicon melts. Acta Mater. 2016, 107, 102–126. [CrossRef]
15. Campbell, J.A. Hypothesis for cast iron microstructures. Metall. Mater. Trans. B 2009, 40, 786–801. [CrossRef]
16. Stefan, E.; Riposan, I.; Chisamera, M.; Stan, S. Lanthanum role in the graphite formation in gray cast irons. Minerals 2020, 10, 1146.
[CrossRef]
17. Stefan, E.; Chisamera, M.; Riposan, I.; Stan, S. Graphite nucleation sites in commercial grey cast irons. Mater. Today Proc. 2021, 45,
4091–4095. [CrossRef]
18. Zhou, J. Color metallography of cast irons. China Foundry 2009, 6, 52–69.
19. Rong De, L.; Xiang, Y.J. Heterogeneous nuclei in flake graphite. AFS Trans. 1991, 99, 707–712.
20. Available online: https://www.elkem.no (accessed on 15 March 2011).
21. Riposan, I.; Chisamera, M.; Stan, S.; White, D. Chilling properties of Ba/Ca/Sr inoculated grey cast irons. Int. J. Cast Met. Res.
2007, 20, 90–97. [CrossRef]
22. Chisamera, M.; Riposan, I.; Stan, S.; White, D.; Grasmo, G. Graphite nucleation control in grey cast iron. Int. J. Cast Met. Res. 2008,
21, 39–44. [CrossRef]
23. Stan, S.; Chisamera, M.; Riposan, I.; Stefan, E.; Barstow, M. Solidification pattern of un-inoculated and Inoculated gray cast irons
in wedge test samples. AFS Trans. 2010, 118, 295–309.
24. Riposan, I.; Chisamera, M.; Stan, S.; Grasmo, G.; Hartung, C.; White, D. Iron quality control during melting in coreless induction
furnace. AFS Trans. 2009, 117, 423–434.
25. Riposan, I.; Chisamera, M.; Stan, S.; Barstow, M. Identifying chill tendency of cast iron melts by thermal analysis. Int. J. Cast Met.
Res. 2013, 26, 152–159. [CrossRef]
26. Riposan, I.; Chisamera, M.; Stan, S.; Barstow, M. Enhanced quality in electric melt grey cast irons. In Proceedings of the 70th
World Foundry Congress, Monterrey, Mexico, 25–27 April 2012; p. 49.
27. Stefanescu, D.M.; Suarez, R.; Kim, S.B. 90 years of thermal analysis as a control tool in the melting of cast iron. China Foundry
2020, 17, 69–84. [CrossRef]
28. Alonso, G.; Stefanescu, D.M.; Bravo, B.; Zarrabeitia, G.; Suarez, R. Nodule count, End of solidification cooling rate and shrinkage
porosity correlations in high silicon spheroidal graphite iron. Minerals 2021, 1, 155. [CrossRef]
29. Standard A367-85: Standard Test. Methods of Chill Testing of Cast Iron; American Society for Testing of Materials: West Conshohocken,
PA, USA, 2000; pp. 151–154.Metals 2021, 11, 1122 16 of 16
30. QuiK-Cup® QuiK-Lab® E Thermal Analysis of Cast Iron. Available online: https://www.heraeus.com/media/media/hen/
media_hen/products_hen/iron/QuikLabE_QuikCup_EN_lowres.pdf (accessed on 13 March 2021).
31. Gundlach, R. Observations on structure control to improve the properties of cast irons, the honorary cast iron lecture. In
Proceedings of the 112nd AFS Metalcasting Congress, Atlanta, GA, USA, 17–20 May 2008; pp. 8–158.
32. Sillen, R.V. Novacast Technologies. 2006. Available online: https://www.novacast.se (accessed on 10 December 2006).You can also read