Probabilistic prediction of raw and BMA calibrated AEMET-SREPS: the 24 of January 2009 extreme wind event in Catalunya
←
→
Page content transcription
If your browser does not render page correctly, please read the page content below
Adv. Geosci., 26, 119–124, 2010
www.adv-geosci.net/26/119/2010/                                                                         Advances in
doi:10.5194/adgeo-26-119-2010                                                                           Geosciences
© Author(s) 2010. CC Attribution 3.0 License.

Probabilistic prediction of raw and BMA calibrated
AEMET-SREPS: the 24 of January 2009 extreme wind event
in Catalunya
P. Escribà1 , A. Callado1 , D. Santos2 , C. Santos2 , J. A. Garcı́a-Moya2 , and J. Simarro3
1 Delegation of AEMET in Catalunya, Barcelona, Spain
2 AEMET    Central Headquarters, Madrid, Spain
3 Delegation of AEMET in Valencia, Valencia, Spain

Received: 26 February 2010 – Revised: 5 November 2010 – Accepted: 11 November 2010 – Published: 22 November 2010

Abstract. At 00:00 UTC of 24 January 2009 (24Jan09)               and intensity of 10-m wind speed maximum values. Obser-
an explosive cyclogenesis placed at the Gulf of Vizcaya,          vations at 29 automatic ground stations of AEMET are used
reached its maximum intensity with observed surface pres-         for the verification.
sures below 970 hPa on its center. During its path through           On one hand results indicate that raw AEMET-SREPS is
the south of France there were strong westerly and north-         able to forecast 60 h ahead mean winds higher than 36 and
westerly winds over Iberian Peninsula (above 150 km/h).           54 km/h and that it correctly locates them in three different
These extreme winds leaved 8 casualties in Catalunya, the         areas. On the other hand, predicted probability loses its skill
north-east region of Spain.                                       after BMA calibration of the ensemble. This is due to the
   The aim of this work is validating the skill of the Span-      fact that BMA bias correction underestimates the intensity
ish Meteorological Agency (AEMET) Short Range Ensem-              of wind.
ble Prediction System (SREPS) in forecasting this event.
Two probabilistic forecasts of wind are compared, a non-
calibrated (or raw) and a calibrated one using the Bayesian
Model Averaging (BMA).                                            1   Introduction
   AEMET runs a daily experimental SREPS twice a day
(00:00 and 12:00 UTC). This system consists on 25 mem-            Mediterranean region has a meteorological behaviour dom-
bers that are constructed by integrating five different Limited   inated by the interaction of synoptic flow with orographic
Area Models (LAMs) at 0.25 degrees of horizontal resolu-          small scale features and Mediterranean sea. Such interaction
tion. Each model uses five different initial and boundary con-    produces mesoscale structures that are difficult to model us-
ditions from five Global Models (GMs). Thus it is obtained a      ing GMs o even LAMs.
probabilistic forecast that takes into account initial, contour      In order to improve the forecast of these structures
and model uncertainties.                                          AEMET proposed some years ago to create a SREPS. The
   BMA is a statistical tool for combining predictive Proba-      main goal of ensemble prediction respect to deterministic one
bility Distribution Functions (PDFs) from different sources.      is that it takes into account forecast uncertainty by means of a
BMA predictive PDF is a weighted average of PDFs centered         probabilistic prediction. Using this technique, another valu-
on the individual bias-corrected forecasts. Each weight is a      able aspect is that PDFs are constructed dynamically, not sta-
measure of the corresponding forecast skill. Here BMA is          tistically.
applied to calibrate probabilistic forecasts of wind speed.          There are several ways of making a SREPS. Our ensem-
   In this work two time forecast ranges (H+60 and H+36) of       ble is based on the multi-model multi-analysis and multi-
10-m wind speed over Catalonia are verified subjectively at       boundary conditions technique. On the other hand, as nu-
12:00 UTC of 24Jan09 valid time. We focus on the location         merical models have systematic errors, it is desirable to cal-
                                                                  ibrate the ensemble. In this work we validate the skill of
                                                                  AEMET-SREPS when forecasting the 24Jan09 wind event.
                    Correspondence to: P. Escribà                We compare probabilistic prediction of raw ensemble with
                    (pescribaa@aemet.es)                          BMA calibrated prediction.

Published by Copernicus Publications on behalf of the European Geosciences Union.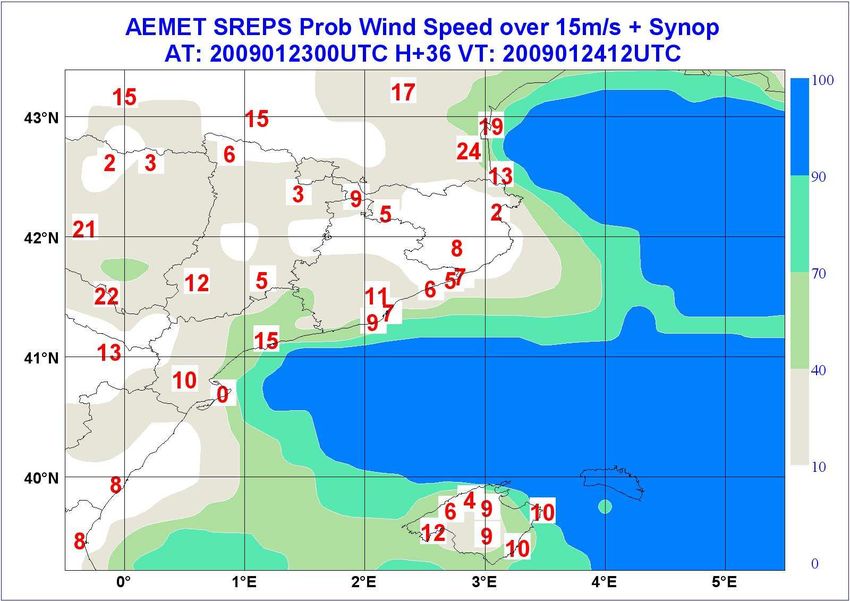
Figures
120 P. Escribà et al.: Probabilistic prediction of raw and BMA calibrated AEMET-SREPS
Table 1. LAM (files), GM (columns) and the 25 members of
AEMET-SREPS.
ECMWF GME AVN CMC UKMO
HIRLAM IEC IGM IAV ICM IUK
UM UEC UGM UAV UCM UUK
LM LEC LGM LAV LCM LUK
HRM HEC HGM HAV HCM HUK
MM5 MEC MGM MAV MCM MUK
2 AEMET-SREPS, BMA and the probabilistic forecast
of wind
2.1 AEMET-SREPS Figure
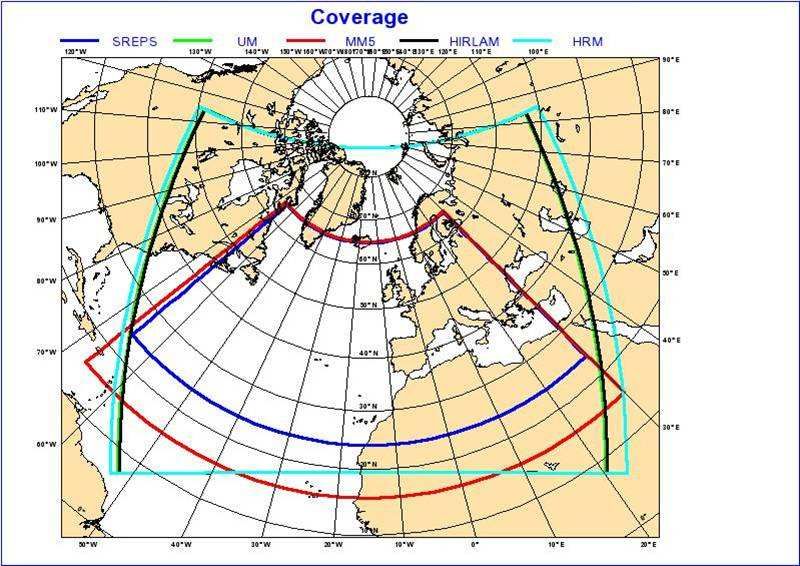
Fig. 1.1: Integration
Integration domains
domainsof of
SREPS LAMs (LM has
AEMET-SREPS the same
LAMs (LMdomain as HRM).
has the
same domain as HRM).
AEMET-SREPS (Garcı́a-Moya et al., 2009) is a multi-
model, multi-analysis and multi-boundary conditions sys-
tem. Uncertainties of model, analysis and boundary con-
ditions are sampled by construction. The ensemble has 25
members that are generated combining five LAMs with five
GMs (Table 1). Each one of these numerical models are
daily integrated and verified at different National Weather
Services all over the world, so they are state-of-the-art Nu-
merical Weather Prediction (NWP) models.
Hou et al. (2001) in SAMEX and Palmer et al. (2003)
in DEMETER experiments demonstrated that this ensemble
technique gives more skill in probabilistic forecasting than
any other one. This fact was supported by one of the con-
clusions of the last workshop on SREPS hold at Exeter on
June 2009: “Multi-model ensembles give the best results in
Figure 2: RGB composition of Meteosat-9 at 00 UTC of 24 January 2009. Here RGB is the
all temporal and space scales” (4th Workshop, 2009). Fig. 2. RGB
composition composition
of channels of Meteosat-9
(µm) WV6.2-WV7.3 at 00:00
(Red), IR9.7-IR10.8 UTCandofWV6.2
(Green) 24 Jan-
AEMET-SREPS runs twice a day (00:00 and 12:00 UTC) uary 2009. Here RGB is the composition of channels (µm) WV6.2-
at AEMET Central Headquarters. GM boundary conditions WV7.3 (Red), IR9.7-IR10.8 (Green) and WV6.2 (Blue).
are received operationally and then five LAMs are integrated
locally at our CrayX1e vectorial supercomputer. Horizontal
resolution of members is 0.25 degrees of longitude and lat- of ensemble member K and it is centred in the correspond-
itude and they have 40 vertical levels. Figure 1 shows the ing bias corrected deterministic forecast f K . It represents the
integration domains of each LAM, and in blue the common uncertainty of the member and its shape depends on the mete-
one. Forecast range is 3 days (H+72). orological parameter (Gaussian for temperature, Gamma for
precipitation, etc.). wK is the weight of each member and a
2.2 Bayesian Model Averaging (BMA) measure of its skill.
BMA is a bayesian statistical technique for ensemble calibra- 2.3 Wind speed calibration with BMA
tion (Raftery, 2003). We mean calibration as the correction
of predictive PDF in order to adjust it to the actual (and un- Wind speed is a definite positive meteorological variable. It
known) forecast uncertainty. means
Figurethat its PDF
3: 10-minutal wind maximum isandnot
mean speed (blue) windatgust
zero. According
(red) registered to
at the automatic
XK=25 literature Weibull
ground station PDF isofthe
of the Delegation AEMETonein that approximates
Catalunya, Barcelona. Day 24 itofbetter.
January 2009.
PDF(y) = wK PDFK (y|f K ,σK ) (1)
K=1 In this work we use a Gaussian PDF for wind speed because
The basic point of BMA is making a supposition of the shape this is the available one we have in the BMA computation
of the actual PDF of forecast (1). Having the shape, parame- software. Here we point out that this approximation can in-
ters wK and σK are estimated by maximum likelihood com- troduce errors in the calibration.
paring predictions with observational data in a training pe- Previous experiments have been done with variable tem-
riod previous to the forecast initial time. PDFK is the PDF perature in order to find the proper BMA training period. A
Adv. Geosci., 26, 119–124, 2010 www.adv-geosci.net/26/119/2010/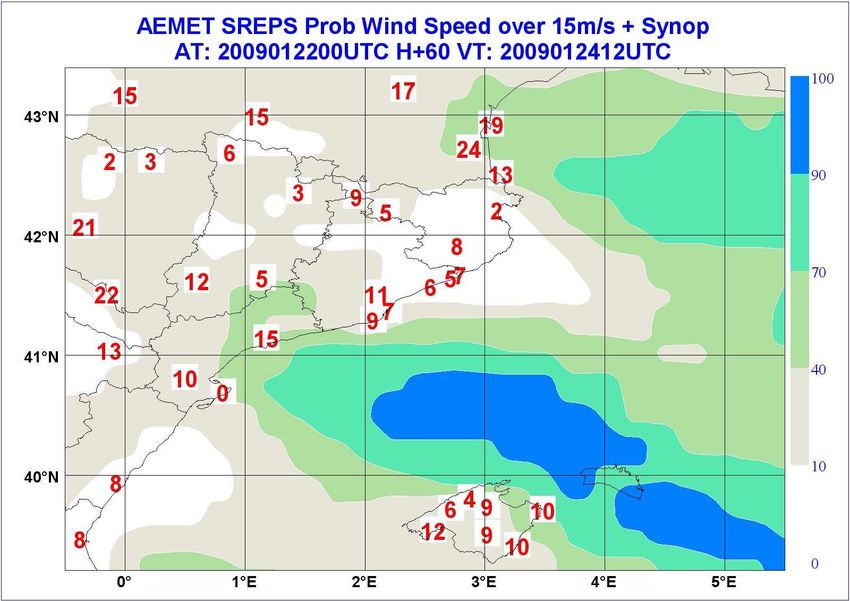
Figure 2: RGB composition of Meteosat-9 at 00 UTC of 24 January 2009. Here RGB is the
P. Escribà
composition et al.:
of channels (µm)Probabilistic prediction
WV6.2-WV7.3 (Red), of(Green)
IR9.7-IR10.8 raw and
andWV6.2
BMA calibrated AEMET-SREPS 121
Figure 3: 10-minutal wind mean speed (blue) and wind gust (red) registered at the automatic
Fig. 3. 10-minutal wind mean speed (blue) and wind gust (red) reg-
ground station of the Delegation of AEMET in Catalunya, Barcelona. Day 24 of January 2009.
istered at the automatic ground station of the Delegation of AEMET
in Catalunya, Barcelona. Day 24 of January 2009.
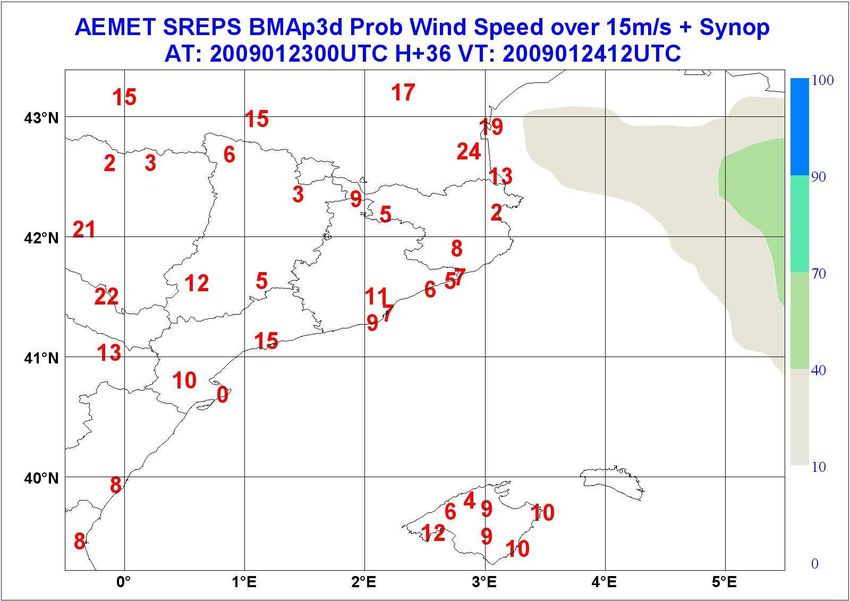
Figure 4: H+60 raw AEMET-SREPS. Probabilistic prediction
short training benefits a rapid adaptation to weather changes
whereas a long training ensures a better estimation of param- (left) and 15 m/s (right). Observations are plotted in red (m/s).
eters. In this case we have proved that a 3-days training gives
similar results to a 20-days one. Here we take the work for
temperature as a reference for wind speed calibration, be-
cause both variables are generated with the same NWP sys-
tem. In order to save computational time we choose the 3
previous days to the event as the training period.
3 Case of study: the extreme wind of 24Jan09 in
Catalunya
3.1 Description of the event
Fig. 4. H+60 raw AEMET-SREPS. Probabilistic prediction of mean
Figure 2 is 4:
Figure theH+60
Airmass
rawRGB image of the Klauss
AEMET-SREPS. extrat-
Probabilistic prediction of mean
wind speed greater wind
than 10 speed
m/s (top) andgreater than 10Observa-
15 m/s (bottom). m/s
ropical cyclone placed at Gulf of Vizcaya at 00:00 UTC of tions are plotted in red (m/s).
(left) and
24Jan09. The 15
red m/s (right).
colour of theObservations are plotted
image which encloses the in red (m/s).
cyclone indicates descending stratospheric air related with
a jet stream. The white and whitish colours indicate high 3.2 Questions to answer
and mid-level clouds rotating around the centre of the low
pressure. In the south part of Spain the green colour is re- With this work we try to answer two questions: (a) Did
lated with warmer air. This system was a deep low pres- AEMET-SREPS hit prediction of the 24Jan09
sure that evolved rapidly from Atlantic Ocean to central Eu- extreme wind event? And (b) did BMA improve probabilistic
rope. As it passed through the south of France it caused very forecast?
Figure 5: Areas of different affectation of wind. By
strong westerly and north-westerly wind gusts of more than
150 km/h at some points in Catalunya. In addition to multiple convention we name them Tarragona (green),
3.3 Methodology
damages, 8 people dead.
In Fig. 3 is represented the 10-min average wind speed Pirineus
The study (blue) and Perpinyà
consists on carrying(yellow).
out a subjective verifica-
of 24Jan09 registered at the Delegation of AEMET in tion of probabilistic forecasting of 10-m wind speed greater
Catalunya, Barcelona. According to the graphic, episode than four thresholds, 10, 15, 20 and 25 m/s (36, 54, 72 and
started at 06:00 UTC reaching 95 km/h of wind gust (max- 90 km/h respectively). We follow the rule that a predicted
imum wind) and 50 km/h of mean wind. At 12:00 UTC event is true if its probability is greater than 50%. We look
wind gust was 80 km/h and mean wind 40 km/h. It decreased at skill of SREPS to forecast spatial location and intensity of
steadily down to 40 km/h of wind gust and 20 km/h of mean wind. The instant of study is 12:00 UTC of 24Jan09 and two
wind at 00:00 UTC of 25 January. forecast ranges are taken into account, H+36 and H+60. As
www.adv-geosci.net/26/119/2010/ Adv. Geosci., 26, 119–124, 2010
Figure 5: Areas of different affectation of wind. By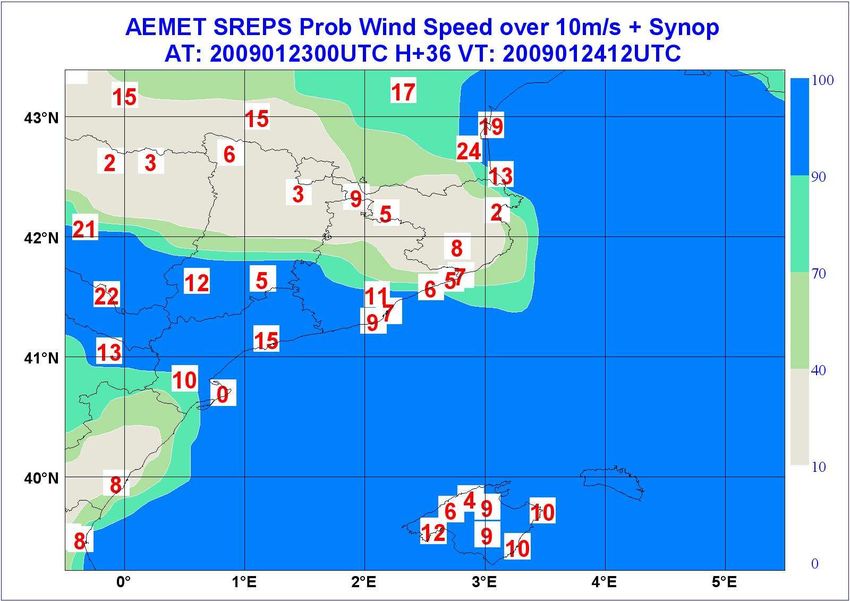
122 P. Escribà et al.: Probabilistic prediction of raw and BMA calibrated AEMET-SREPS
Fig. 5. Areas of different affectation of wind. By convention we
Figure 5: Areas of different affectation of wind. By
name them Tarragona (green), Pirineus (blue) and Perpinyà (yel-
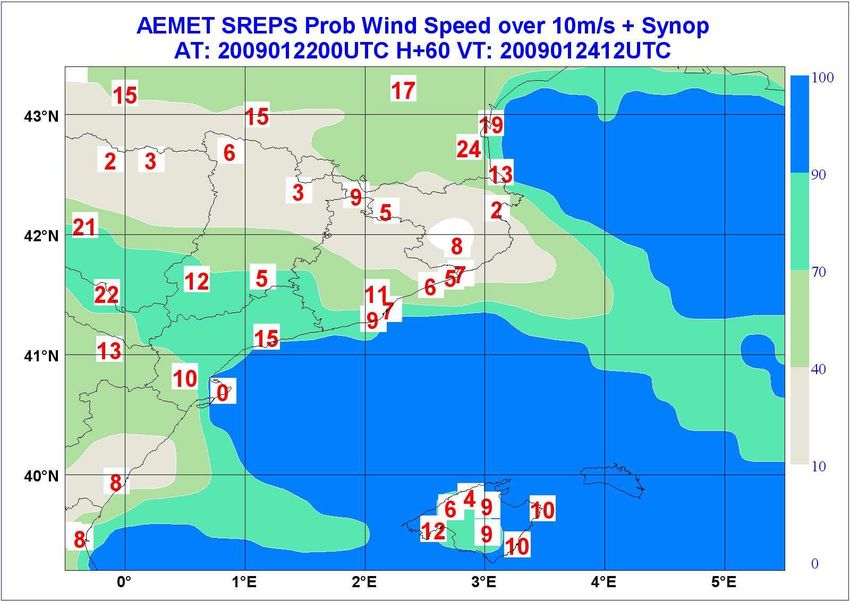
low). Figure 6: H+36 raw AEMET-SREPS. Probabilistic prediction
convention we name them Tarragona (green),
m/s (left) and 15 m/s (right). Observations are plotted in red (
Pirineus (blue) and Perpinyà (yellow).
observational data we take mean 10-m wind speed at 29 au-
tomatic ground stations in Catalunya. This is firstly studied
for raw ensemble and secondly for the BMA calibrated one.
Although verification is done for mean wind speed (this
is the variable explicitly resolved by NWP models) results
can be extrapolated to wind gust as far as both variables may
have a quasi linear relationship (see Fig. 3).
4 Results
4.1 Did AEMET-SREPS hit prediction of the 24Jan09
extreme wind event?
Fig. 6. H+36 raw AEMET-SREPS. Probabilistic prediction of mean
Figure 6: H+36 raw AEMET-SREPS. Probabilistic wind
Yes. Figure 4 shows H+60 predicted probability of wind
prediction of mean
speed greater than 10wind speed
m/s (top) greater
and 15 than 10
m/s (bottom). Observa-
tions are plotted in red (m/s).
speedm/s
greater
(left)than
and1015
m/sm/s
(left) and 15Observations
(right). m/s (right), forare
rawplotted in red (m/s).
ensemble. Observations are plotted in red. Looking at obser-
vation wind a general behaviour can be inferred considering In Fig. 6 is represented the same as in Fig. 4 but for
the map in three affected areas. These three areas are plot- H+36 forecast range. As expected, forecast improves with
ted in Fig. 5. We name them Tarragona, Pirineus and Per- respect to H+60 in the whole domain. Now the three areas
pinyà. These three areas show strong, moderate and again (Fig. 5) are completely
strong wind speeds, respectively. This geographical distribu-
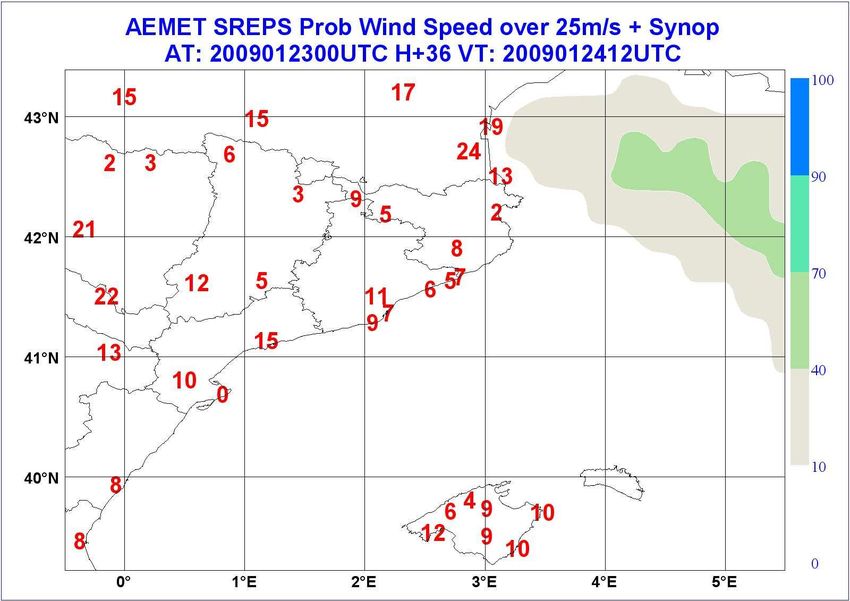
Figure 7: H+36 raw defined, in particular Probabilistic
AEMET-SREPS. probability of prediction
mean wind speed greater than 10 m/s at Tarragona is greater
tion of observed winds is due to the existence of the Pirineus (left)
than and 25 m/s (right). Observations are plotted in red (m/s)
90%.
mountains (with altitudes higher than 3000 m). This chain of 20 m/s and 25 m/s thresholds for H+36 predictions are
mountains act as a wedge that splits the north-westerly winds plotted in Fig. 7. For 20 m/s threshold the skill is lost at the
in two parts, one to the north and the other to the south of the three stations that have observed values greater than 20 m/s.
mountains. This result is not rare and it mainly responds to the fact that
Here SREPS defines very well these three zones and pre- NWP models underpredict wind speed when the observed
dicts quite well the intensity of wind for the10 m/s threshold. wind is strong or very strong. This affirmation will be ana-
For the 15 m/s threshold SREPS hits the right intensity at al- lyzed in the next section. Verifying 25 m/s threshold is not
most all stations when following the rule of 50%. It has to be possible because there is not any station measuring values
noticed that the skill of the system in forecasting very strong greater than this.
winds in the coasts of Tarragona and Perpinyà, 60 h before
the event, is quite remarkable.
Adv. Figure
Geosci.,7:26,H+36
119–124,
raw2010 www.adv-geosci.net/26/119/2010/
AEMET-SREPS. Probabilistic prediction of mean wind speed greater than 20 m/s
(left) and 25 m/s (right). Observations are plotted in red (m/s).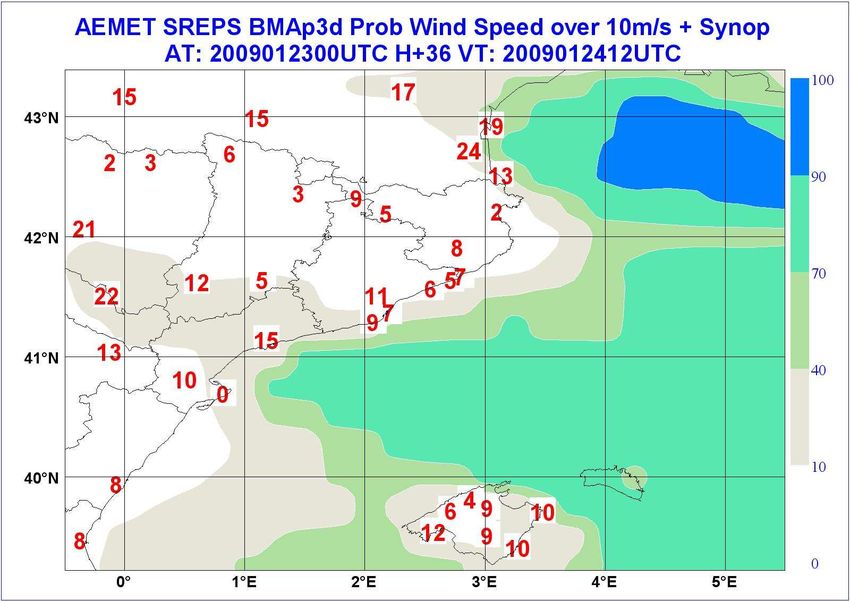
Figureof
              Figure 6: H+36 raw AEMET-SREPS. Probabilistic prediction 7: mean
                                                                          H+36wind
                                                                               raw AEMET-SREPS.
                                                                                   speed greater thanProbabilistic
                                                                                                      10           prediction
              m/s (left) and 15 m/s (right). Observations are plotted in(left) and 25 m/s (right). Observations are plotted in red (m/s)
                                                                         red (m/s).
             P. Escribà et al.: Probabilistic prediction of raw and BMA calibrated AEMET-SREPS                                              123

                Figure of
obabilistic prediction 7: mean
                          H+36wind
                               raw AEMET-SREPS.
                                   speed greater thanProbabilistic
                                                      10           prediction of mean wind speed greater than 20 m/s
s are plotted in(left) and 25 m/s (right). Observations are plotted in red (m/s).
                 red (m/s).

              Figure 7: H+36 raw AEMET-SREPS. Probabilistic prediction of mean wind speed greater than 20 m/s
                                                                      Figure
              (left) and 25 m/s (right). Observations are plotted in red     8: H+36 AEMET-SREPS calibrated with BMA. Probabi
                                                                         (m/s).
                                                                      greater than 10 m/s (left) and 15 m/s (right). Observations are p

             Fig. 7. H+36 raw AEMET-SREPS. Probabilistic prediction of mean     Fig. 8. H+36 AEMET-SREPS calibrated with BMA. Probabilistic
obabilistic prediction   of mean
            wind speed greater       wind
                               than 20       speed
                                       m/s (top) and greater   than 20
                                                     25 m/s (bottom).   m/s
                                                                      Observa-  prediction of mean wind speed greater than 10 m/s (top) and 15 m/s
             tions are plotted in red (m/s).
             Figure
 plotted in red     8: H+36 AEMET-SREPS calibrated with
                (m/s).                                                       BMA. Probabilistic
                                                                                (bottom).          prediction
                                                                                          Observations are plottedof
                                                                                                                   in mean   wind speed
                                                                                                                      red (m/s).
             greater than 10 m/s (left) and 15 m/s (right). Observations are plotted in red (m/s).
             4.2   Did BMA improve probabilistic forecast?                   does not correspond to the actual behaviour of NWP mod-
                                                                             els on predicting wind. In Fig. 10 are represented 568 pairs
            No, in fact here BMA makes the forecast worse. As it is
                                                                             of observed and predicted values of wind speed using IEC
            shown in Fig. 8 probabilistic forecast is significantly worse
                                                                             member of SREPS (Table 1), corresponding to the training
            for H+36
           Figure      with respect
                   8: H+36           to raw ensemble
                              AEMET-SREPS              (Fig. 6). with
                                                    calibrated   ThereBMA.
                                                                       is a Probabilistic prediction of mean wind speed
                                                                             period. Looking at the figure this member tends to overpre-
            generalthan
           greater   tendency  of underestimating
                           10 m/s                  wind(right).
                                   (left) and 15 m/s     speed. Observations are plotted in red (m/s).
                                                                             dict wind speed for low values whereas it underpredicts wind
               In order to find the reason of this result we take a look at
                                                                             when it is strong. It can be demonstrated that this behaviour
            Eq. (1). f K is the bias-corrected forecast of the ensemble
                                                                             is common for NWP models. So that BMA bias correction of
            member K. In our case we apply a simple linear correction
                                                                             24Jan09 extreme wind event calculated from the previous 3
            of bias, that is,
                                                                             days eventually reduces wind intensity, giving an erroneous
            f K = a + bfK                                               (2)  forecast.
             Here a and b are bias coefficients and fK the raw forecast.
               Figure 9 shows the magnitude of this correction when
             computing bias using the 3 previous days as training period.
             As it can be seen, for high values of predicted wind (above
             4 m/s), bias correction reduces wind values. This correction

             www.adv-geosci.net/26/119/2010/                                                                   Adv. Geosci., 26, 119–124, 2010
 with BMA. Probabilistic prediction of mean wind speed
 Observations are plotted in red (m/s).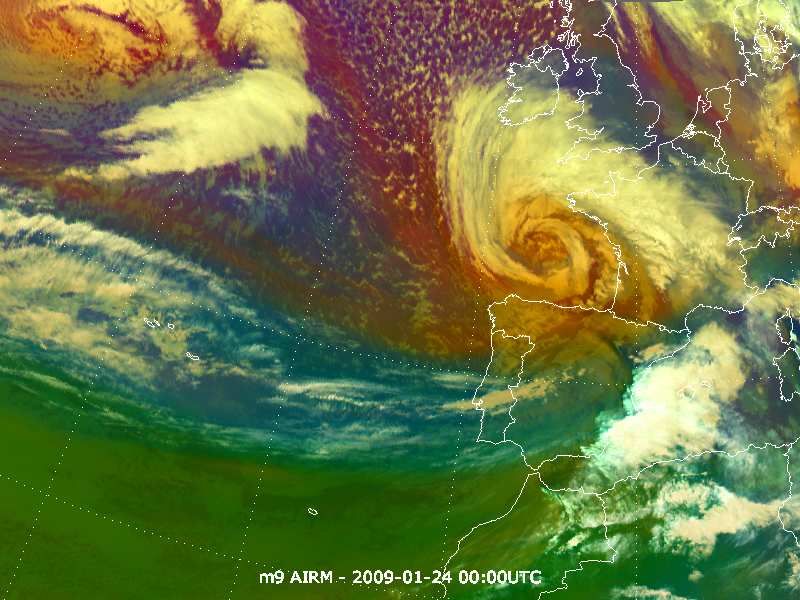
124 P. Escribà et al.: Probabilistic prediction of raw and BMA calibrated AEMET-SREPS
20 90% 36 hours before the event.
When we apply the standard formulation of BMA to this
16 high intensity wind speed event, probabilistic forecast is bad
HAV
calibrated. This problem is mainly due to the fact that strong
FC_K (m/s)
12 HEC
winds are rare events and they have a high variability in space
IUK
8 and time. Then training periods which don’t have strong
MEC
winds may cause that computed bias cannot be applied to
UEC
4 calibrate probabilistic forecasts of these events. Thus we
conclude that in the case of strong winds no calibration of
0 predictive PDF is desirable.
0 4 8 12 16 20 24 This work supports the decision taken by AEMET to
F_K (m/s) launch a SREPS based on the multi-model multi-analysis and
multi-boundary conditions technique. As the ensemble sys-
Fig. 9. Linear correction of bias per member. F CK isf the
Figure 9: Linear correction of bias per member. FC_K is the bias-corrected forecast, in
bias-
(1), and F_K is tem approximates the daily dynamics of the real atmosphere
the
K
corrected forecast, fˆ in (1), and Fweight
raw forecast, f K in (2). Only the kmembers that have a K
is the raw forecast, f in (2).
significantly different fromk0 are represented. (It is constructed combining several NWP models) it can be
Only the members that have a weight significantly different from 0 inferred that these results can also be found in other simi-
are represented.
lar situations. Despite its high cost in human and computa-
tional resources AEMET-SREPS seems to be a powerful tool
20 to make skilful probabilistic forecasts in the mesoscale and
the short range.
Acknowledgements. The authors would like to especially thank the
National Weather Services of Germany (DWD), United Kingdom
15 (UKMO), Canada (SMC) and United States (NCEP) and the
H+36 Predicted (m/s)
ECMWF for daily providing us the data of their global operational
forecasting models. We also thank Adrian Raftery and his group for
developing and sharing BMA software for ensemble calibration.
Finally we thank Raquel Sanclaudio for helping us to plot graphics
10
with Metview.
Edited by: A. Mugnai
Reviewed by: one anonymous reviewer
5
References
4th Workshop on Short Range Ensemble Prediction Systems,
0 Exeter, UK, online available at: http://www.metoffice.gov.uk/
0 5 10 15 20 conference/srnwp workshop, June 2009.
Garcı́a-Moya, J. A., Callado, A., Santos, C., Santos-Muñoz D., and
Observed (m /s) Simarro, J.: Predictability of Short-Range Forecasting: A multi-
model approach”, AEMET Technical Memorandum, NT SPPE-
Fig. 10. Scatter plot of IEC (Table 1) H+36 predictions of wind 1, 30 pp., 2009.
speed against observations. 568 realizations during the 21–23 Jan- Hou, D. and Kalnay, E.: Objective verification of the SAMEX98
uary10
Figure 2009 training period. ensemble forecasts, Mon. Weather Rev., 129, 73–91, 2001.
Palmer, T. N., Alessandri, A., Andersen, U., Cantelaube, P., Davey,
M., Délécluse, P., Déqué, M., Dı́ez, E., Doblas-Reyes, F. J., Fed-
dersen, H., Graham, R., Gualdi, S., Guérémy, J.-F., Hagedorn,
5 Conclusions
R., Hoshen, M., Keenlyside, N., Latif, M., Lazar, A., Maison-
nave, E., Marletto, V., Morse, A. P., Orfila, B., Rogel, P., Terres,
In this work we have shown the skill of AEMET-SREPS pre- J.-M., and Thomson, M. C.: Development of a European multi-
dicting the 24Jan09 extreme wind event in the local area of model ensemble system for seasonal to inter-annual prediction
Catalunya. 60 hours before the event, raw AEMET-SREPS (DEMETER), B. Am. Meteorol. Soc., 85, 853–872, 004.
is able to define very well the three main affected areas, say Raftery, E.: Using a Bayesian Model Averaging to Calibrate Fore-
Tarragona, Pirineus and Perpinyà (Fig. 5). It is of particu- casts Ensembles. Technical Report no. 40, Department of Statis-
lar interest the skill of the system in forecasting very strong tics, University of Washington, USA, 2003.
winds in the coasts of Tarragona and Perpinyà. A probability
of wind speed greater than 10 m/s at Tarragona is larger than
Adv. Geosci., 26, 119–124, 2010 www.adv-geosci.net/26/119/2010/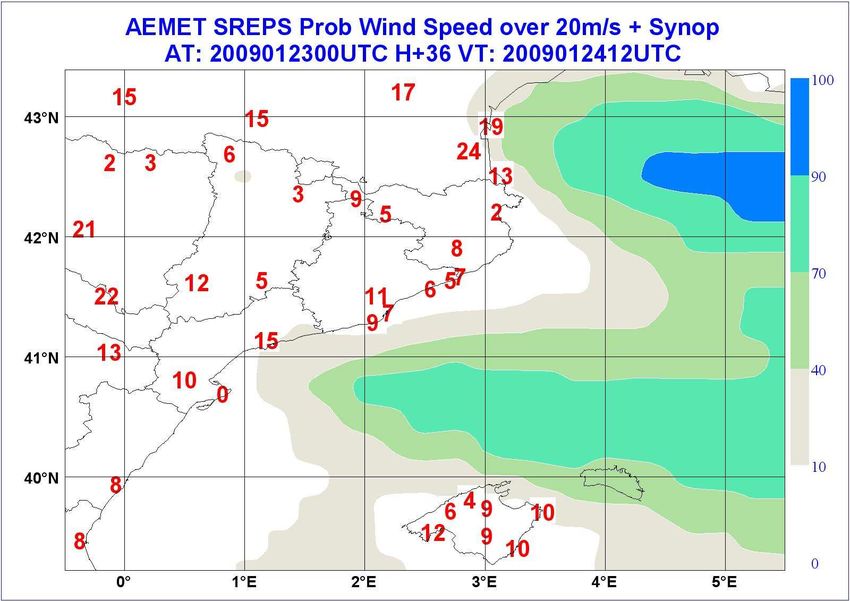
You can also read