Earthquake Source Process and Strong Ground Motions of the 2010 Chile Mega-Earthquake
←
→
Page content transcription
If your browser does not render page correctly, please read the page content below
Earthquake Source Process and Strong Ground
              Motions of the 2010 Chile Mega-Earthquake

           Nelson PULIDO1, Toru SEKIGUCHI2, Gaku SHOJI3 , Jorge ALBA4, Fernando
                               LAZARES5, and Taiki SAITO6
                     1Researcher, National Research Institute for Earth Science and Disaster Prevention
                                      (3-1 Tennodai, Tsukuba, Ibaraki, 305-0006, Japan)
                                                  E-mail:nelson@bosai.go.jp
                     2 Assistant Professor, Chiba University, Department of Urban Enviroment Systems
                                     (1-33 Yayoi-cho, Inage-ku, Chiba 263-8522, Japan)
                                             E-mail: tsekiguc@faculty.chiba-u.jp
                               3Member of JSCE, Associate Professor, University of Tsukuba
                                     (1-1-1 Tennodai, Tsukuba, Ibaraki 305-8573, Japan)
                                              E-mail: gshoji@kz.tsukuba.ac.jp
                                    4 Professor, Universidad Nacional de Ingenieria, Peru
                                           (Av. Tupac Amaru 1150, Lima 25, Peru)
                                                 E-mail: jalvah@terra.com.pe
                              4 Researcher, Universidad Nacional de Ingenieria, CISMID, Peru
                                           (Av. Tupac Amaru 1150, Lima 25, Peru)
                                                E-mail: f_lazares@uni.edu.pe
                                6Chief Research Engineer, IISEE, Building Research Institute
                                   (1 Tachihara, Tsukuba-shi, Ibaraki-ken 305-0802, Japan)
                                                  E-mail:taiki@kenken.go.jp

         We report on a reconnaissance survey on the seismological and geotechnical aspects of the 27 February,
      2010 Maule mega-earthquake, Chile, carried out between April 27 and May 1, 2010. The survey was
      sponsored by the Japan Science and Technology Agency and JICA (SATREPS). In this study we surveyed
      the cities of Concepción Viña del Mar and Santiago. We also performed microtremors measurements at
      strong motion stations sites that recorded the earthquake. We will give an outline of the fault rupture
      process and strong motion characteristics of the earthquake.

        Key Words : 2010 Chile earthquake, strong motion, source process, permanent displacement, site effects,
                     microtremors H/V

1. INTRODUCTION

   The 2010/2/27 Maule (Chile) mega-earthquake, the fifth largest earthquake in instrumental history, was
located in the subduction of the Nazca plate in Meridional Andes beneath the South American plate. This
earthquake fills a well studied seismic gap between the source areas of the largest ever recorded 1960 Great
Valdivia earthquake (M 9.5), and the 1985 Valparaiso earthquake (M7.8) 1). In this study we report on a re-
connaissance survey on the seismological and geotechnical aspects of the 27 February, 2010 Maule
mega-earthquake, Chile, carried out between April 27 and May 1, 2010. The survey was sponsored by the
Japan Science and Technology Agency and JICA (SATREPS), under the framework of a newly launched 5
years SATREPS project entitled “Enhancement of Earthquake and Tsunami Disaster Mitigation Technology in
Peru” 2). In this study we surveyed the heavily damaged city of Concepción, as well as moderately damaged
cities of Viña del Mar and Santiago (Figure1). We performed microtremors measurements at strong motion
stations sites that recorded the earthquake in order to investigate their site characteristics. We also surveyed the
damage to buildings due to tsunami effects in Dichato and Talcahuano among other areas but these results are
reported elsewhere3).

                                                             1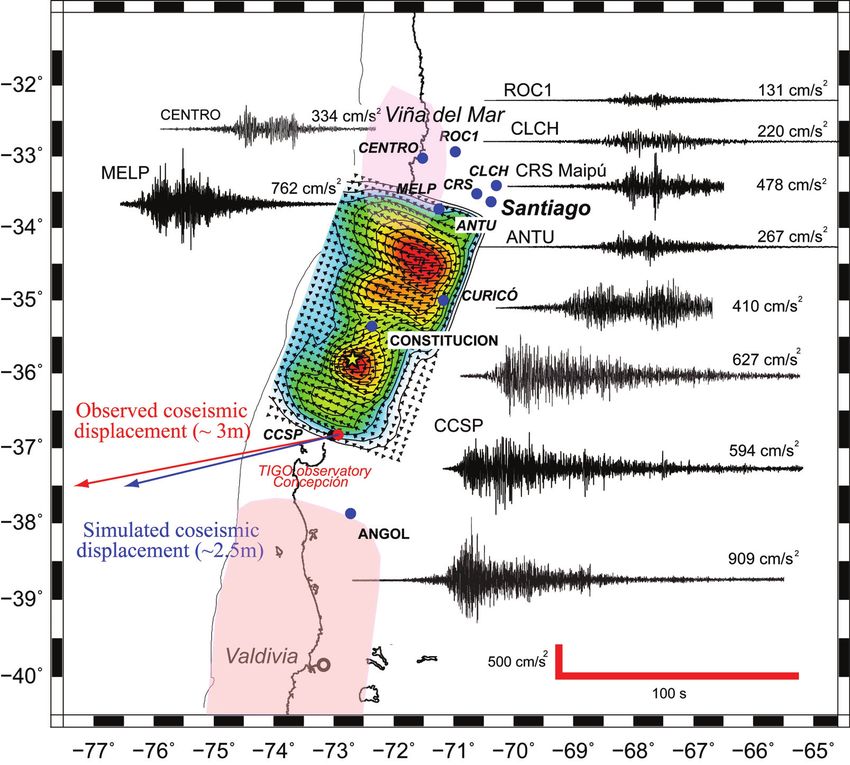
Figure 1. Location of sites for field survey         Figure 2. Intensity distribution of the Maule earthquake
                                                            based on questionnaire survey4).

2. SOURCE PROCESS OF THE MAULE EARTHQUAKE

   The Maule earthquake ruptured a source area of nearly 450 km extending from southern Santiago in the
North, down to the Arauco Peninsula south of Concepción city. The intensity distribution obtained from a
questionnaire survey soon after the earthquake4), indicates that a region of nearly 350 km above the fault plane
experienced an intensity larger than 5 upper in the JMA intensity scale (Figure 2). This earthquake was an
inter-plate mega-subduction event with a pure reverse mechanism, and had a seismic moment magnitude of 8.8
(Figure 3). The source rupture model of this earthquake was obtained by inversion of 38 P-wave teleseismic
waveforms of the FDSN and GSN global seismic networks and using an inversion technique that incorporates
an error component in Green’s function calculation and the Akaike’s Bayesian Information Criteria (ABIC) 5).
The source process is characterized by two asperities with a peak slip of nearly 8m and a rupture area of ap-
proximately 450 by 200 km2 6). The first asperity is located at the hypocenter and the second is located ap-
proximately 170 km north-east of the hypocenter. The rupture propagated bilaterally starting slightly south of
Constitución and with an average rupture velocity of 2.6 km/s, however the main moment release was located
towards the North in the Pichilemu region. The source moment function has a total source duration of 130s and
display two sub-events separated by 50s (Figure 3). The average rake angle of this earthquake is 100 degrees
which approximately corresponds to the oblique convergence of the Nazca plate beneath the South American
plate.

3. STRONG MOTION CHARACTERISTICS

  The Maule earthquake was recorded by 30 strong motion stations belonging to Universidad de Chile (Ser-
vicio Sismológico Nacional SSN, Geophysics department, 10 stations,         and Red Nacional de

                                                       2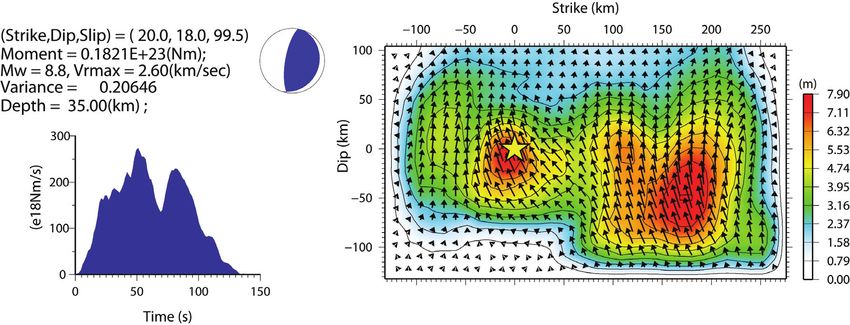
Figure 3. Source model of the 2010/02/27 Maule mega-earthquake (Chile)6).

                       Figure 4. Source model and strong ground motion recordings of the 2010/02/27
                       Maule mega-earthquake (Chile)6).

acelerógrafos, RENADIC, Civil Engineering department, 20 stations). Instruments are mostly digital (21), and
a large number of them is localized in Santiago (10) (Table 1). Published maximum PGA and PGV values
reached 909 cm/s at the Angol station south of Concepción, and 69 cm/s at Constitución (Table 1, Figure 4).
Strong ground motions recorded in the northern region of the source area such as Curicó, Santiago and Viña del
Mar display two clear sub-events separated by 15s to 30s, which is consistent with a rupture propagation ve-
locity value of 2.6 km/s (Figure 4). Stations towards the central and southern regions of the source area such as
Constitución, Concepción and Angol do not diplay distinct sub-events, as the rupture propagation of the
northern asperity gradually runs away from southern stations. Angol station displays the largest PGA which

                                                           3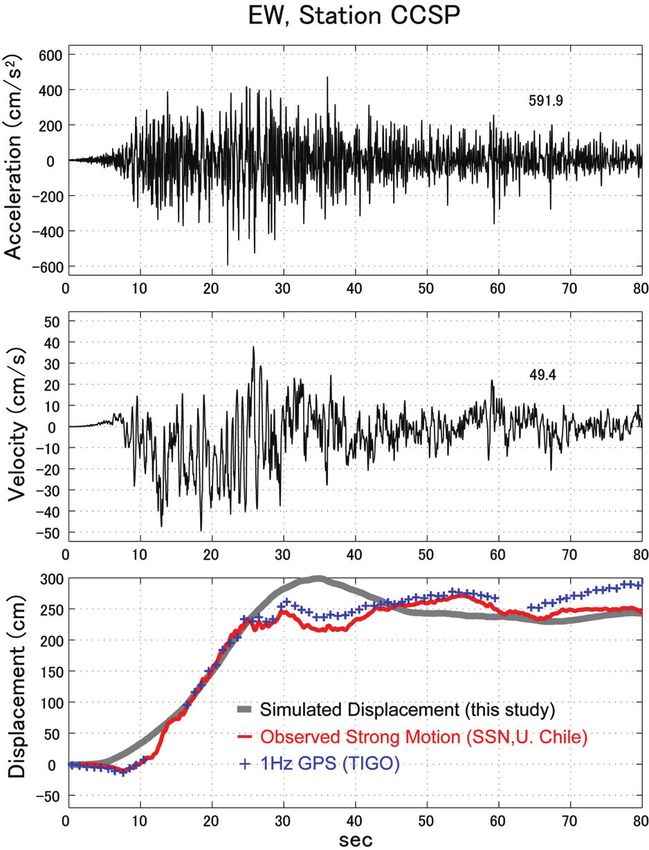
Table 1. Strong ground motion stations that recorded the 2010/02/27 Maule mega-earthquake

                                             Station                           Instrument                              PGA       PGV
          Station Location                                Organization                         Longitude   Latitude
                                              Code                                Type                                (cm/s2)   (cm/s)
Concepción                                    CCSP             SSN2               ETNA         -73.1087    -36.8443    637       44
                                                                  2             Episensor,
Santiago (Campus Antumapu)                   ANTU              SSN                             -70.6335    -33.5691    267       25
                                                                                Earth data
                                                                                Episensor,
Cerro El Roble                                ROC1             SSN2                            -71.0156    -32.9759    184       21
                                                                              Q330 digitizer
                                                                              SSA-120SLN,
Santiago (Cerro Galán)                       CLCH              SSN2                            -70.5369    -33.3961    220       29
                                                                               Terra Techn.
Melipilla                                    MELP              SSN2               QDR          -71.2138    -33.6874    762       46
                                                                  2
Olmué (10 km West of El Roble)               OLMU              SSN                QDR          -71.1730    -32.9940    347       28
Casablanca, Teatro municipal                 CSCH              SSN2               QDR          -71.4108    -33.3208    322       44
San José de Maipó1                           SJCH              SSN2              Makalu        -70.3510    -33.6440    471       63
Santiago (Colegio las Américas)              LACH            SSN2                Makalu        -70.5308    -33.4518    302       34
Santiago (Cerro Santa Lucía)                  STL            SSN2                Makalu        -70.6428    -33.4405    332       46
Papudo (V Región)1                             -           RENADIC3              SMA-1         -71.4440    -32.5090    413       25
Viña del Mar Marga-marga (V
                                                           RENADIC3              ETNA          -71.5099    -33.0482    344       45
Región)                                          -
Viña del Mar Centro (V Región)                   -         RENADIC3               QDR          -71.5508    -33.0253    327       33
                                                                      3
Valparaíso UTFSM (V Región)                      -         RENADIC               SMA-1         -71.5956    -33.0346    261       16
                                        1                             3
Valparaíso Almendral (V Región)                  -         RENADIC               SMA-1         -71.6130    -33.0560    298       29
Llolleo (V Región)1                              -         RENADIC3              SMA-1         -71.6150    -33.6130    553       31
Santiago FCFM RM                                 -         RENADIC3              ETNA          -70.6617    -33.4572    162       22
Santiago centro RM (Based Iso-
lated building Comunidad Anda-                             RENADIC3               SSA-2        -70.6520    -33.4670    303       26
lucia)1                                          -
Santiago Maipú RM (CRS Maipú)                    -         RENADIC3               QDR          -70.7719    -33.5087    550       44
Santiago Peñalolen RM (Hospital
                                                           RENADIC3               QDR          -70.5792    -33.5006    289       29
Luis Tisne)                                      -
Santiago Puente Alto RM (Hos-
                                                           RENADIC3               QDR          -70.5811    -33.5769    260       31
pital Sotero del Rio)                            -
Santiago La Florida RM (Linea 5,
                                                           RENADIC3                K2          -70.6060    -33.5135    231       19
Mirador)                                         -
Matanzas (VI Región)                             -         RENADIC3              SMA-1         -71.8734    -33.9604    335       43
Hualañe (VII Región)                             -         RENADIC3              SMA-1         -71.8053    -34.9765    452       39
Curico (VII Región)                              -         RENADIC3               QDR          -71.2364    -34.9808    461       33
Talca (VII Región)                               -         RENADIC3              SMA-1         -71.6649    -35.4299    467       33
Constitución (VII Región)                        -         RENADIC3              SMA-1         -72.4057    -35.3401    627       69
Concepción (VIII Región),                                             3
                                                 -         RENADIC               SMA-1         -73.0483    -36.8281    394       68
Colegio Inmaculada Concepción
Angol (IX Región)                                -         RENADIC3               QDR          -72.7081    -37.7947    909       38
Valdivia (XV Región)                             -         RENADIC3               QDR          -73.2133    -39.8244    135       18

Notes
1
  approximate station coordinates from Google Earth
2
  Servicio Sismológico Nacional, Universidad de Chile
3
  Red Nacional de Acelerógrafos, Universidad de Chile
4
  Most infomation for this table was compiled from 7,8,9,10)

                                                                          4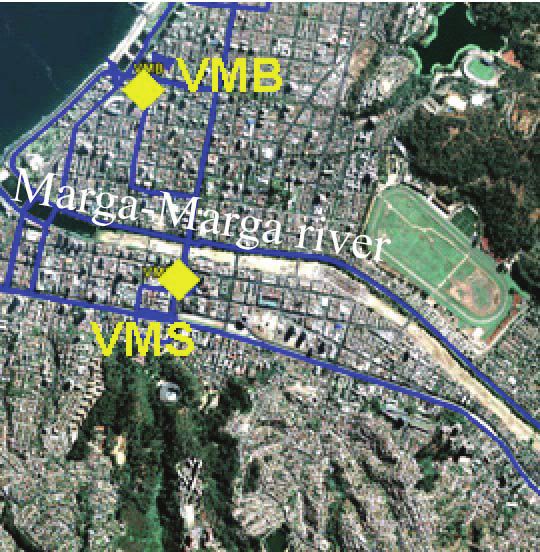
Figure 5. Attenuation of PGA and PGV for observed strong motions Maule mega-earthquake

indicates the possibility of large slip below the Arauco peninsula (around latitude -37.5 degrees), that is not
sufficiently simulated in our current slip model. In fact a recent study indicates that the Arauco peninsula
experienced a maximum coseismic uplift of 2.5m along the coast, suggesting that the source area could have
reached a latitude as far as -38 degrees11), which approximately corresponds the northern end of the 1960
Valdivia earthquake.
   In Figure 5 we plotted the PGA and PGV attenuation characteristics of observed strong ground motions of
the Maule earthquake, for all the sites described in Table 1. We plot the data together with an empirical rela-
tionship of PGA and PGV for inter-plate subduction earthquakes (Mw=8.8, depth 35 km) for soil, stiff soil and
rock site conditions12). We may observe that all observed data falls within one sigma (+/-0.3) around the
values for a stiff soil. This result implies that the observed peak ground motions characteristics from the Maule
earthquake can be satisfactorily explained by a typical empirical attenuation relationship for inter-plate sub-
duction earthquakes.

4. PERMANENT DISPLACEMENT AT CONCEPCION

   GPS measurements from the Maule earthquake in South America indicate a coseismic displacement to the
West as large as 3m at the CONZ station in Concepción (Figure 7). CONZ is a high sampling GPS (cGPS)
station located at the Transportable Integrated Geodetic Observatory (TIGO), which recorded in real time the
Maule earthquake 13). We attempted to calculate the permanent displacement at Concepción by using a strong
motion recording of the earthquake at the CCSP station, which is closely located to the TIGO observatory. For
that purpose we double integrated and de-trended the unfiltered acceleration data. Our results show nearly 3m
of permanent displacement to the West, which is in very good agreement with the results by the cGPS re-
cording at TIGO (Figure 7). Displacement time series obtained from this strong ground motion recording are
also in close agreement with the observed cGPS from the arrival of the rupture up the static displacement value.
   We also calculated the theoretical displacement time series at CONZ by using our source model of the Maule
earthquake (thick gray line in lower panel of Figure 7). For this purpose we calculated the convolution of the
source time function at every subfault with the corresponding source-site Green’s functions, and added every
subfault contribution by considering the appropiate subfault rupture time delay 6). Our simulation results show
a very good aggreement with the observed displacement time series obtained from the observed strong ground
motion and cGPS (lower panel of Figure 7). Our results show that the final dislocation value of 3m is achieved
approximately 20s after the arrival of the rupture front.

5. MICROTREMORS MEASUREMENS AT STRONG MOTION SITES

                                                           5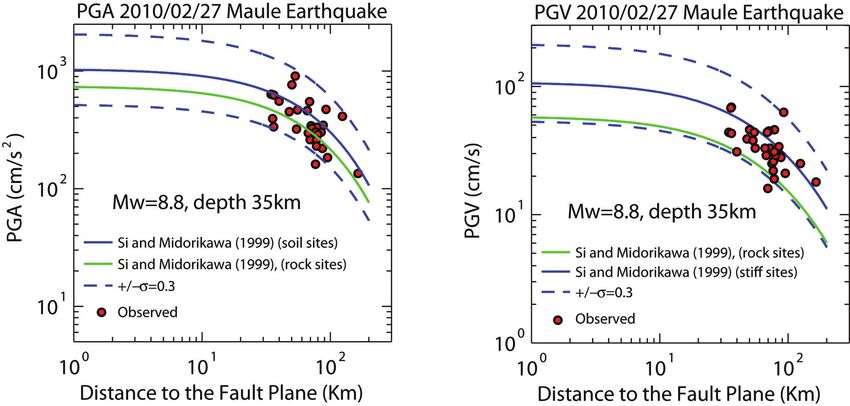
Figure 6. Coseismic displacements at South Ameri- Figure 7. Strong ground motion recording of the 2010/02/27 Maule
can GPS stations during the2010/02/27 Maule mega-earthquake (Chile) at the Colegio San Pedro (Concepción),
mega-earthquake (Chile). Displacements at Concep- strong motion site. Upper panel shows the unfiltered acceleration,
ción are as large as 3 m to the West14). middle panel the unfiltered and de-trended velocity, and the lower
panel the calculation of the permanent displacement at this station 6).
In order to estimate the site characteristics at strong motion sites that recorded the mainshock we performed
microtremors measurements in Concepción, Viña del Mar and Santiago cities. We do not introduce results of
measurements in Santiago in this report as similar results were presented elsewhere15). The microtremors
measurements where performed by using a velocity sensor with predominant period of 2s and a sampling
frequency of 200 Hz. Measurement time at each site was set to 300s.
(1) Measurements at Concepción city
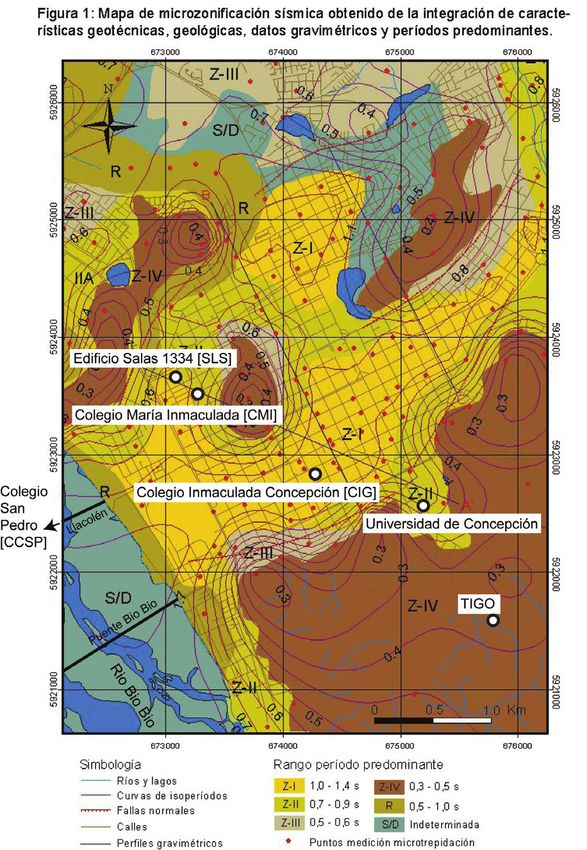
In Figure 8 we show the microtremors measurements sites as well as other survey sites on a microzonation
map of Concepción city16). This microzozonation is based on H/V measurements as well as other geological
and geotechnical information. A yellow region on the map (Z-I) corresponds to H/V peaks of 1.0-1.4s. We can
observe that the dowtown area is largely characterized by a predominant peak around 1s. On the other hand in
the South-West area of downtown runs the Bio-Bio river which suggest that the soil condition in this region
might be characterized by thick alluvial deposits. We performed microtremors measurements at four sites
including two schools in down-town; Colegio inmaculada Concepción (CIG), Colegio María Inmaculada
(CMI), a heavily damaged (to be demolished) 12 stories reinforced concrete building (Edificio Salas 1334,
SLS), and another school located in the opposite shore of the Bio-Bio river in a mountain footslope area
(Colegio San Pedro) (Figure 8). Our H/V measurements at CIG and SLS show a predominant peak larger than
1s, and a peak of 0.7s at CMI (Figure 9). The heavy damage sustained at SLS might be related with the large
H/V peak at this site. The underground floor of the CIG building accomodates a RENADIC analogue acele-
rograph that recorded a PGA value of 394 cm/s2 and a PGV of 68 cm/s. This building sustained a moderate
damage and according to the shool principal an older section of the school also experienced the 1960 Valdivia
earthquake. Our H/V measurements at Colegio San Pedro where located near the CCSP strong motion station
within the school premises. This site recorded a PGA value of 637 cm/s2 and a PGV of 44 cm/s. The school is
built on a sandy soil area within a small valley, and the CCSP is located at the egde of the valley near a slope.
A 1 story classroom located close to the strong motion station sustained significant damage produced by
6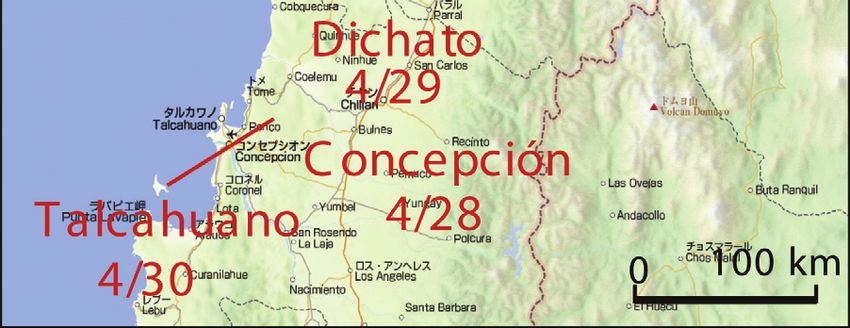
Figure 8. Microzonation map of Concepción city16). Survey       Figure 9. H/V ratios of microtremors in downtown
    sites are shown within the figure                               Concepción city

subsidence of the ground. Although H/V measurements close to the CCSP station do not show significant
peaks (Figure 9), another H/V measurement at the school ground in the middle of the valley show a clear peak
around 0.3s. This indicates that the CCSP station is located at the edge of the valley sandy soil deposits17).

(2) Measurements at Viña del Mar city

   We surveyed two areas in down town Viña del Mar. The first area (VMS) is located in the southern region of
the Marga Marga river close to the RENADIC Viña del Mar Centro strong motion station (Figure 10). Our
survey indicates no building damage around this area. We also surveyed the area to the north of Marga-Marga
river (VMB). In this case we found a heavy concentration of damage to medium rise apartment buildings. Our
H/V measurements at VMS indicate a clear peak around 0.4s. This site experienced a PGA value of 327 cm/s2
and a PGV of 33 cm/s respectively. On the other hand H/V measurements at VMB show a clear peak at 1s.
These measurements suggest that the site effects may have had a big contribution to the building damage at
VMB, and indicate the ground motion might have been stronger at the Nothern part of Marga-Marga river
compared to the Southern area.

6. CONCLUSIONS

  We performed a field survey of the 2010 Chile earthquake which included visits to several universities in
Santiago, Concepción and Viña del Mar, as well as microtremor measurements near strong motion stations at
these cities. Near-source strong ground motions characteristics of the mainshock are largely influenced by
complexity in source rupture process. On the other hand ground motion attenuation characteristics of this
earthquake can be satisfactorily explained with a typical empirical law for inter-plate subduction earthquakes.

                                                                7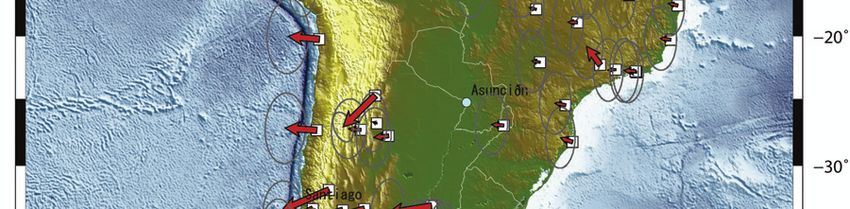
Figure10. H/V of microtremors measurements near strong motion station Viña del mar Centro
                       [VMS], and within the building damage area [VMB] in Viña del mar

Based on a strong motion recording of the mainshock we obtained a 3m permanent displacement to the west at
Concepción city, which is in very good agreement with the results obtained by a 1Hz GPS recording of the earth-
quake at the TIGO observatory in Concepción. Our theoretical calculations of the displacement time series at
Concepción are also in good agreement with the observed data. Our microtremors measurements and field
survey indicates a clear relationship between site effects and building damage. Future research work includes
the improvement of our source model using constraints from near-source data as well as the strong motion
simulation of this earthquake.

ACKNOWLEDGMENT: We would like to thank Sergio Barrientos, Jaime Campos, Ruben Boroschek as
well as other members of Universidad de Chile, Universidad de Concepción, and Universidad de Valparaiso.
Strong motion data used in this study belongs to Servicio Sismológico Nacional, Universidad de Chile.

REFERENCES
1) Ruegg, J.C., A. Rudloff, C. Vigny, J.B. de Chabalier, J. Campos, E. Kausel, S. Barrientos, and D. Dimitrov. Interseismic strain
    accumulation measured by GPS in the seismic gap between Concepción-Constitución in Chile. Physics of Earth and Planetary
    Interiors, 175, 78-85, 2009.
2) Yamazaki, F., Zavala, C., Nakai, S., Koshimura, S., Saito, T., Midorikawa, S.,Enhancement of earthquake and tsunami disaster
    mitigation technology in Peru: A SATREPS project, 7th International Conference on Urban Earthquake Engineering, Tokyo In-
    stitute of Technology, Tokyo, Japan, 2010.
3) Shoji, G., Pulido N., Sekiguchi T., Alva J., Lazares F., and T. Saito. DAMAGE INVESTIGATION OF THE 2010 CHILE
    EARTHQUAKE AND TSUNAMI – CONSIDERATION TO THE DAMAGE OF A STRUCTURE SUBJECTED TO A
    SEISMIC EXCITATION AND A FOLLOWING TSUNAMI WAVE LOAD, 13th Japan Earthquake Engineering Symposium,
    2010. (in Japanese)
4) Astroza, M., Cabezas F., Moroni M., Massone L., Ruiz S., Parra E., Cordero F., and A. Mottadelli. INTENSIDADES SISMICAS
    EN EL AREA DE DAÑOS DEL TERREMOTO DEL 27 DE FEBRERO DE 2010, Internal Report Universidad de Chile,
    Departamento de Ingeniería Civil, 2010. (in Spanish)
5) Yagi, Y. and Y. Fukahata. Importance of covariance components in inversion analyses of densely sampled observed data: an ap-
    plication to waveform data inversion for seismic source processes. Geophysical Journal International, 175, 215–221, 2008.
6) Pulido, N. and Y. Yagi. Source process and strong motion simulation of the Central-Chile, Maule earthquake, American Geo-
    physical Union, Joint Assembly 2010, Meeting of the Americas, Iguassu, Brasil, 8/2010.
7) Barrientos, S., TERREMOTO CAUQUENES 27 FEBRERO 2010, Servicio Sismológico, Universidad de Chile, Informe Tecnico
    Actualizado 27 Mayo 2010, 5/2010a. http://ssn.dgf.uchile.cl/informes/INFORME_TECNICO.pdf (in Spanish)
8) Barrientos, S., Acelerogramas del Terremoto del 27 de Febrero 2010 registrados por DGF, Servicio Sismológico, Universidad de
    Chile, Informe Tecnico Actualizado 27 Mayo 2010, 5/2010b. http://ssn.dgf.uchile.cl/informes/sismogramas.zip
9) Boroschek, R., P. Soto, and R. Leon. Report Maule Region Earthquake February 27, 2010 Mw=8.8, Universidad de Chile Facultad
    de Ciencias Físicas y Matemáticas, Departamento de Ingeniería Civil, Informe RENADIC 10/08, 8/2010a.
    http://www.cec.uchile.cl/~renadic/red_archivos/RENAMAULE2010.pdf
10) Boroschek, R. Mapa actualizado de estaciones en la zona del Terremoto del 27 de Febrero 2010, Universidad de Chile Facultad de
    Ciencias        Físicas    y     Matemáticas,       Departamento       de      Ingeniería     Civil,     RENADIC,       2010b.
    http://www.cec.uchile.cl/~renadic/red_archivos/ESTACIONES 20EQ 20CHILE 202010_RBoroschek.kmz
11) Farías M.,Vargas G.,Tassara A., Carretier S., Baize S.,Melnick D., and K. Bataille. Land-Level Changes Produced by the Mw 8.8
    2010 Chilean Earthquake, Science, 329, 916, DOI: 10.1126/science.1192094, 2010.
12) Si, H. and S. Midorikawa. Attenuation Relations for Peak Ground Acceleration and Velocity Considering Effects of Fault Type
    and Site Condition, Journal of Struct. Construct. Eng. (Transactions of AIJ),523, 63-70, 1999. (in Japanese)
13) Sierk, B., and H. Hase. El terremoto de Chile desde la perspective científica, Transportable Integrated Geodetic Observatory

                                                                8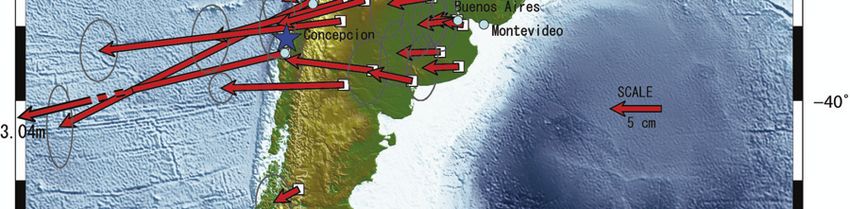
(TIGO), 2010. http://www.tigo.cl/documents/PresDAAD.pdf (in Spanish)
14) Foster, J., and B. Brooks. Science Highlights 2010 - UNAVCO Event Response - Mw=8.8 Chile Earthquake Feb. 27, 2010.
    http://www.unavco.org/research_science/science_highlights/2010/M8.8-Chile.html
15) Midorikawa, S. Earthquake and earthquake motion, Report on the joint survey of the 2010 Chile earthquake, 2010.
    http://www.jaee.gr.jp/disaster/2010/2010chile.html (in Japanese)
16) Ramírez P. and J. Vivallos. Microzonificación sísmica de la ciudad de Concepción – Chile, XII Congreso Geológico Chileno,
    Santiago, 22-26 Noviembre,, 2009. (in Spanish)
17) Sekiguchi, T., Pulido N., Shoji G., Alva J., Lázares F., and T. Saito. Damage Investigation of the 2010 Chile Earthquake and
    Tsunami -Seismic Ground Motion and Site Effects-. 13th Japan Earthquake Engineering Symposium, 2010. (in Japanese)

                                                               9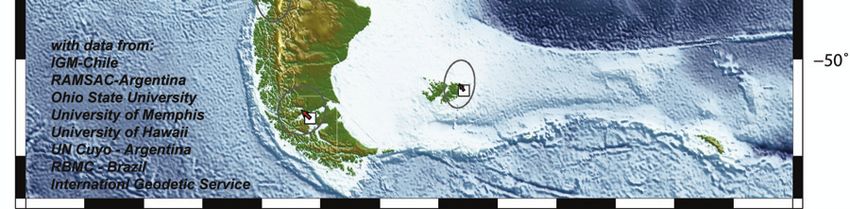
You can also read