Job vacancies during the Covid-19 pandemic - IFS Briefing Note BN289 Monica Costa Dias Agnes Norris-Keiller Fabien Postel-Vinay Xiaowei Xu ...
←
→
Page content transcription
If your browser does not render page correctly, please read the page content below
Job vacancies during the Covid-19 pandemic

IFS Briefing Note BN289

Monica Costa Dias
Agnes Norris-Keiller
Fabien Postel-Vinay
Xiaowei Xu
Job vacancies during the Covid-19 pandemic

Monica Costa Dias, Agnes Norris-Keiller, Fabien Postel-Vinay and Xiaowei Xu

Published by

The Institute for Fiscal Studies

ISBN: 978-1-912805-79-2

Funding from the ESRC-funded Centre for the Microeconomic Analysis of Public Policy
(ES/M010147/1) is gratefully acknowledged.
Job vacancies during the Covid-19 pandemic

Executive summary
       Key findings

       By the time the lockdown was announced, firms had stopped posting new
       vacancies almost entirely. New postings on 25 March were just 8% of their levels
       in 2019.

       Vacancies fell across the wage distribution. The fall was sharpest in low-paid
       occupations directly affected by social distancing measures, but new vacancies
       for higher-paid jobs in legal and managerial professions also saw falls of over 60%
       relative to 2019.

       There have been some tentative signs of recovery since mid-April, but this has
       been entirely driven by vacancies in health and social care. Health and social care
       vacancies rebounded from half their 2019 levels in the first week of April to 85% of
       their 2019 levels in the first week of May. In all other occupations, new vacancies
       in the first week of April were 21% of their 2019 levels, and still only 26% of their
       2019 levels in the first week of May.

       Whilst the initial drop in job postings was evenly distributed across more and less
       deprived areas, the recovery in health and social care vacancies has been
       concentrated in more affluent areas. New health and social care vacancies in the
       least deprived fifth of local authorities (measured by their Index of Multiple
       Deprivation) were 15% lower than their 2019 levels in the first week of May, whilst
       those in the most deprived fifth still 35% lower.

       The health and social care occupations in which vacancies are recovering pose
       relatively high health risks. They are relatively difficult to do from home,
       involving working in close physical proximity to others and are more exposed to
       disease.

       The new jobs that are emerging require high levels of training. Jobs in health and
       social care typically require a high level of training, but even outside healthcare,
       labour demand has recovered more in occupations that require higher levels of
       preparation. This suggests that workers who have been furloughed or made
       unemployed are likely to struggle to fill vacancies in areas where labour demand
       is recovering.

2                                                                            © Institute for Fiscal Studies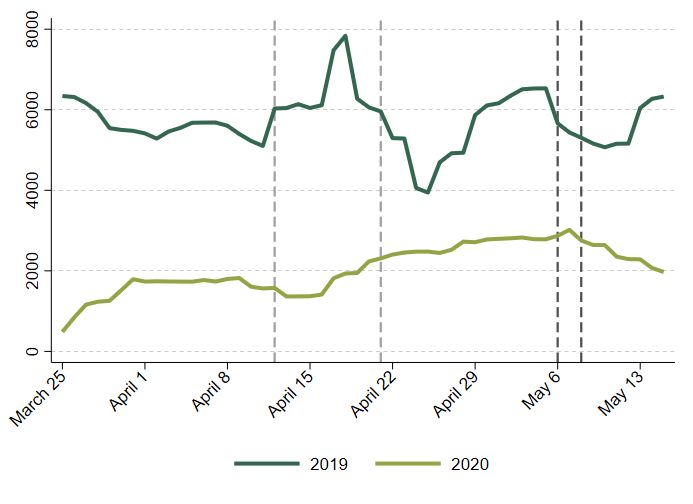
1. Introduction
Job vacancies are an early indicator of economic activity. When a firm’s demand for labour
increases, it may post new vacancies some time before these vacancies are actually filled;
conversely, when labour demand falls, a firm may stop recruitment efforts before an
effect on employment is felt. Tracking the evolution of vacancies allows us to see where
labour demand has fallen most during the pandemic, and where it is tentatively picking up
again, much faster than official employment statistics allow.

In this note we present virtually real-time information from a daily census of all job
adverts posted on Find a Job, a recruitment website maintained by the Department for
Work and Pensions (DWP). Details about the data source are given in the Appendix. The
objective is to provide a detailed and up to date picture of the current state of labour
demand across the UK economy, as it emerges from lockdown. The information presented
here will be updated and extended regularly as new data becomes available.

At this point, we only present information about job postings. This is only one side of the
labour market. Matching vacancy data with information on who is looking for work will be
essential for facilitating the (temporary) reallocation of workers from sectors that have
shut down during the pandemic to those where demand is recovering. 1 This is particularly
relevant now, as the lockdown measures sent home 7.5 million workers on furlough,
according to official figures from HM Revenue and Customs. Many other workers are likely
to have lost their jobs permanently, with 1.8 million new Universal Credit claims made
between mid-March and the end of April.2. If activity in lockdown and other affected
sectors does not return to more normal levels soon, these numbers are set to increase,
and there will be pressures to create job opportunities and reallocate these workers to
where there is demand. Our plan is to combine the vacancy data presented with
information on job destruction, business closures and worker mobility as this data
becomes available.

1 https://www.ifs.org.uk/publications/14767

2 https://www.gov.uk/government/speeches/dwps-response-to-coronavirus-covid-19

© Institute for Fiscal Studies                                                            3
Job vacancies during the Covid-19 pandemic

2. Trends in vacancy postings since
   April 2020
As has been documented elsewhere,3 job vacancy postings across the whole UK economy
started to drop around March 15 when social distancing began, and were already down by
about 15% when the lockdown was announced on March 23. By the first week of April,
new vacancy postings were down by about 70 percent overall relative to the same week in
2019.

Figure 1 shows that the fall in vacancies occurred across nearly all occupations, across the
wage distribution. The fall was sharpest in some of the low-paid occupations directly
affected by social distancing measures, for example hairdressing, sales and leisure and
travel occupations, where new vacancies had dried up almost entirely. But vacancies also
fell higher up the wage distribution, for example in legal and managerial professions
which saw falls of over 60% relative to the same week last year. Perhaps surprisingly, there
was also a decline in vacancy postings for health and social care occupations: vacancies
for nurses, medical practitioners and health associates all saw falls of 50%-70% compared
to one year ago.

Figure 1. Change in vacancy postings in first week of April, by mean occupation wage

Source: DWP FAJ website and the Annual Survey of Hours and Earnings.
Notes: First week of April defined as 1 April–7 April in 2019 and 30 March–5 April in 2020. Occupations are
grouped at the 3-digit SOC level.

3   https://www.hiringlab.org/uk/blog/2020/04/21/job-postings-through-april-16/

4                                                                                             © Institute for Fiscal Studies
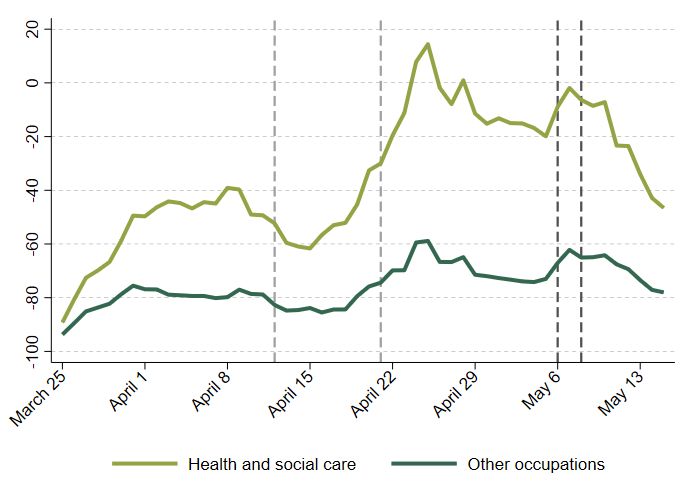
There have been some signs of a very limited recovery in recent weeks, as shown in Figure
2 , which plots daily new vacancy postings in 2019 and 2020 respectively. The gap in
vacancies relative to 2019 started to narrow over the course of April, so that by the last
week of April, new vacancy postings stood at around half their 2019 levels. The
fluctuations in mid-April, and at the start of May, can be explained by the fall in postings
that occurs each year in the days following Easter Sunday (marked by the dashed light
grey lines) and the first May Bank Holiday (marked by the dashed dark grey lines).

New vacancy postings started to fall again on the 7 th of May 2020, and have now been
falling for a week. It remains to be seen whether this is indicative of a new trend, or
whether it simply reflects fluctuations around the bank holiday – vacancy postings also fell
continuously for 6 days after the 2019 May Bank Holiday. Notably, we have not seen a rise
in vacancy postings following the Prime Minister’s update on the conditional plans to
reopen the economy on Sunday the 10th of May.

Figure 2. New daily vacancy postings, 2019 and 2020

Source: DWP FAJ website.
Notes: Trend line shows 7-day backward-looking moving average. Light grey dashed lines indicate Easter Sunday
(21 April 2019 and 12 April 2020) and dark grey dashed lines indicate the first May Bank Holiday (6 May 2019 and
8 May 2020).

Whilst the early signs of recovery are encouraging – if very modest – job advert postings
are not picking up evenly across the UK economy. In the rest of this note, we look at how
trends in vacancy postings vary across occupations, job characteristics and geographic
areas.

Occupations

The modest recovery in vacancies seen in the second half of April was almost entirely
driven by labour demand in health and social care. This is clear in Figure 3, which shows
the change in new daily vacancy postings between 2019 and 2020, split by occupations in

© Institute for Fiscal Studies                                                                                 5
Job vacancies during the Covid-19 pandemic

health and social care and other occupations.4 Health and social care accounted for 30% of
new vacancy postings on Find a Job between March and May 2019, and 12% of all
employee jobs in Q2 2019 based on the Labour Force Survey. 5 Whilst new health and social
care vacancies rebounded from less than a fifth of their 2019 levels in late March to just
under their 2019 levels around the May Bank Holiday, the recovery in other occupations
was much more modest. At the start of May, new vacancy postings in other occupations
were still more than 60% below their 2019 levels.

Figure 3. Change in new daily vacancy postings 2019-2020, by health and social care
and other occupations

Source: DWP FAJ website.
Notes: Trend line shows 7-day backward-looking moving average. Light grey dashed lines indicate Easter Sunday
(21 April 2019 and 12 April 2020) and dark grey dashed lines indicate the first May Bank Holiday (6 May 2019 and
8 May 2020). Health and social care workers defined at the 4-digit SOC code level based on the ONS classification

We can see this in more detail by looking at changes in vacancy postings across
occupations groups. The top panel of Figure 4 shows the five occupations with the largest
2020-2019 vacancy gap in the first week of April, as well as the five occupations with the
smallest 2020-2019 vacancy gap. The bottom panel does the same for the first week of
May. The first week of May is defined as the week from Monday 29 th April to Sunday 5th
May in 2019, and from Monday 27th April to Sunday 3rd May in 2020, to avoid capturing
fluctuations following the first May Bank Holiday. 6

4 This is based on the ONS classification of health and social care occupations:
https://www.ons.gov.uk/peoplepopulationandcommunity/healthandsocialcare/causesofdeath/bulletins/coronav
iruscovid19relateddeathsbyoccupationenglandandwales/deathsregistereduptoandincluding20april2020#occupat
ion-exposure-for-covid-19
5   As explained in the data appendix, DWP’s Find a Job website is likely to over-represent public sector vacancies.

6The first week of April is similarly defined to capture the first week (Monday to Sunday) that falls in April:
Monday 1st April to Sunday 7th April in 2019, and Monday 30th March to Sunday 5th April in 2020.

6                                                                                               © Institute for Fiscal Studies
Figure 4 shows that there has been some recovery in vacancies for Caring Personal Service
Occupations, Health Professionals and Health and Social Care Associate Professionals, and
to a lesser extent in Business, Media and Public Services, a group that comprises legal
professionals (barristers, judges etc.), administrative professionals (project managers,
actuaries, economists, statisticians etc.), welfare professionals (social workers etc.),
librarians and journalists.

By contrast, there appears to be very little, if any, rebound in the demand for occupations
that have been directly affected by social distancing measures, namely transport, culture
and certain parts of manufacturing. Not surprisingly some of those occupations are
among those having experienced some of the highest temporary and permanent job loss
rates in early April (Adams-Prassl, Boneva, Golin and Rauh, 2020).

Figure 4. Change in new daily vacancy postings 2019-2020, by week and occupation

Source: DWP FAJ website.
Notes: Occupations are grouped at the 2-digit SOC level. First week of April defined as Monday 1 April to Sunday
7 April in 2019 and Monday 30 March to Sunday 5 April in 2020. First week of May defined as Monday 29 April to
Sunday 5 May in 2019 and Monday 27 April to Sunday 3 May in 2020.

Unsurprisingly, demand is lower for occupations that are concentrated in industries that
have seen most closures. Figure 5 uses new data from the Business Impact of Coronavirus
Survey (BICS), collected by the Office for National Statistics (ONS), to show the proportion
of firms that temporarily closed or cancelled trading by sector during the period of April 6
to 19, 2020. The large majority of the hospitality and arts and entertainment sectors has
been closed down, and the same happened to between 20% and 26% of all firms in

© Institute for Fiscal Studies                                                                                     7
Job vacancies during the Covid-19 pandemic

construction, wholesale and retail, and manufacturing. Firms in sectors that continue to
operate regularly either because they supply key services, such as health, or because their
activities are compatible with working from home, such as the Professional and Scientific
sector, have been less affected.

Firms that have temporarily ceased trading have furloughed over 80% of their workforce,
while the figure for active firms is 26% (ONS BICS). A key question is whether the skills of
these workers are useful for the types of jobs that are slowly becoming available, and
whether they live close to these new vacancies. We will explore this in further work once
more information on workers who lost their jobs becomes available.

Figure 5. Proportion of firms that temporarily closed or paused trading, by sector

       Accommodation And Food Service Activities
               Arts, Entertainment And Recreation
                                       Construction
     Wholesale & Retail; Repair Of Motor Vehicles
                                      All Industries
                                     Manufacturing
                                          Education
     Water Supply, Sewerage, Waste Management
                        Transportation And Storage
      Administrative And Support Service Activities
         Human Health And Social Work Activities
                   Information And Communication
    Professional, Scientific And Technical Activities
                                                        0%   10% 20% 30% 40% 50% 60% 70% 80% 90%

Source: Business Impact of Coronavirus Survey, ONS

Working from home and exposure to the virus

Figure 6 shows how the recovery in recent weeks varies across occupations with different
abilities to observe social distancing measures. This is important both for the risks that
new hires will take on, and for their potential to spread the virus. We consider three
dimensions that are relevant for social distancing: the ease of working from home, the
extent to which occupations involve working in physical proximity to others, and the
extent to which workers are exposed to disease in their jobs. These are all based on the
task content of jobs in O*NET data; the first uses an index constructed by Dingle and
Neiman (2020),7 and the latter two are based on an ONS classification. 8 We group these
indices into four discrete groups based on quartiles of the distribution of vacancy postings
in 2019.

As Figure 6 shows, the recovery has been most pronounced in jobs where social
distancing is difficult: jobs that are relatively hard to do from home, that involve working
in close proximity to others, and those that are more exposed to disease. This largely

7   https://bfi.uchicago.edu/working-paper/how-many-jobs-can-be-done-at-home/
8

     https://www.ons.gov.uk/employmentandlabourmarket/peopleinwork/employmentandemployeetypes/articles/which
     occupationshavethehighestpotentialexposuretothecoronaviruscovid19/2020-05-11

8                                                                                       © Institute for Fiscal Studies
reflects the fact that the recovery has been driven by demand for workers in health and social care, which pose relatively high health risks. Figure 6. Change in new vacancy postings, by week and social distancing ability Source: DWP FAJ website, Dingle and Neiman (2020) and ONS Notes: First week of April defined as Monday 1 April to Sunday 7 April in 2019 and Monday 30 March to Sunday 5 April in 2020. First week of May defined as Monday 29 April to Sunday 5 May in 2019 and Monday 27 April to Sunday 3 May in 2020. Ease of working from home based on Dingle and Neiman (2020). Physical proximity and exposure to diseases based on ONS classification. Categories correspond to quartiles of the distribution of vacancy postings in 2019. Preparation needed Figure 7 shows how the change in new vacancy postings since 2019 varies by the amount of preparation needed to do the job. This is based on the O*NET classification of ‘job zones’, where low values indicate lower levels of required preparation. 9 In March-May 2019, 44% of vacancies required “none to some" preparation (e.g. drivers, cleaners), with the remaining vacancies split roughly equally between jobs requiring “medium” preparation (e.g. teaching assistants, various administrative occupations), “considerable” preparation (e.g. teachers, managers, engineers) and “extensive” preparation (e.g. nurses, medical practitioners, scientists). The level of preparation needed for an 9 https://www.onetonline.org/help/online/zones © Institute for Fiscal Studies 9
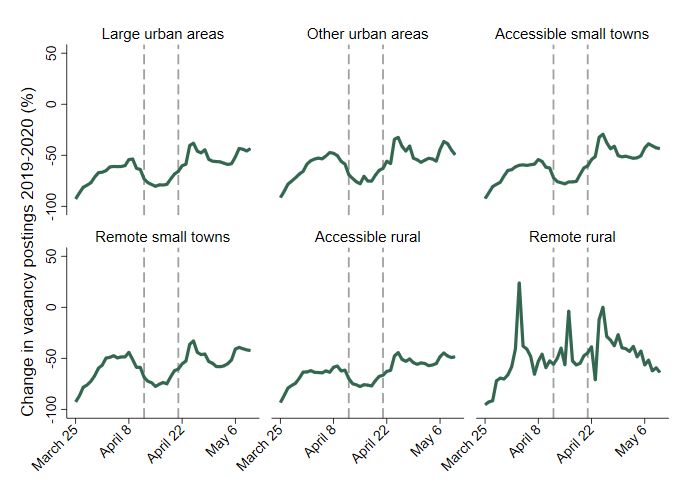
Job vacancies during the Covid-19 pandemic

occupation can be seen as a proxy for the amount of retraining needed for someone to
switch into that occupation from another role.

The first panel of Figure 7 shows that across all occupations, the fall in vacancies at the
start of the lockdown (relative to 2019) was smallest among occupations that require
extensive preparation, and the rebound was by far the largest among this group. In the
first week of May, new vacancy postings for jobs requiring extensive preparation were
back to three quarters of their 2019 levels. This largely reflects recovering demand for
healthcare workers. However, the second panel of Figure 7 shows that even excluding
health and social care occupations, labour demand has recovered more in occupations
that require higher levels of preparation, whereas new vacancies in jobs that require little
to some preparation are still nearly 80% lower than in 2019. This indicates that workers
who have been furloughed or made unemployed as result of the pandemic – concentrated
in shutdown sectors like retail and hospitality – are likely to struggle to fill vacancies in
areas where labour demand is recovering, due to the extensive training required to do
those jobs.

Figure 7. Change in new vacancy postings, by week and preparation needed

Source: DWP FAJ website and O*NET
Notes: First week of April defined as Monday 1 April to Sunday 7 April in 2019 and Monday 30 March to Sunday 5
April in 2020. First week of May defined as Monday 29 April to Sunday 5 May in 2019 and Monday 27 April to
Sunday 3 May in 2020. Health and social care workers defined at the 4-digit SOC code level based on the ONS
classification. Job zones based on O*NET classification, mapped from US to UK SOC codes and rounded to the
nearest integer. We group job zones 1 (“little or no preparation”) and 2 (“some preparation”), as only 1% of
vacancy postings in March-May 2019 had a value of 1.

Geography

Figure 8 shows trends in vacancy postings in each region of the UK. It suggests that there
are no substantial differences in the time patterns of job postings across regions. Figure 9
shows the same series, this time broken down by urban category of the location of the job

10                                                                                        © Institute for Fiscal Studies
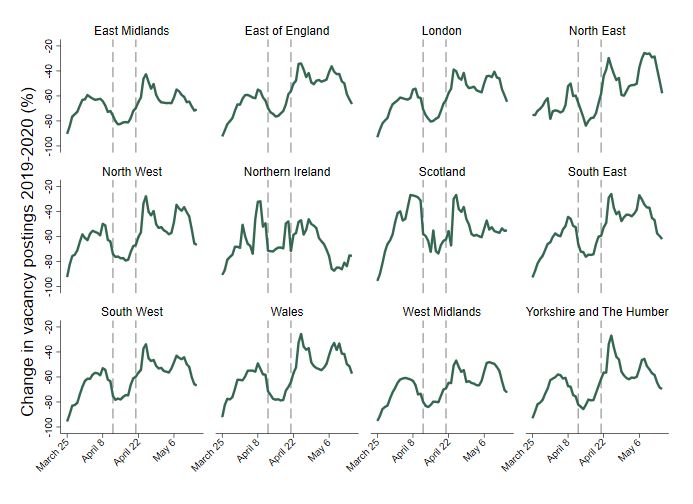
advert, and again suggests that job postings evolved on remarkably similar paths in rural,
urban, and semi-urban areas.

Figure 8. Change in vacancy postings 2019-2020, by region

Source: DWP FAJ website.
Notes: Trend line shows 7-day backward-looking moving average. Dashed lines indicate Easter Sunday (21 April
2019 and 12 April 2020).

Figure 9. Change in vacancy postings 2019-2020, by rural-urban classification

© Institute for Fiscal Studies                                                                                 11
Job vacancies during the Covid-19 pandemic

Source: DWP FAJ website.
Notes: Trend line shows 7-day backward-looking moving average. Dashed lines indicate Easter Sunday (21 April
2019 and 12 April 2020). Classification defined at the Lower Super Output Area (LSOA) level.

Small but systematic differences start to appear when looking across deprivation levels.
Figure 10 shows the vacancy gap relative to 2019 across different local authorities,
grouped by quintiles of the Index of Multiple Deprivation (IMD), in the first week of April
and the first week of May.10 It suggests that, while the initial drop in job postings was
evenly distributed across the IMD distribution (as it was for wages), the start of the
recovery seems slightly faster in more affluent areas (with a lower IMD).

This is mainly driven by the fact that the recovery in health and social care vacancies has
been concentrated in more affluent areas. In the first week of May, total new vacancy
postings in health and social care were back to 85% of their 2019 levels, but the rebound
was not evenly distributed. As shown in the first panel of Figure 11 new vacancy postings
for health and social care jobs in the least deprived fifth of local authorities were 15%
lower than in the corresponding week in 2019, whilst those in the most deprived fifth
remained 35% lower. Vacancies in other occupations have continued to fall in more
deprived areas but not in the most affluent areas, as the second panel of Figure 11 shows,
though the difference is much less pronounced.

Figure 10. Change in new vacancy postings 2019-2020, by week and IMD quintile

Source: DWP FAJ website.
Notes: IMD calculated at the local authority level.

10
   This graph is based on job postings for which we have reliable post code information – a little over two thirds
of all vacancies.

12                                                                                            © Institute for Fiscal Studies
Figure 11. Change in new vacancy postings 2019-2020, by week, IMD quintile and
occupation group

Source: DWP FAJ website.
Notes: IMD calculated at the local authority level. Health and social care workers defined at the 4-digit SOC code
level based on the ONS classification.

© Institute for Fiscal Studies                                                                                   13
Job vacancies during the Covid-19 pandemic

3. Appendix: data sources
This analysis uses data on job adverts posted on Find a Job (FAJ), a recruitment website
maintained by the Department for Work and Pensions (DWP). To advertise a job on the
website, a firm must create a profile and enter key information on each job opportunity
including job title, location and the closing date. Unlike other recruitment websites, no
attempt is made to ‘scrape’ job adverts from other websites and therefore the FAJ data
should be interpreted as a subset of all job opportunities. As of 12 May 2020, there were
60,833 vacancy postings listed on FAJ. This is 18% of the 332,057 vacancy postings listed on
Indeed.com, a recruitment website that aggregates vacancies across company websites
and job boards and aims to include all jobs listed online. FAJ is likely to overrepresent
public sector vacancies, as these are required to be listed on FAJ.

Data on job adverts posted during 2019 was made available by the DWP following a
Freedom of Information request. This data contains information on all job adverts that
were posted on the website between its launch in May 2018 and July 2019. Data on job
adverts posted during 2020 were obtained using a web scraping algorithm that records
information on all job adverts that have been posted on the website in the last 24 hours.
This algorithm has been run on a daily basis since April 23rd 2020 (at approximately 10am
each day). This daily time series is combined with data on all job adverts that were ‘live’ on
the website on April 23rd 2020, obtained using a modification of the web scraping
algorithm. This means that adverts posted in 2020 before April 23rd that were removed
from the website before that date are missing from the data. This would affect job adverts
with an advertised closing date before April 23rd 2020 or those that were manually
removed from the website by the firm, for example because the job position had been
filled. Although this risks systematically understating job vacancies in early April 2020
relative to 2019, it appears that the overwhelming majority of job adverts record a closing
date that is exactly one month after the date they were posted. This gives us confidence
that the 2020 data is representative of adverts posted on the website from March 23rd
onward.

Information of when job adverts were removed from the website is missing from both the
2019 and 2020 data. We therefore are unable to construct an accurate measure of the
stock of vacancies on the website at any given time and therefore confine our analysis to
the flow of new postings added to the website on a particular date. Each job advert
contains a unique identifier, which we use to identify and remove duplicate job postings.

We have supplemented the information available in the 2019 and 2020 data with
occupation codes and various geographic identifiers. Occupation codes are derived from a
cleaned version of the job title using the ‘SOC search’ operation available at
http://api.lmiforall.org.uk. Geographic identifiers for the subset of vacancies that contain a
complete postcode in the location field (approximately 63% of adverts in 2019 and 68% of
adverts in 2020), using the ‘postcodes’ operation available at
https://findthatpostcode.uk/#api.

14                                                                          © Institute for Fiscal Studies
You can also read