Building Heating Consumptions under Present and Future Climate Scenarios
←
→
Page content transcription
If your browser does not render page correctly, please read the page content below
Building Heating Consumptions under Present and Future
                        Climate Scenarios

                       DR. FEIFEI SUN1, DR. BEHZAD SODAGAR2, JOHN BELL1
                                1
                                    NPS Humber Ltd., Earle House, Colonial Street, Hull, UK
                                      2
                                        University of Lincoln, School of Architecture, UK

       ABSTRACT:          This paper presents the analyses of climate by examining the influence of weather patterns and
       climate change on heating demands of large building portfolios. It investigates 12 years of historic weather data and
       the corresponding heating consumptions of corporate and office buildings owned and managed by Hull City Council
       in the UK in order to establish the correlation between heating consumptions and weather patterns. Further, the
       established heating consumptions trend is compared against different climate change scenarios reported in literature.
       In addition, the most relevant climate projection scenario is identified and discussed. The methodology presented in
       this paper is valuable in demonstrating climate influenced heating consumptions for large organisations, which in
       turn can be used for monitoring and managing energy consumptions and CO2 emissions. The research is based on a
       two year collaborative externally funded research project.
       Keywords: weather, climate change, space heating, carbon emissions.

INTRODUCTION                                                         context). The research also aims to establish a
The significant challenge facing the UK is meeting the               methodology for analysing climate effects on buildings’
Government carbon reduction targets set out in its                   heating consumptions. The research therefore aims to
Carbon Plan 2011 by reducing emissions by 80% by                     illustrate how monitoring and forecasting the heating
2050 relative to 1990 baseline [1]. As parts of carbon               consumptions and demands at estate level may be used
reduction commitment programme both public and                       by large organisations to manage and more importantly
private organisations with large building portfolios are             plan forward their CO2 emissions more accurately.
required to report their CO2 emissions. They are the first
obligatory group to make notable reduction in CO2
emissions to deliver the nation’s 2050 vision. Large                 METHODOLOGY
organisations may share common features such as                      The research was carried out in Hull (53°45′N 0°20′W),
holding a broad building portfolio at various locations              East Pennines, in the UK using the building portfolio of
with a constant changing estate. It is these variables,              Hull City Council. The council owns and operates 304
which increase the complexity of managing CO2                        buildings with various building types. The methodology
emissions together with formulating strategies for                   followed in this research is:
emissions management and reductions.
                                                                         1) Identifying the energy consumption for heating of
    Almost half (46%) of the energy consumed in the                          the analysed building portfolio.
UK is to provide heat, in which around three quarters is                 2) Identifying the heating season weather data.
used by households and in commercial and public                          3) Baseline two sets of data from 2000, generating
buildings [2]. For the commercial and public sector,                         their ratio trends from 2000-2012 respectively.
space heating is the dominant issue for a climate like                   4) Comparing the heating consumptions ratio trend
UK, which is responsible for 45% of its energy                               with weather data ratio trend.
consumption in 2011 according to the latest national                     5) Comparing the heating consumptions ratio trends
statistic [3].                                                               with the climate change scenarios.

AIMS & OBJECTIVES                                                    BUILDING PORTFOLIO
The scope of this research is to analyse the extent of the           The building portfolio of Hull City Council (HCC) sits
heat energy consumption during heating season, which                 in the service sector, mainly schools (33%), corporate
includes space heating and hot water (together                       buildings (22%), offices (16%) and others (29%) such as
referenced as heating requirement in the following                   car parking, depots, parks etc. The main source of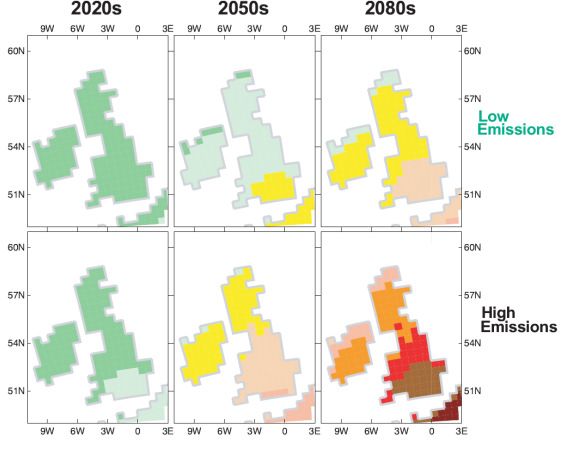
PLEA2013 - 29th Conference, Sustainable Architecture for a Renewable Future, Munich, Germany 10-12 September 2013
energy is gas accounting for 58% of the total energy stations to identify one to represent closely the actual
consumption, while electricity and oil accounts for 40% climatic condition of Hull.
and 2% of the total consumption respectively. The data
used in this research are extracted from several
databases, archived from 1999 onwards offering detailed
information on issues such building name, building type,
internal layout, building characteristics, location, age,
refurbishment and retrofit programmes, building
services, renewable sources of energy, energy bills and
other relevant information. A comprehensive and
detailed database was created to record the above
information for the buildings analysed in the research.
The entire building portfolio was analysed to
investigate the influence of weather on building heating
consumptions during the heating season as defined in
the following section. For the research reported in this
paper, buildings which may have specific occupancy
patterns in the heating season are however excluded.
Examples include school buildings which have 6 week
holidays (Christmas, Easter and half term) during the
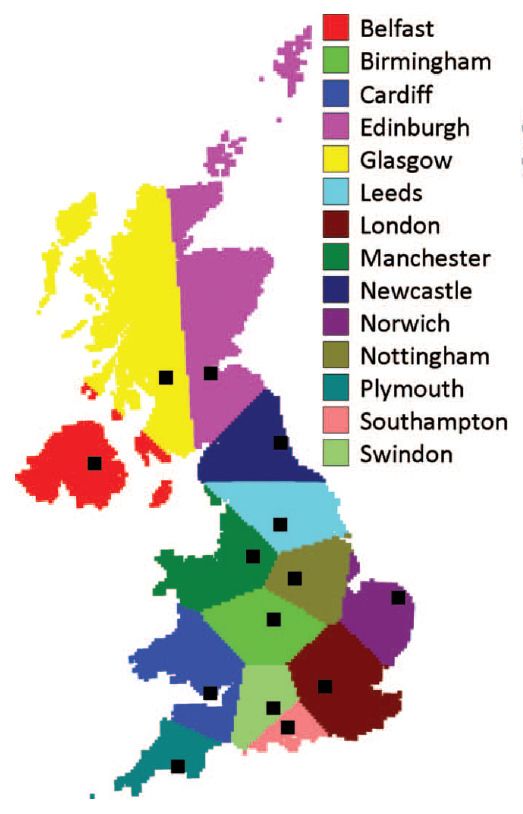
Figure 1: Map of the Areas of Influence of the 14 Weather
heating season, where the corresponding heating Stations with the Weather Stations Marked as a Square [6]
consumptions may not reflect the weather influence
holistically. The results reported in this paper are based Climatic data from 7 local weather stations were
on the analyses carried out on corporate and office analysed. These include; Bridlington, Leconfield, Hull,
buildings only. Norman by Hall, Humberside Airport, Cleethorpes and
Donna Nook as shown in Figure 2. Several criteria
applied in the analysis for the selection of the most
CLIMATE appropriate weather station for Hull. These include
The climate of Hull is categorized as a temperate completeness of data, reliability, frequency and
maritime climate which is dominated by the passage of accuracy. One specific criterion applied was that the
mid-latitude depressions [4]. The city’s annual average weather station should have established no later than
temperature is 10°C, with a long and humid winter. The 1995 and that there should be no planning for closure of
heating season for Hull is calculated as October to May, the station in future. As no single weather station
and this is based on the methodology of Heating Degree deemed to be a true representative of the climate in Hull
Days (HDD) published by the Chartered Institution of for the so called heating season, further analysis
Building Services Engineers (CIBSE) [5]. Because of suggested that a more accurate scenario may be
the significance of the winter influence (8 month), Hull constructed by taking the average of climatic data for 3
City Council has a special policy that there should be no weather stations namely Leconfield, Notman by Hall
air conditioning in public buildings except buildings and Cleethorpes.
with special use e.g. museums and art galleries.
For building energy simulations, in the UK, test
reference years (TRYs) for different locations published
by CIBSE are widely used (figure 1). There are 14
locations available for the country, which are based
upon historic observations of weather typically from
1983-2004 [6]. The location limitation may cause
substantial differences if the studied location has a
different weather compared to the regional
representative. For City of Hull, figure 1 shows that
Leeds is the recommended representative for East
Pennines. Although Leeds and Hull share similar
latitude of 54°N, Hull is a port city directly exposed to
the North Sea while Leeds is an inland city with an
altitude of 63m above sea level. To overcome this Figure 2: Approached Weather Stations around Hull [7]
discrepancy, the research analysed several local weather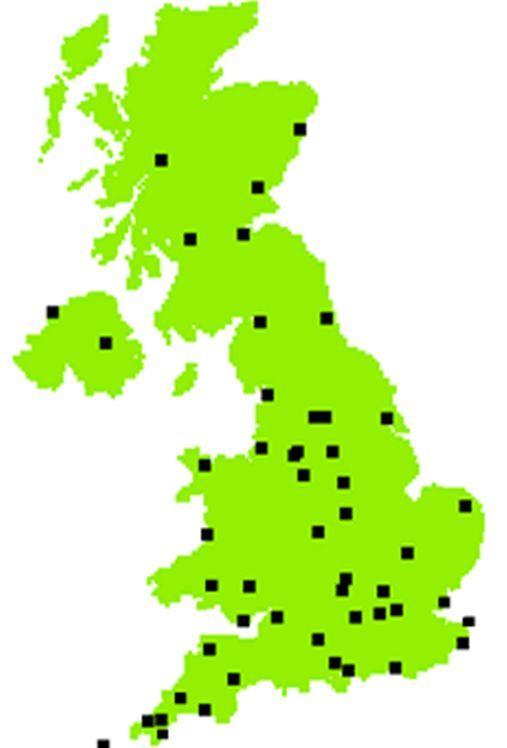
PLEA2013 - 29th Conference, Sustainable Architecture for a Renewable Future, Munich, Germany 10-12 September 2013

Heating Consumptions under Historic and Present                            One interesting point worth mentioning is that the
Weather Conditions                                                     UK Government introduced the notion of Display
Figure 3 shows the 12-year ratio trends for the heating                Energy Certificate (DEC) for all public buildings over
consumptions of Hull City Council’s corporate and                      1,000m2 floor area in 2004, which was enforced from 1st
office buildings together with the annual average                      October 2008. It can be observed that although the year
temperature in the heating seasons. For ease of                        2008 experienced a much colder winter than 2007, the
comparison, the average temperature line has been                      space heating consumptions of these two years’ are
mirrored meaning that              a rise in the average               nearly the same. Because there are no records showing
temperature line is actually a temperature drop resulting              significant changing estate of the council, this could be
in a potential increase in heating consumptions.                       the impact of introducing new energy legislation, as it
                                                                       contributes to raising people’s energy awareness. The
Ratio                                                                  research showed a similar pattern in other buildings of
 1.4                                                                   the Councils, e.g. in Schools where energy awareness
 1.2                                                                   and good housekeeping resulted in tangible energy
   1                                                                   savings.
 0.8
 0.6
                                                                       Heating under Future Climate Change Scenarios
 0.4
                                                                       The Intergovernmental Panel on Climate Change (IPCC)
 0.2
                                                                       issued its first Special Report on Emission Scenarios in
   0                                                                   2000. Its latest report, Fourth Assessment Report
                                                                       Climate Change issued in 2007, concludes that ‘for the
                                                                       next two decades, a warming of about 0.2°C per decade
                                                                       is projected’ [8]. At the regional level, the UK
                   Energy Consumption                                  government established UK Climate Impacts
              Average Temperature (mirrored)                           Programme (UKCIP) in 1997, which coordinates and
                                                                       influences research into adapting to climate change. Its
Figure 3: Ratio Trends of Heating Consumptions and Average             first publication UKCIP02 scenarios (figure 4),
Temperature during Heating Season for Hull City Council’s
                                                                       projected four different scenarios for climate change
Corporate & Office Buildings 2000-2012
                                                                       over the 21st century based on four different scenarios
   The horizontal axis is the 12 year timescale from                   for greenhouse gas emissions: low, medium-low,
                                                                       medium-high and high emissions, over three time scales:
2000 to 2012 with the base year established at the year
                                                                       2020s (2011-2040), 2050s (2041-2070) and 2080s
of 2000 (hence ratio considered as 1). The vertical axis
                                                                       (2071-2100) [9].
shows the ratios of heating consumptions and the
average heating season temperature compared to the
base year data of 2000.

    There are two main conclusions which may be
drawn from the analysis results of which are shown in
figure 3. Firstly, the temperature trend in the heating
season has a direct influence on the whole estate’s
corresponding heating consumptions. Secondly, the
fluctuations in the consumption pattern seem to be more
moderate compared with changes in the annual average
temperature pattern. During the 12 year trial experiment,
there are 3 years in which there are not direct correlation
between the energy consumption and average
temperature. In other words, there are cases for which
there is an increase in heating demand when the heating                Figure 4 UKCIP02 Scenarios - Changes in Average Annual
season seems to be milder. It should be noted that there               Temperature for the 2020s, 2050s and 2080s for the Low
are usually other parameters which may influence the                   Emissions and High Emissions Scenarios [9].
trends in heating demands of large building portfolios.
These include programmes of relocation, buying and                        The UKCIP02 scenarios provide mean monthly
selling properties, refurbishment, conversion and                      values of climate variables on a 50m x 50m grid. The
retrofitting which are usually exercised by large                      four green house gas emissions scenarios used are
organisations such as city councils.                                   ranging from a low-energy use sustainable future, to an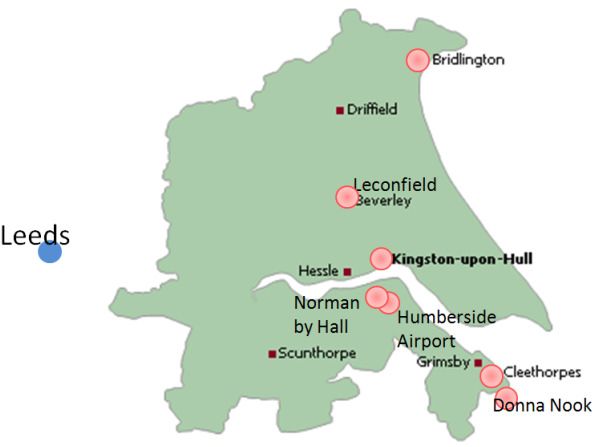
PLEA2013 - 29th Conference, Sustainable Architecture for a Renewable Future, Munich, Germany 10-12 September 2013

intensive fossil fuel use future, and produce a complete                   The Prometheus project has produced 5 different
set of climate data for each scenario [10].                            scenarios for 10%, 33%, 50%, 66% and 90% increased
                                                                       emissions. Figure 7 illustrates the different climate
   The UK Climate Impacts Programme in its latest                      change scenarios for Hull extracted from the Prometheus
publication i.e. KCIP09 scenarios (figure 5), has                      project for two selected scenarios being 10% and 33%
projected the changes in temperature and precipitation                 increased emissions. The main observation is that the
across the UK for the medium emissions scenario for the                projected heating season temperatures for Hull will
2080s with 10, 50 & 90% probability levels. Details of                 increase steadily compared with the base year of 1990
the scenarios are available from the UKCIP website                     under both emission scenarios. Generally, the higher
[10].                                                                  emission level is, the less heating demand is predicted
                                                                       due to increased external air temperature as a result of
                                                                       global warming.

                                                                        Ratio
                                                                        1.2
                                                                        1.1
                                                                          1
                                                                        0.9
                                                                        0.8
                                                                        0.7
                                                                        0.6
                                                                                   1990           2000          2010           2020

                                                                                 Hull Average Heating            Season    Temperature
Figure 5 UKCIP09 Scenarios - Changes in Winter Mean                    Prediction under 33% Emissions
Temperature for the 2080s under a Medium Emissions                              Hull Corresponding Heating       Prediction under 33%
Scenario [10].                                                         Emissions
                                                                                  Hull Average Heating           Season    Temperature
    From figures 4 and 5 it can be seen that the projected             Prediction under 10% Emissions
future scenarios are rather too general to be used for the                      Hull Corresponding Heating       Prediction under 10%
identification of accurate future localised climate                    Emissions
changes. The research carried out at Exeter University
                                                                       Figure 7: Hull Average Heating Season Temperature and
through the Prometheus project aimed at downscaling                    Corresponding Heating Consumption Predictions under
climate model information to create new weather                        different emissions scenarios, 1990-2020 (Figure Generated
reference data for the period 2010 to 2080 using hourly                from Publications from Prometheus project [11])
climatic data [11]. Prometheus project has published a
series of future weather files for 45 locations in the UK              Table 1: Hull Monthly Average Temperature Projection
under different emission scenarios (figure 6). Hull is                 (Meteonorm Version 7.0)
among the locations for which future climatic data is
produced.                                                                 Month             1990             2005              2020
                                                                           Jan               0.2              4.7               1.2
                                                                           Feb               3.6              5.4               4.6
                                                                           Mar               6.6              7.1               7.6
                                                                           Apr               7.7              8.9               8.7
                                                                           May              10.6             11.7              11.7
                                                                           Jun              13.1             14.9              14.3
                                                                           Jul              16.2             16.5              17.4
                                                                           Aug              15.9             17.1              17.1
                                                                           Sep              13.8             14.7              14.9
                                                                           Oct              10.2             11.1              11.2
                                                                           Nov               6.3              7.3               7.3
                                                                           Dec               3.2              4.9               4.2

                                                                           For analysing the possible future energy demands of
Figure 6 Locations of Future Weather Files Available from
                                                                       building portfolio of Hull City Council, we also used
Prometheus Project [11].                                               Meteonorm – a software designed for predicting future
                                                                       climate scenarios [12]. Table 1 depicts the monthly
PLEA2013 - 29th Conference, Sustainable Architecture for a Renewable Future, Munich, Germany 10-12
10 September 2013
average temperatures predicted by Meteonorm for Hull DISCUSSIONS
for 1990, 2005, and 2020. It can be seen that monthly Figure 10 shows the comparison of the actual heating
temperatures in 2005 are higher than the corresponding consumptions of Hull City Council’s corporate and
values for 1990. In contract, Hull may have a colder office buildings (2000 to 2012) with Meteonorm’s
winter in 2020 compared with 2005. heating predictions.
redictions. The Meteonorm’s prediction is
projected into future up to 2020. It can be seen that
Ratio although the actual energy consumptions fluctuate
1.2 through the 12 years trial period, for most of years they
1.1 closely follow the prediction line by Meteonorm with
wi a
1 deviation of the order of ± 1% (the yellow band). There
0.9 are two extreme values among the 12 years data falling
0.8 outside the yellow band representing heating
0.7 consumptions for 2002/03
/03 and 2005/06.
0.6
1990 2005 2020 Ratio
1.4
Hull Average Heating Season Temperature Prediction
Hull Corresponding Heating requirement Prediction 1.2
1
Figure 8: Hull Average Heating Season Temperature and 0.8
Corresponding Heating demand Predictions 1990-2020
1990
(Figure generated from Meteonorm Version 7.0) 0.6
0.4
Figure 8 depicts the predictions for average heating 0.2
season temperatures in Hull together with predicted 0
heating demands of buildings as projected by
Meteonorm.
Ratio
Energy Consumption Meteonorm Prediction
1.2
1.1 Figure 10: Energy consumption
consumptio for Space Heating & Hot
1 Water during heating season of Hull City Council’s Corporate
0.9 Buildings and Meteonorm Space Heating Prediction for Hull
Buildings under Climate Change Scenario, 2000-2020
2000
0.8
0.7 From the analysis carried out, it appears that
0.6 Meteonorm’s projections may more closely represent
1990 2000 2005 2010 2020 the actual heating consumptions
consumption of Hull City Council
buildings compared with predictions by Prometheus.
Prometheus Space Heating Prediction under 33%
Emissions
Prometheus Space Heating Prediction under 10% As it is usually difficult and time consuming for
Emissions large organisations
anisations to monitor or model the energy
Meteonorm Space Heating Prediction 1990-2020
19 consumption of their entire building stock in future,
future the
methodology proposed in this paper can prove to be a
Figure 9: Prometheus and Meteonorm Projections for Hull useful tool to help such organisations to accurately
Space Heating under Different Climate Change Scenarios, predict the heating demands of their building portfolio
port
1990-2020 with a view to formulate strategies for energy
conservation and reduced CO2 emissions.
Figure 9 shows the different climate change scenario
projections from Prometheus and Meteonorm in terms
of heating demands for Hull buildings. While CONCLUSIONS
Prometheus project predicts a continuous rise in Hull This research attempts to establish a correlation between
average heating season temperatures in future resulting weather and future climatic changes with heating
in reductions in annual heating requirements, consumptions of large building portfolios owned and
Meteonorm on the other hand predicts that the managed by large organisations. The large building
temperatures in winter of 2020 may for example be portfolio of Hull City Council in the UK containing
conta
lower than those in 2005 resulting in increased heating corporate and office buildings was used to establish such
consumptions if compared with 2005.PLEA2013 - 29th Conference, Sustainable Architecture for a Renewable Future, Munich, Germany 10-12 September 2013
a correlation. Conclusions drawn from the research hment_data/file/48574/4805-future-heating-strategic-
include; framework.pdf [5th May 2013].
3. DECC, (2012). Energy consumption in the UK. Chapter 1:
1) Heating season temperature fluctuations have overall factsheet, [Online], Available:
https://www.gov.uk/government/publications/energy-
direct impacts on the heating consumptions of consumption-in-the-uk/ [23 April 2013].
the entire building estate, where cold winter 4. Dennis Wheeler & Julian Mayes, (2nd edition, 2005).
leads to more heating and warmer winter for Regional Climates of the British Isles. Taylor & Francis.
less. 5. Chartered Institution of Building Services Engineers
2) For Hull City Council portfolio, the range in (CIBSE), (2006). Degree-Days: Theory and Application
the fluctuations of the heating demands is TM41:2006.
narrower compared with the range in the 6. M. Eames, T. Kershaw and D. Coley, (2012). The
relative corresponding external air temperatures appropriate spatial resolution of future weather files for
during the heating season. building simulation. Journal of Building Performance
3) In order to establish a close correlation between Simulation Vol.5, No. 6, November 2012, 347-358, Taylor &
climate and energy performance, it may be Francis
necessary to analyse different methodologies 7. After East Riding Map,
Available:http://www.uksuperweb.co.uk/images/map_eastridin
and tools to establish a procedure to accurately g.gif [10th May 2013].
represent the local conditions and the 8. Intergovernmental Panel on Climate Change, (2007) IPCC
characteristics of the building portfolio. Fourth Assessment Report: Climate Change 2007.
4) It is always advisable to use localised weather 9. Hulme, M., Jenkins, G.J., Lu,X., Turnpenny, J.R., Mitchell,
stations’ data to accurately represent the T.D., Jones, R.G., Lowe, J., Murphy, J.M., Hassell, D.,
boundary conditions within which the buildings Boorman, P., McDonald, R. and Hill, S. Tyndall Centre for
exchange energy with their immediate Climate Change Research, School of Environmental Sciences,
surroundings. University of East Anglia, (2002). Climate Change Scenarios
5) Modelling perditions should be compared for the United Kingdom: The UKCIP02 Scientific Report.
10. UK Climate Impacts Programme (UKCIP), (2002)
against historic and actual data for fine tuning UKCIP02 Scenarios. Available: http://www.ukcip.org.uk [10th
of the methodologies and procedures to be May 2013].
developed for predicting future trends in 11. Prometheus project, 2011, Centre for Energy and the
weather and corresponding energy Environment, University of Exeter. Available:
consumptions. http://emps.exeter.ac.uk/research/energy-
environment/cee/projects/prometheus/downloads/ [30th April
2013].
12. Meteonorm, (2012). Meteonorm Software V7. Available:
ACKNOWLEDGEMENTS http://meteonorm.com/ [10th May 2013].
This research has been conducted through a 2 year Knowledge
Transfer Partnership (KTP) research programme. Knowledge
Transfer Partnership progarmme is a UK-Government
initiative to bring research institutions and the industry
together to enhance innovation and efficiency of the industry.
The research was delivered through funding from NPS
Humber Ltd with support from Technology Strategy Board
(TSB). The authors would like to appreciate Hull City
Council and MET Office for providing the necessary
data for performing the analyses. Authors’ appreciations
are also extended to Phil Vozza and Steve George of
NPS Humber Ltd. for their invaluable support
throughout the research.
REFERENCES
1. Department of Climate Change (DECC), (2011). Carbon
Plan Executive Summary. [Online], Available:
https://www.gov.uk/government/uploads/system/uploads/attac
hment_data/file/47614/3751-carbon-plan-executive-summary-
dec-2011.pdf [5th May 2013].
2. Department of Climate Change DECC, (2012). The Future
of Heating: A Strategic Framework for Low Carbon Heat in
the UK. [Online], Available:
https://www.gov.uk/government/uploads/system/uploads/attacYou can also read