An aggregated fridge-freezer peak shaving and valley filling control strategy for enhanced grid operations
←
→
Page content transcription
If your browser does not render page correctly, please read the page content below
An aggregated fridge-freezer peak shaving and valley filling
       control strategy for enhanced grid operations
 Macarena Martin Almenta, Student Member IEEE
          John Morrow, Member IEEE
           Robert Best, Member IEEE                                                           Aoife Foley, Member IEEE
                  Brendan Fox                                                       School of Mechanical & Aerospace Engineering,
School of Electronics, Electrical Engineering & Computer                                    Queen’s University Belfast, UK
        Science, Queen’s University Belfast, UK                                                  a.foley@qub.ac.uk
             mmartinalmenta01@qub.ac.uk

 Abstract - The need for fast response demand side participation          operators, electricity retailers or generators to shed load and
 (DSP) has never been greater due to increased wind power                 switch to on-site diesel generators or reduce heating, chiller or
 penetration. White domestic goods suppliers are currently                air-conditioning loads when required [6]. Residential sector
 developing a ‘smart’ chip for a range of domestic appliances             load participation in liberalized markets has not been fully
 (e.g. refrigeration units, tumble dryers and storage heaters) to         developed because smart domestic appliances and smart
 support the home as a DSP unit in future power systems. This             meters have not been widely deployed. It could be argued that
 paper presents an aggregated population-based model of a single          this is due to the lack of a retail market structure in the
 compressor fridge-freezer. Two scenarios (i.e. energy efficiency         residential sector. It is expected that within the context of a
 class and size) for valley filling and peak shaving are examined         smart grid, consumers will actively participate in the
 to quantify and value DSP savings in 2020. The analysis shows            electricity market due to the increased availability of pricing
 potential peak reductions of 40 MW to 55 MW are achievable in            and usage data via smart meter interfaces.
 the Single wholesale Electricity Market of Ireland (i.e. the test
                                                                              A number of studies have examined the opportunity for
 system), and valley demand increases of up to 30 MW. The
                                                                          residential sector schedulable-interruptible load participation.
 study also shows the importance of the control strategy start
                                                                          For example, [7] showed the power system benefits from
 time and the staggering of the devices to obtain the desired
                                                                          implementing direct load control demand response in electric
 filling or shaving effect.
                                                                          hot water heating. Cold appliances (e.g. fridge-freezers, chest-
 Index Terms -- demand side participation, domestic load, fridge-
                                                                          freezers and refrigerators) are also a potential schedulable-
 freezer, smart grids.                                                    interruptible load candidate due to their thermal storage
                                                                          capabilities. Most researchers have to date considered
                                                                          refrigerator loads [8]-[10], analyzing the potential load-
                          I.    INTRODUCTION                              shifting effect and time of use tariffs to reduce power peaks.
     Today’s grids are facing many challenges [1] associated              [11] focused on domestic freezers. [12] provided an
 with increased wind power penetration (e.g. system balance,              examination of frequency response for power systems using
 ramping and curtailment). The participation of domestic loads            refrigerators. The different operating factors for fridge-
 from individual households can possibly reduce stress on the             freezers (e.g. the effect of ambient temperature, door opening
 power system and offer additional ancillary services to grid             and thermostat position [13], the use of different types of
 operators [2], [3] to integrate wind power. However,                     refrigerants [14] or the effect of different types of components
 schedulable-interruptible loads [4] should not significantly             of the refrigeration system [15] have also been investigated.
 affect the consumer experience and performance of a domestic             The potential of domestic appliances as responsive loads have
 appliance. The objective of load participation in the smart grid         been analyzed in a statistical manner [5], [16].
 is to use these schedulable-interruptible loads to reduce peak
                                                                              In this paper an aggregated population-based model of a
 demand, mitigate system disturbances, delay or avoid
                                                                          compressor fridge-freezer is developed. Valley filling and
 additional capital investment in new power plants and prevent
                                                                          peak shaving are examined under two scenarios (i.e. the
 excessive use of more expensive or less efficient power plants.
                                                                          fridge-freezer energy rating and size) to quantify the DSP
 Some domestic appliances are considered schedulable-
                                                                          ‘energy’ savings. The hypothesis in this research is that load
 interruptible loads making them prime candidates to
                                                                          participation using smart metering can provide significant
 implement load participation [5]. Load participation is
                                                                          operational, economic and environmental benefits to a power
 traditionally known as demand side management (DSM). In
                                                                          system. The control algorithm is developed in MATLAB and
 many power systems the commercial and industrial sectors
                                                                          an aggregated fridge-freezer load is modelled using datasets
 also have special load participation contracts with grid

    This work was supported by a Charles Parsons Energy Research Award,
which is funded by Science Foundation Ireland (SFI), Award 06/CP/E002.

  978-1-4673-8040-9/15/$31.00 ©2015 IEEE
from the Single wholesale Electricity Market (SEM) of
Northern Ireland and the Republic of Ireland (i.e. the test
system).
II. METHODOLOGY
In this study a fridge-freezer with only one compressor is
modelled because it is the most widely sold domestic
appliance [17]. In a fridge-freezer, the circulation of the
refrigerant is driven by a compressor, which requires a motor
and thus electrical energy.
A. Description of the model of a single fridge-freezer
The model of a single fridge-freezer developed in [18]
predicts the temperature in each compartment of the fridge-
freezer based on heat transfer equations [19]. The model
inputs are the dimensions of the fridge and freezer
compartments, the compressor power consumption,
coefficient of performance (COP) tested in extreme working
conditions, thermal masses and thermal time constants of the
fridge and freezer. The heat transmitted to the thermal mass
of the device is equal to the convection heat losses as a result
of the temperature difference between the room and the
compartments, minus heat transfer from the refrigerant to the
compartment. The Simulink model developed is shown in
Fig. 1.
B. Description of the aggregate model
The study uses a model to simulate each device and Figure 1. Simulink model of the single compressor fridge-freezer.
aggregate their individual behavior to predict the demand of
the aggregate load. Simulations assuming 1,000 fridge-
freezers have been carried out, considering different
characteristics in each unit depending on the scenario under
study. The time span for cooling is not a fixed parameter [8]-
[10], but depends on the characteristic of the device and the
thermal mass inside each cabin.
Randomness following a standard uniform distribution
has been added to the model to create a more realistic
situation. These are temperature limits of ±0.5°C and overall
heat transfer coefficient of ±0.01W/°C. The thermal mass
varies randomly between 17% and 31% of the capacity of
water of each compartment. The expected percentage of
fridge-freezers in each energy label class is projected to
change in the UK over the coming years [20], as shown in
Fig. 2. Figure 2. Expected percentage of fridge-freezers in the UK [20].
The technical specifications of a fridge-freezer are TABLE I. Technical specifications of medium size fridge-freezer with
summarized in Table I, together with the overall heat transfer different energy efficiency ratings [21].
coefficient (Req). The latter is obtained by running the model
for one unit with the data provided by the manufacturer, Energy label class A+++ A++ A+
allowing for a 5% error in the energy consumption. Model (KG36N/) SB40 AI32 AW22
Energy consumption (kWh/annum) 159 238 281
The expected percentage of small, medium and large size Storage volume fridge (l) 219 219 223
A++ fridge-freezers is estimated from [22] to be 33%, 44% Storage volume freezer (l) 66 66 66
and 23% respectively in 2020. The technical specifications of Temperature rise time (h) 17 14 14
Coefficient of performance (COP) 1.25 1.02 1.02
the fridge-freezers are summarized in Table II, together with
Compressor power (W) 60 70 85
the overall heat transfer coefficients (Req). Req fridge (W/°C ) 1 1.3 1.8
Req freezer (W/°C ) 0.67 0.86 0.86TABLE II: Technical specifications of A++ fridge-freezer of different A. Scenario 1: Energy efficiency class in the year 2020
sizes [23].
In this scenario, fridge-freezers are assumed to be of
Size Small Medium Large medium size but with the 2020 range of energy efficiency
Model (K/) UL15A60GB GV33VL31G GE49BBI30G class shown in Fig. 2.
Energy class A++ A++ A++
Energy consumption Two different modes of control have been studied:
140 219 255
(kWh/annum) 1. Non-staggered. All the devices are given the same
Storage vol. fridge (l) 108 192 301
Storage vol. freezer (l) 15 94 111
valley and peak period starting times in which to
Temp. rise time (h) 10 23 44 operate the control strategy. All the devices are in
COP 1.02 1.3 1.05 different stages of the cooling cycle when the valley
Comp. power (W) 75 80 90 and peak periods are initiated.
Req fridge (W/°C ) 1 1.3 1.4
Req freezer (W/°C ) 0.28 0.87 0.62 2. Staggered. The starting time of the valley and peak
periods for individual devices within the aggregate
are distributed over a period of 60 minutes. Every
C. Valley filling and peak shaving control strategy minute the control strategy of a proportional number
A valley filling and peak shaving control strategy is of devices is modified, i.e. for the simulation of 1000
proposed in this study. This control algorithm is designed to units, 17 units are activated every minute.
simulate a standard fridge-freezer thermostat, which
Fig. 4 shows the effect of the staggered and non-staggered
maintains the freezer temperature between -19°C and -23°C
control modes on the system demand. A valley period of two
and the fridge temperature around 5°C. At chosen periods the
hours and a peak period of 1.5 hour have been chosen, as this
thermostat upper and lower temperature limits are varied
produces the desired effect of modifying system demand
according to the demand profile. Subsequently load
while not giving rise to significant disturbances caused by the
participation increases consumption during valley periods and
devices returning to the standard limits.
reduces consumption during peak periods while maintaining
food safety. During the valley period the thermostat
temperature limits are modified to maintain a freezer
temperature between -23°C and -25°C, while to prevent
freezing the fridge temperature is maintained above 3°C.
During the peak period the limits are modified to maintain the
freezer temperature between -18.5°C and -18°C and fridge
temperature under 7°C.
III. RESULTS AND ANALYSIS
The model is run for a total of 48 hours. During the first
24 hours it is run without the control strategy, but including
the randomization effects of individual appliances within the Figure 4. Proposed modified system demand in Ireland during the valley
aggregate load. During the subsequent 24 hours the valley period.
filling and peak shaving control strategy is engaged. A typical
winter day has been chosen to evaluate the effect of each As shown in Table III, for the non-staggered control mode
control strategy on the system demand. Fig. 3 shows the the system demand in the valley period is increased by 3 MW
system demand on the 10th December 2013 [27]. In 2020 the and is shifted to 04:00. For the staggered control mode the
system demand on a winter working day is assumed to be minimum system demand in the valley period is increased by
10% greater than the equivalent day in 2013. According to 26 MW and is shifted to 03:15. For both cases the amount of
the TSO grid capacity statement demand is forecast to grow stored energy is similar, at 60 and 64 MWh for the non-
2% each year [24]. staggered and staggered modes respectively.
TABLE III. Modified demand for the proposed scenarios and control
modes.
Period Scenario Time of Modified demand
valley/peak (MW)
Valley 1: Non- staggered 04:00 + 3
1: Staggered 03.15 + 26
2: Non-staggered 04:00 + 7
2: Staggered 03:15 + 30
Peak 1: Non-staggered 17:45 - 50
1: Staggered 17:45 - 55
2: Non-staggered 17:45 - 47
2: Staggered 17:45 - 42
Figure 3. System demand in Ireland on a winter working day.Fig. 5 shows the modified system demand during the peak
period. The non-staggered control mode creates a second
peak when the devices revert to the standard thermostat
setting. As shown in Table III, for the non-staggered control
mode the maximum system demand in the peak period is
decreased by 50 MW. The staggered mode results in a peak
reduction of 55 MW.
Figure 7. Proposed modified system demand in Ireland during the valley
period considering the size of the appliance.
As shown in Table III, for the non-staggered control mode
the system demand in the valley period is increased by 7 MW
and is shifted to 03:45. For the staggered control mode the
minimum system demand in the valley period is increased by
30 MW and is shifted to 03:00. For both cases the amount of
Figure 5. Proposed modified system demand in Ireland during the peak stored energy is similar, at 74 MWh for the non-staggered
period and staggered modes. Fig. 8 shows the proposed modified
system demand in Ireland during the peak period. The non-
The peak shaving and valley filling control strategies staggered control mode creates a second peak when the
presented can also be combined in other ways to maximize devices revert to the standard thermostat setting. This is an
their DSP potential. For example in winter the modified undesirable disturbance to the grid. This disturbance is much
valley filling control strategy, maintaining temperature limits observed when using staggered control.
in the freezer between -21°C and -25°C (i.e. overcooling),
may be enabled throughout the day with the exception of the
peak period.
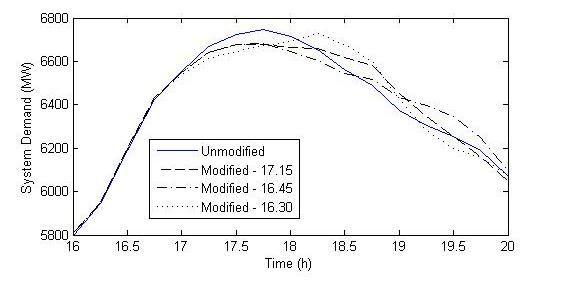
Fig. 6 shows the proposed modified system demand
during the peak period with overcooling. The time when to
send the signal is crucial to obtain the required effect of peak
shaving. The peak period is chosen to be 60 minutes. If the
starting time of the peak period is changed from 17:15 to
16:45 and 16:30 the peak reduction is 27 MW, 67 MW and
29 MW respectively.
Figure 8. Proposed modified system demand in Ireland during the peak
period considering the size of the appliance.
As shown in Table III, for the non-staggered control mode
the maximum system demand in the peak period is decreased
by 47 MW. The staggered mode results in a peak reduction of
43 MW.
IV. DISCUSSION
The potential to shave peak demand and increase
minimum load using the energy storage of a fridge-freezer
Figure 6. Proposed modified system demand in Ireland during the peak
period with overcooling.
has been quantified for a power system (i.e. the SEM in
Ireland). Peak reductions of 40 MW to 55 MW are
achievable, with valley demand increases of up to 30 MW.
B. Scenario 2: Size of the appliance in the year 2020 Pre-cooling can further reduce the peak, but at the expense of
In this scenario, fridge-freezers are assumed to be A++, energy consumption. Both of the control options tested shift
i.e. moderately efficient, and have the size range estimated the time of peak demand, however a non-staggered approach
from [22]. to refrigeration control tends to introduce an undesirable
second peak. The ability to change maximum and minimum
Two different modes of control have been studied, as in
demand relates to the time constant of the fridge-freezer and
Scenario 1. Fig. 7 shows the effect of the staggered and non-
the timescale of the peak or valley to be compensated. This
staggered control modes on the system demand.
means that the non-staggered control algorithm would have
greatest benefit for the short term changes in demand, such asfollowing grid disturbances or TV pickup, etc. Two fridge- [12] J. A. Short, D. G. Infield and L. L. Freris, "Stabilization of grid
freezer stock scenarios (i.e. energy class and unit size) were frequency through dynamic demand control," IEEE Transactions on
Power Systems, , vol. 22, no. 3, pp. 1284-1293, August 2007.
compared, where Scenario 1 has greater variation in the [13] R. Saidur, H. Masjuki and I. Choudhury, "Role of ambient temperature,
energy consumption and Scenario 2 has greater variation in door opening, thermostat setting position and their combined effect on
the time constant of the appliances. This led to differences in refrigerator-freezer energy consumption," Energy Conversion and
the results for each scenario between the staggered and non- Management, vol. 43, no. 6, pp. 845-854, April 2002.
staggered control modes, indicating that accurate prediction [14] D. Jung and R. Radermacher, "Performance simulation of a two-
evaporator refrigerator—freezer charged with pure and mixed
of the time constant range in a system-wide schedulable- refrigerants," International Journal of Refrigeration, vol. 14, no. 5, pp.
interruptible fridge-freezer DSP scheme is crucial for 254-263, September 1991.
optimizing performance. [15] C. J. Hermes, C. Melo, F. T. Knabben and J. M. Gonçalves, "Prediction
of the energy consumption of household refrigerators and freezers via
V. CONCLUSION steady-state simulation," Applied Energy, vol. 86, no. 7, pp. 1311-1319,
July-August 2009.
In conclusion this paper presents the results of an [16] I. A. Sajjad, G. Chicco, M. Aziz and A. Rasool, "Potential of residential
aggregated fridge-freezer peak shaving and valley filling demand flexibility - Italian scenario," 11th International Multi-
control strategy for enhanced grid operations. Two scenarios conference on Systems, Signals & Devices (SSD), Barcelona, 11-14
in the test system (i.e. SEM) have been studied. Scenario 1 February 2014, pp. 1-6.
[17] Department of Energy & climate Change (UK), Energy Consumption
considers the energy class and Scenario 2 considers the size in the UK 2012 [Online]. Available:
of the fridge-freezer effects in 2020. The analyses of both https://www.gov.uk/government/organisations/department-of-energy-
scenarios show the importance of the control strategy start climate-change/series/energy-consumption-in-the-uk, accessed April
time and the staggering of the devices to get the desired 2014.
filling or shaving effect. The next steps in this research will [18] M. M. Almenta, J. Morrow, R. Best, B. Fox and A. Foley, "A smart
load appliance application using a single compressor fridge-freezer to
involve quantifying the value of the reserve and ancillary support grid operations," 49th International Universities Power
services available from aggregated fridge-freezers and Engineering Conference (UPEC), Cluj-Napoca, Rumania, 2-5
examining the effect of wind variable in the test system. September 2014, pp. 1-5.
[19] R. W. Lewis, P. Nithiarasu and K. Seetharamu. Fundamentals of the
Finite Element Method for Heat and Fluid Flow, Wiley, 2004.
REFERENCES [20] Department for Environment Food and Rural Affairs. "Saving energy
through better products and appliances. A report on analysis, aims and
[1] C. O'Dwyer, R. Duignan and M. O'Malley, "Modeling demand
indicative standards for energy efficient products 2009-2030,"
response in the residential sector for the provision of reserves," IEEE
December 2009, [Online]. Available:
Power and Energy Society General Meeting, San Diego, CA, 22-26
http://archive.defra.gov.uk/environment/economy/documents/energy-
July 2012, pp. 1-8.
products-1209.pdf, accessed August 2014.
[2] G. Strbac, "Demand side management: benefits and challenges,"
[21] Siemens Home Appliances [Online]. Available: http://www.siemens-
Energy Policy, vol. 36, no. 12, pp. 4419-4426, December 2008.
home.co.uk/our-products/fridges-freezers/fridge-freezers.html, accessed
[3] Kirby, B.J, "Demand response for power system reliability: FAQ,"
August 2014.
Technical Report ORNL/TM-2006/565, Oak Ridge National
[22] Northern Ireland Statistics and Research Agency [Online]. Available:
Laboratory, 2006.
http://www.nisra.gov.uk/, accessed April 2014.
[4] M. M. Almenta, J. Morrow, R. Best and B. Fox, "Assessment of
[23] Bosch Home Appliances [Online]. Available: http://www.bosch-
domestic load suitable for smart consumer load participation," 48th
home.co.uk/our-products/fridges-and-freezers/fridge-freezers.html,
International Universities Power Engineering Conference (UPEC),
accessed August 2014.
Dublin, 2-5 September 2013, pp. 1-6 .
[24] Eirgrid and SONI Operations, All-Island Generation Capacity
[5] M. Pipattanasomporn, M. Kuzlu, S. Rahman and Y.Teklu, "Load
Statement 2013-2022 Report, January 2013, [Online]. Available:
Profiles of Selected Major Household Appliances and Their Demand
http://www.eirgrid.com/media/All-Island_GCS_2013-2022.pdf,
Response Opportunities," IEEE Transactions on Smart Grid, vol. 5, no.
accessed April 2014.
2, pp. 742-750, March 2014.
[6] Demand Side Unit Workshop, October 2013 [Online]. Available:
http://www.eirgrid.com/media/DSU_WorkshopPresentationFinal.pdf,
accessed November 2014.
[7] N. Fitzgerald, A. M. Foley and E. McKeogh, "Integrating wind power
using intelligent electric water heating," Energy, vol. 48, no. 1, pp. 135-
143, December 2012.
[8] M. Stadler, W. Krause, M. Sonnenschein and U. Vogel, "Modelling and
evaluation of control schemes for enhancing load shift of electricity
demand for cooling devices," Environmental Modelling & Software,
vol. 24, no. 2, pp. 285-295, February 2009.
[9] M. A. Zehir and M. Bagriyanik, "Demand side management by
controlling refrigerators and its effects on consumers," Energy
Conversion and Management, vol. 64, pp. 238-244, December 2012.
[10] T. Bigler, G. Gaderer, P. Loschmidt and T. Sauter, "Smartfridge:
demand side management for the device level," IEEE 16th Conference
on Emerging Technologies & Factory Automation (ETFA), Toulouse,
5-9 September 2011, pp. 1-8.
[11] N. Baghina, I. Lampropoulos, B. Asare-Bediako, W. L. Kling and P. F.
Ribeiro, "Predictive control of a domestic freezer for real-time demand
response applications," 3rd IEEE PES International Conference and
Exhibition on Innovative Smart Grid Technologies (ISGT Europe),
Berlin, 14-17 October 2012, pp. 1-8.You can also read