A GUIDE TO UNDERSTANDING YOUR INDUSTRIAL ELECTRICITY BILL - RESOURCE EFFICIENCY AND CLEANER PRODUCTION
←
→
Page content transcription
If your browser does not render page correctly, please read the page content below
RESOURCE EFFICIENCY AND CLEANER PRODUCTION

A GUIDE TO UNDERSTANDING YOUR
      INDUSTRIAL ELECTRICITY BILL

                                  www.ncpc.co.za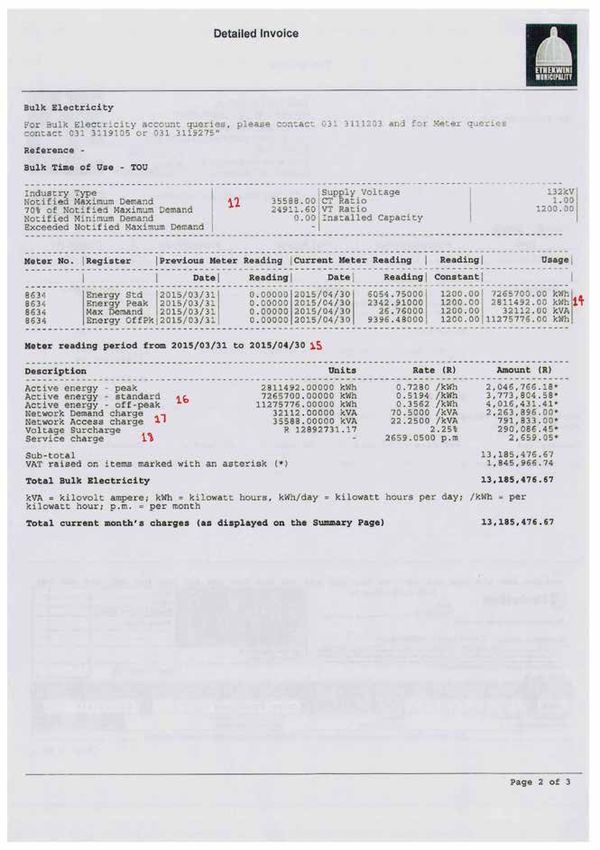
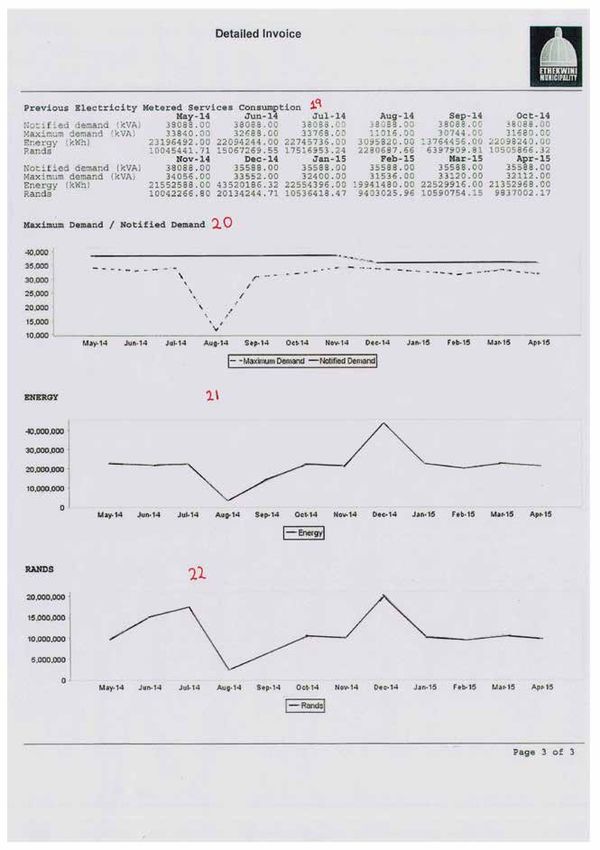
TABLE OF CONTENTS
Definitions                                                                         2

General		                                                                           3
     Background to electricity tariffs                                              3

Pricing of electricity                                                              4

So what is your electricity bill telling you?                                       5
     Some of the things you will find on your electricity bill are:                 5
     What should you check for on each electricity bill received?                   5
     Breakdown of your bill                                                         5

So why bother?                                                                      6

Different rates for different energy service providers                              6

More than just cents per kWh                                                        6

Basic energy usage                                                                  6

Different rates for different times                                                 6

Power factor charge                                                                 8
     Power factor correction                                                        8

Improving your power factor can reduce your overall energy cost in multiple ways    9
     Reducing peak kW billing demand                                                9
     Eliminating the power factor penalty                                           9
     Surcharge and fees                                                             9

How to read your electricity bill                                                   10
     Systematic approach                                                            10
     An example of an electricity bill                                              10

Figures
Figure 1: An example of rates applicable to ITOU tariff structure                   7
Figure 2: A power factor comparison by calculation for illustration purposes only   8
BEST PRACTICE GUIDELINES A Guide to Understanding your Industrial Electricity Bill DEFINITIONS Electrical energy is measured in a unit called kWh. The kilowatt-hour (symbol kWh, kW.h or kW h) is a derived unit of energy equal to 3.6 megajoules. If the energy is being transmitted or used at a constant rate (power) over a period of time, the total energy in kilowatt-hours is the power in kilowatts multiplied by the time in hours. Electrical power (kW) is the rate, per unit time, at which electrical energy is transferred by an electric circuit. The SI unit of power is the watt, one joule per second. Electric power is usually produced by electric generators, but can also be supplied by sources such as electric batteries. Maximum demand is measured in kVA. It is the power consumed over a pre-determined period of time usually 30 minutes. A kVA is simply 1,000 volt amps. A volt is electrical pressure. An amp is electrical current. A term called apparent power (the absolute value of complex power, S) is equal to the product of the volts and amps. On the other hand, a watt (W) is a measurement of real power. Network demand charge (NDC) is a charge that is variable on a monthly basis and is charged on the actual demand measured. Notified maximum demand / Network access charge (NAC) is a tariff component that is fixed on an annual basis and is charged as a R/kVA on the greater of the notified maximum demand or the actual demand. The network access charge should be the highest kVA that the customer expects the municipality to be in a position to supply. Restricted demand is the highest half-hourly demand in kVA taken by the customer between 16:00 and 20:00 from Monday to Friday. Retailer refers to the utility service provider. This could either be Eskom or the local municipality that sells electricity to the public for use or consumption rather than for resale. Notified minimum demand refers to the minimum half-hourly demand notified in writing by the customer for the purpose of claiming a discount and accepted as the minimum value to be used for calculating the maximum demand charge. The notified minimum demand remains in force for one year and may be reduced by giving one month’s notice, the revised notified minimum demand shall remain in force for a further period of one year. Service charge is the fixed charge payable per account to recover service related costs. 2
BEST PRACTICE GUIDELINES A Guide to Understanding your Industrial Electricity Bill

                                                                                                                                  GENERAL
The first thing we look at when opening an electricity bill is the amount owing. But there is so much more information
within your electricity bill. From meter numbers, to whether your last meter reading was estimated or refers to average
daily usage; your bill contains this information and much more.

On the surface, a commercial and industrial electricity bill can seem pretty simple. Dependant on the tariff structure your
premises has registered for with the council, every month you would either get charged a flat unit rate or a more complex
bill using a time of use (TOU) tariff. When you start asking questions like why you get charged what you do, or how much
do similar businesses pay, or what do all of the extra tariffs and fees mean, things can get pretty complex, pretty quickly.

Background to electricity tariffs1
In South Africa, our electricity is predominantly generated using fossil fuels via thermal coal fired power stations. Eskom
is South Africa’s primary electricity utility provider and supplies electricity to local municipalities, large industry and rural
areas. All electricity tariffs are approved by the National Energy Regulatory of South Africa (NERSA) and then passed on to
the relevant stakeholders.

Eskom tariffs are typically divided according to the following categories:

• Night save urban large – refers to an electricity tariff for high load factor urban customers with a notified maximum
  demand (NMD) greater than 1MVA.
• Night save urban small – refers to an electricity tariff for high load factor urban customers with an NMD greater than 25
  kVA but not exceeding 1 MVA.
• Mega flex–TOU – refers to an electricity tariff for urban customers with an NMD greater than 1 MVA able to shift load.
• Mini flex–TOU – refers to an electricity tariff for urban customers with an NMD ranging from 25 kVA up to 5 MVA able to
  shift load.
• Business rate – refers to a tariff for small businesses, governmental institutions or similar supplies in urban areas with an
  NMD up to 100 kVA.
• Home power standard – refers to an electricity tariff suitable for residential customers, in urban areas with an NMD of up
  to 100kVA.
• Home light – refers to a set of electricity tariffs that provides a subsidy to low-usage, single-phase residential supplies in
  urban areas.
• Night save rural – refers to an electricity tariff for high load factor rural customers with an NMD from 25 kVA with a supply
  voltage ≤ 22 kV (or 33 kV where designated by Eskom as rural).
• Ruraflex–TOU – refers to an electricity tariff for rural customers with dual and three-phase supplies with an NMD from
  25 kVA with a supply voltage ≤ 22 kV (or 33 kV where designated by Eskom as rural).
• Land rate – refers to an electricity tariff for rural customers with an NMD up to 100 kVA with a supply voltage of ≤ 500V.
• Land light – refers to an electricity tariff that provides a subsidy to low-usage single-phase supplies in rural areas, limited
  to 20A.

Local Municipal tariffs are typically divided according to the following categories:

• Residential – this is typically charged on a flat R/kWH rate. The best way to save money on this tariff structure is to switch
  of appliances when not needed.
• Residential TOU – this will be active in the near future.
• Business and general – this is typically charged on a flat R/kWH rate. The best way to save money on this tariff structure
  is to switch of appliances when not needed.
• Commercial TOU – this tariff structure charges different rates according to the time of day it is (peak, standard and off
  peak). The tariff type charges different rates according to the time of day and month of the year. There is also a maximum
  demand (MD) element. This tariff is favoured over the standard business and general and is recommended to users who
  have a notified maximum demand of 100KVA. This tariff's rates during peak,
  standard and off peak are less than commercial time of use tariff.

1. Eskom electricity tariff 2017 booklet [Online]. Available: http://www.eskom.co.za/CustomerCare/TariffsAndCharges/Pages/Tariffs_And_Charges.aspx
EThekwini Municipality Electricity Tariff Booklet 2017 – http://www.durban.gov.za/Resource_Centre/Services_Tariffs/Electricity%20Tariffs/Forms/AllItems.aspx   3
BEST PRACTICE GUIDELINES A Guide to Understanding your Industrial Electricity Bill PRICING OF ELECTRICITY Eskom’s average price for electricity is based on the overall cost of supply. However, in order to determine tariffs, it is necessary to initially break down the overall costs into relevant cost categories. Costs are expressed in a manner that will ultimately be applied to derive the tariffs according to an appropriate cost driver. By using the correct cost driver for each cost component, the possibility of inappropriate pooling of costs is reduced. Common cost drivers are: • R/customer/month or R/customer/day – is typically for customer service and administration costs. • R/kVA or R/kW – is typically for network costs. • c/kWh – is typically for energy costs. • c/kvarh – refers to reactive energy costs. • Energy loss factors for energy loss costs. The cost of providing electricity to customers varies according to: • The quantity of electricity used and the period (time or season) when the electricity is used. • The size or capacity of the supply required. • The geographic location of the customer. • The voltage at which supply is provided. • The cost of connecting supply. • The density of the points of delivery where the customer’s supply is located. A totally cost representative tariff will reflect the cost drivers and the factors that could influence cost by taking into account the following: • The time of use and seasonal variance of energy costs. • The unbundled costs for distribution and transmission networks. These costs are differentiated according to the supply voltage and the density of the points of delivery. • Retail charges that reflect the size of the customer and the service provided. • A connection charge that reflects the location of the supply and the impact on upstream costs. However, the tariff applied depends on meter capability, billing functionality and logistics, as well as limitations on tariff complexity, and the impact of changes to existing tariffs. For more energy-intensive users of electricity, tariff structures tend to be more complex, whereas for users such as domestic customers tariffs are simpler. A larger customer will have much lower supply cost than a smaller customer. Eskom larger customers generally subsidise smaller customers. The reasons for the higher cost for small customers follow: • As a ratio of overall consumption, smaller customers tend to use much more electricity in the more expensive peak periods and have a poorer load factor than larger customers. • Significantly more network capacity is required at the lower voltage level (e.g. 500 V) to supply a smaller customer than is required to supply a larger customer (e.g. 132 kV). This means that more electrical networks have to be built, maintained and operated to supply smaller customers. Also, more electrical losses occur in the latter sector. The overall price of Eskom electricity is regulated and is based on approved costs plus a return on investment as determined by NERSA. While Eskom’s average price (total revenue or total consumption) is based on cost, individual price levels per customer or per customer class might not be cost representative. This is due to cost averaging, historical cross-subsidies and social factors such as the customer’s ability to pay the determined price. 4
BEST PRACTICE GUIDELINES A Guide to Understanding your Industrial Electricity Bill

          SO WHAT IS YOUR ELECTRICITY BILL
                            TELLING YOU?
Many people have trouble understanding their electricity bill or even struggle to find specific information.

Some of the things you will find on your electricity bill
•   Payments you have made since your previous bill.
•   Any amounts still outstanding, as well as new charges for the current period.
•   The billing period for the current account.
•   Your average daily usage in units and Rands.
•   Your meter number(s) and the previous and current readings taken from the meter(s).

What you should check for on each electricity bill received
• If you receive concessions, check that they have been applied.
• If there are any amounts outstanding from previous bills.
• If there are any messages from your utility service provider relating to changes to your bill (i.e. rate increases, offers of
  monthly billing).

Breakdown of your bill
Keeping in mind that bills vary from retailer to retailer, you will find most of the following information on your electricity
bill. Please note that retailers may use slightly different wording.

You will usually find the following on the front page of your bill:

• Issue date – the date that the bill was generated by the retailer.
• Account number and/or customer number – this is your account number. You should quote this any time you call your
  electricity retailer.
• Your name and postal address – the postal address may differ from the supply/service address (i.e. post office box).
• Due date – the last day by which you must pay your bill.
• Billing period – the range of dates the bill covers (e.g. 1 January 2017 – 1 March 2017).
• Opening balance – the amount that was owed, or is in credit, when the previous bill was issued.
• Payments received – the amount you paid since the previous bill.
• Balance carried forward – the difference between the opening balance and the payments received. If you did not pay
  your last bill in full by the due date, a balance may be carried forward and added to your new charges. It is possible that
  you may have a credit carried forward.
• New charges or current charges – the new charges for the billing period covered by this bill.
• Discounts or credits – any discounts that are applied to your account in accordance with your plan, such as pay-on-time
  discounts or solar credits.
• Total amount due – the total amount that you currently owe. This may be split into two amounts if your plan has a pay-
  on-time discount, in that regard it will detail with and without discounts if paid by due date.

                                                                                                                              5
BEST PRACTICE GUIDELINES A Guide to Understanding your Industrial Electricity Bill SO WHY BOTHER? Effective management of electricity bills saves money. Electricity consumption should not be viewed as a fixed utility cost, because electricity consumption varies due to many factors which can be controlled, thus electricity consumption can be effectively managed. Understanding your electricity bill is an important step toward answering this question, and ultimately it’s one of the first steps toward saving money on your bill every month. DIFFERENT RATES FOR DIFFERENT ENERGY SERVICE PROVIDERS Electricity is billed as a charge per kilowatt hour – kWh. Depending on the type of customer you are, where you’re located, this rate can vary widely dependent on the energy service provider and must be approved by NERSA. If you don’t know what your rate is – you can look at your latest electricity bill. Sometimes it’ll be listed outright as something like a “blended rate”, otherwise you can divide your electricity charges (cost) by your total kWh to get a close approximation. MORE THAN JUST CENTS PER KWH While the cost per kWh is the simplest way to look at your electricity bill, there’s quite a bit more to it than that. To make things extra-complex, the bill you get from one utility provider could be very different from the bill you receive from another utility provider. Your electricity bill depends on which local municipality supplies for you, at what voltage you are supplied at etc. Still, even with all the differences, most electricity bills can be broken down into just a few broad categories. BASIC ENERGY USAGE This is the base charge for the actual energy you will use. It will probably look something like, “Energy (kWh) Charge”. It may be broken down further into peak, standard and off peak charges if you are registered on a TOU tariff. DIFFERENT RATES FOR DIFFERENT TIMES Instead of a single flat rate for energy use, TOU rates are higher when electric demand is higher. Therefore, when you use energy is just as important as how much you use. TOU rates better align the price of energy with the cost of energy at the time it’s produced. Lower rates during partial-peak and off-peak hours offer an incentive for customers to shift energy use away from more expensive peak hours. Aligning to these can help you save money and reduce strain on the electric grid. 6
BEST PRACTICE GUIDELINES A Guide to Understanding your Industrial Electricity Bill

                                     Low demand season                                                          High demand season

                                           23 24        1                                                            23 24       1
                                      22                      2                                                 22                      2
                                 21        Weekdays                    3                                   21         Weekdays                3

                           20                                              4                         20                                           4
                                            Saturday                                                                    Saturday
                      19                                                        5                19                                                     5

                     18                         Sunday                          6               18                        Sunday                        6

                      17                                                        7               17                                                      7

                       16                                                   8                     16                                                8

                                15                                     9
                                                                                      Peak                15                                  9
                                      14                      10                      Standard                  14                       10
                                           13            11                                                          13            11
                                                  12                                  Off-peak                              12

                      LOW DEMAND SEASON                                                                              LOW DEMAND SEASON
  TIME PERIODS        MON-FRI                     SAT                      SUN          TIME PERIODS                 MON-FRI                  SAT                SUN
  22:00 - 06:00    Off-Peak                Off-Peak                Off-Peak             22:00 - 06:00            Off-Peak               Off-Peak            Off-Peak
  06:00 - 07:00    Standard                Off-Peak                Off-Peak             06:00 - 07:00            Peak                   Off-Peak            Off-Peak
  07:00 - 10:00    Peak                    Standard                Off-Peak             07:00 - 09:00            Peak                   Standard            Off-Peak
  10:00 - 12:00    Standard                Standard                Off-Peak             09:00 - 12:00            Standard               Standard            Off-Peak
  12:00 - 18:00    Standard                Off-Peak                Off-Peak             12:00 0 17:00            Standard               Off-Peak            Off-Peak
  18:00 - 20:00    Peak                    Standard                Off-Peak             17:00 - 18:00            Peak                   Off-Peak            Off-Peak
  20:00 - 22:00    Standard                Off-Peak                Off-Peak             18:00 - 19:00            Peak                   Standard            Off-Peak
                                                                                        19:00 - 20:00            Standard               Standard            Off-Peak
                                                                                        20:00 - 22:00            Standard               Off-Peak            Off-Peak

     Industrial Time of              Energy Rates (c/kWh)                           High Season                             June - August
     Use (ITOU)                      Peak                                           Standard                                Off-peak
     For customers with
     Notified Max Demand             260,19                                         83,85                                   48,81
     greater than 100kVA
     only
                                     Energy Rates (c/kWh)                           Low Season                              September - May
                                     Peak                                           Standard                                Off-peak
                                     89,71                                          64,00                                   43,23

       Network Demand Charge (R/kVA)                          Network Access Charge (R/kVA)                                   Service Charge (R)
              Based on Actual Demand                          Based on highest demand recorded                                   Rand per Month

                                       81,70                                                 25,85                                                    3 355,00
         Voltage Surcharge                                                 HIGH SEASON VS LOW SEASON ENERGY RATE
                                                               300
         Voltage          % Surcharge
                                                               250
         275 kV                  0,00
                                                               200
         132 kV                  2,25
                                                               150                                                                                 High Season
          33 kV                  3,00                                                                                                              Low Season
                                                               100

          11 kV                 10,50                             50

          6,6 kV                12,75                              0
                                                                           Peak                Standard                   Off-Peak
          400kV                 22,50                                                        Time Interval

                                 Figure 1: This is an example of rates applicable to the ITOU tariff structure
                                         (Source: eThekwini Municipality tariff booklet 2016 -2017).

As illustrated above if your business could utilise energy during standard and off peak times, considerable monetary
savings can be achieved.

                                                                                                                                                                       7
BEST PRACTICE GUIDELINES A Guide to Understanding your Industrial Electricity Bill
POWER FACTOR CHARGE2
Power factor (PF) is the term used to describe how efficiently a facility utilises all of the electrical power it consumes. Some
utilities will penalise a consumer if the power factor is below a certain threshold, if it is 90% for example. To address this,
a power factor correction system can be installed on a customer’s side of the utility meter, so power factor penalties are
eliminated and/or a reduction in billing is achieved.
Power factor correction
The demand components (kVA) within the bulk electricity tariffs are directly affected by the power factor of operation.
From a tariff perspective it is in the customers best interest to keep the power factor as close to unity as possible because
the kVA of operation increases as the power factor decreases resulting in the customer paying higher network demand
charges and higher network access charges. Low power factors are caused by inductive loads such are induction motors,
fluorescent lights etc. In order to compensate for these inductive loads, capacitive components have to be introduced into
the system and these components are commonly known as power factor correction capacitors. Power factor correction
technology has advanced successfully over the years and there are many types of efficient solutions available on the
market today. For further advice on power factor correction, please contact specialist firms.
An example (based on ITOU Tariff rates):
BEFORE POWER FACTOR AFTER POWER FACTOR
Demand charge = R81,70/kVA Demand charge = R81,70/kVA
Assume Max Demand = 500 kW Assume Max Demand = 500 kW
Power factor = 0,7 Power factor = 0,99 kVA
A
kV
kVAr Cos Φ = kW kVAr
Cos Φ = kW
Φ
kVA Φ kVA
kW
kVA = 500/0,7 = 714 kW kVA = 500/0,99 = 505
Maximum Demand = 714 x 81,70 Maximum Demand = 505 x 81,70
Demand Charge R 41 258,50
Demand Charge (per month) R58 333,80
Saving (per month) R 17 075,30
Figure 2: This reflects a power factor comparison by calculation (Source: eThekwini Municipality tariff booklet 2016-2017).
2. eThekwini Municipality electricity tariff booklet 2017 [Online]. Available: http://www.durban.gov.za/Resource_Centre/Services_
8 Tariffs/Electricity%20Tariffs/Forms/AllItems.aspxBEST PRACTICE GUIDELINES A Guide to Understanding your Industrial Electricity Bill
IMPROVING YOUR POWER FACTOR
CAN REDUCE YOUR OVERALL ENERGY
COST IN MULTIPLE WAYS
Reducing peak kW billing demand
Inductive loads which require reactive power are the cause of low power factor. This increase in required reactive power
(kVAr) causes an increase in required apparent power (kVA), which is what the utility is supplying. Thus, a facility’s low power
factor causes the utility to increase its generation and transmission capacity in order to handle this extra demand.
Eliminating the power factor penalty
Utility suppliers usually charge customers an additional fee when their power factor is less than 0.95. In fact, some utilities
are not obligated to deliver electricity to their customer at any time the customer’s power factor falls below 0.85.
The typical payback period for this type of project is 12 to 24 months, and overall energy savings range from 5 to 30%.
Surcharges and fees
Besides your charges for energy usage, chances are your electric bill includes at least a few extra fees or surcharges. These
can cover anything from energy efficiency incentives to electrical grid maintenance.
Sometimes, they’re tied to how much energy you use. Other times, they can be a flat fee that everyone pays, no matter
how much electricity they use.
Either way, they won’t generally make up a significant portion of your energy bill, but they’re worth understanding.
9BEST PRACTICE GUIDELINES A Guide to Understanding your Industrial Electricity Bill
HOW TO READ YOUR ELECTRICITY BILL
Systematic approach
By comprehensively understanding your electricity bill, you guarantee that the utility service is effectively managed and
thus make your business sustainable.
Always follow these six step when reading your electricity bill:
1 2 3 4 5 Install a check 6
meter to
verify that the Conduct a
Verify that council meter tariff analysis
Analyse
Ensure that all the electrical Ensure you installed has to confirm
previous bills
account related meter num- are billed on been set up that your
to confirm
information is ber matches the correct correctly, organisation
there are no
correct. to the bill tariff structure. as well as is on the
discrepancies.
received. to assist in correct tariff
effectively structure.
managing
what you
measure.
An example of an electricity bill
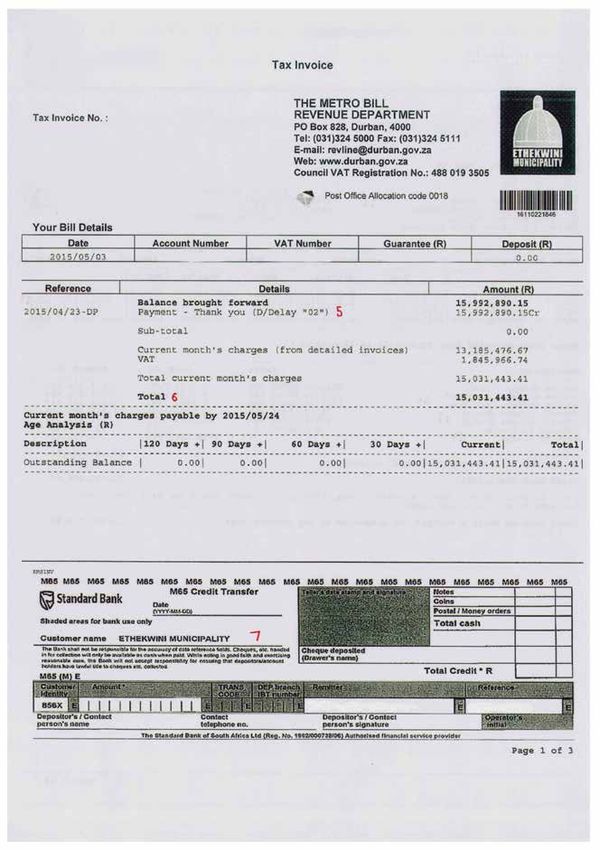
The example that follows describes the consumption data and costs associated with an eThekwini electricity invoice, other
retailers such as Eskom and local municipalities have different layouts for their bills but generally exhibit similar data.
LEGEND FOR THE FIGURES TO FOLLOW:
11 Tax invoice number: This is typically used by
the accounts department for VAT purposes.
5
5
This is the balance brought forward from
the previous month, as well as confirmation
that the retailer has received payment from
2 Client’s address and account details:
2 Confirm that this information is correct for
your company.
your company. 6 The total payment expected by the retailer
6 for the current consumption.
3 Account number: Use this as reference
3 when making payment or querying a 7 Details for the retailer when making
problem on your account. 7 payment.
4 This should reflect your company’s VAT
4 number.
10BEST PRACTICE GUIDELINES A Guide to Understanding your Industrial Electricity Bill
1
2
3 4
5
6
7
11BEST PRACTICE GUIDELINES A Guide to Understanding your Industrial Electricity Bill
8
9
10
11
12
13 14
15
16
17
18
12BEST PRACTICE GUIDELINES A Guide to Understanding your Industrial Electricity Bill
Did you know?
• The tariff structure is dependent on voltage intake; distance from the source; as well as maximum demand,
which must be approved by the National Energy Regulator of South Africa (NERSA). In many instances
reducing your notified maximum demand can yield monetary savings that can take into consideration
future expansions etc.
• If you are on a time of use tariff structure and have large inductive loads such as electrical motors etc., it
is imperative that power factor correction (PFC) is installed on your main incomer. Additional monetary
savings can be achieved by load shifting, i.e., shift loads to operate during off peak or standard periods
where the average weighted R/kWh is relatively cheaper to operate.
88 Clients address and account details:
Confirm that this information is correct for
16
16 This is active energy broken up into peak,
standard and off peak for the ITOU tariff
your company. structure.
99 Reference: This refers to the actual physical
address for your company. Review and
17
17 Network demand charge: This is a charge
that is variable on a month-to-month basis
confirm if these details are correct. and is charged on the actual demand
measured. Demand charge is the highest
10 This refers to the type of tariff structure your
10 company is registered with the retailer.
actual demand recorded over a 30 minute
period during the billing period. Network
11 The supply voltage that the retailer supplies demand charge is dependent on the power
11 your company with. factor of the site and is only applicable to
TOU tariffs.
12 Details of the tariff structure your company
12 is billed on. Network access charge is a tariff component
that is fixed on an annual basis and is
13 Meter number: Confirm if these details are
13 correct.
charged as a R/kVA on the greater of the
notified maximum demand or the actual
14 This is the actual energy consumption and demand. The network access charge should
14 demand for the billing month. be the highest kVA that the customer
expects the municipality to be in a position
15 Meter reading period notes the date and
15 month.
to supply.
18 Voltage surcharge is dependant on your
18 companies intake voltage.
13BEST PRACTICE GUIDELINES A Guide to Understanding your Industrial Electricity Bill
19
20
21
22
14BEST PRACTICE GUIDELINES A Guide to Understanding your Industrial Electricity Bill
19 Reflects the yearly profile of energy 21 An illustration of the energy profile on a year
19 consumption, cost spent and maximum
21 to date basis.
demand on a year to date basis.
22 An illustration of the cost in rands on a year
20 An illustration of the maximum demand vs.
22 to date basis.
20 NMD profile on a year to date basis.
15BEST PRACTICE GUIDELINES A Guide to Understanding your Industrial Electricity Bill NOTES 16
Pretoria  +27 12 841 3772           Cape Town  +27 21 658 2776           Durban  +27 31 242 2441
                                   Email ncpc@csir.co.za

                                                                                     www.ncpc.co.za
You can also read