Q121 RESULTS January 29, 2021 - Siemens Gamesa
←
→
Page content transcription
If your browser does not render page correctly, please read the page content below

Q121                   RESULTS
                            January 29, 2021

© Siemens Gamesa Renewable Energy
DISCLAIMER
 “This material has been prepared by Siemens Gamesa Renewable Energy, and is disclosed solely for information purposes.
 This document contains declarations which constitute forward-looking statements, and includes references to our current intentions, beliefs or expectations regarding future
 events and trends that may affect our financial condition, earnings and share price. These statements may be identified by words such as “expect,” “look forward to,” “anticipate”
 “intend,” “plan,” “believe,” “seek,” “estimate,” “will,” “project,” or words of similar meaning. We may also make forward-looking statements in other reports, prospectuses, in
 presentations, in material delivered to shareholders, and in press releases. In addition, our representatives may from time to time make oral forward-looking statements. These
 forward-looking statements do not constitute a warranty as to future performance and imply risks and uncertainties. Therefore, actual results may differ materially from those
 expressed or implied by the forward-looking statements, due to different factors, risks and uncertainties, such as economical, competitive, regulatory or commercial factors. The
 value of any investment may rise or fall and, furthermore, it may not be recovered, partially or completely. Likewise, past performance is not indicative of future results.
 The facts, opinions, and forecasts included in this material are furnished as of the date of this document, and are based on the company’s estimates and on sources believed to
 be reliable by Siemens Gamesa Renewable Energy, but the company does not warrant their completeness, timeliness or accuracy, and, accordingly, no reliance should be
 placed on them in this connection. Both the information and the conclusions contained in this document are subject to changes without notice. Siemens Gamesa Renewable
 Energy undertakes no obligation to update forward-looking statements to reflect events or circumstances that occur after the date the statements were made.
 The results and evolution of the company may differ materially from those expressed in this document. None of the information contained in this document constitutes a
 solicitation or offer to buy or sell any securities or advice or recommendations with regard to any other transaction. This material does not provide any type of investment
 recommendation, or legal, tax or any other type of advice, and it should not be relied upon to make any investment or decision.
 Any and all the decisions taken by any third party as a result of the information, materials or reports contained in this document are the sole and exclusive risk and responsibility
 of that third party, and Siemens Gamesa Renewable Energy shall not be responsible for any damages derived from the use of this document or its content.
 This document has been furnished exclusively for information purposes, and it must not be disclosed, published or distributed, partially or totally, without the prior written consent
 of Siemens Gamesa Renewable Energy.
 Siemens Gamesa Renewable Energy prepares and reports its Financial Information in thousands of euros (unless stated otherwise). Due to rounding, numbers presented may
 not add up precisely to totals provided.
 In the event of doubt, the English language version of this document will prevail."
 Note on alternative performance measures (APMs)
 This document includes supplemental financial measures that are or may be alternative performance measures (non-GAAP-measures). These supplemental financial measures
 should not be viewed in isolation or as alternatives to measures of Siemens Gamesa´s net assets and financial position or results of operations as presented in its consolidated
 financial statements. Other companies that report or describe similarly titled alternative performance measures may calculate them differently. The definitions and reconciliation of
 the alternative performance measures that are included in this presentation are disclosed in the Activity Report associated to these and previous results. The glossary of terms is
 also included in the Activity Report associated to these results.

© Siemens Gamesa Renewable Energy                                                        2
Q1 21 Key points

© Siemens Gamesa Renewable Energy   3
Q1Q2Q3Q4                              2021 .................................................................................................................
                                                                                                                                                                            Key points

Q1 21 Key points

     ✓ Solid start to FY21 and annual guidance maintained
        ▪     Revenue: €2,295m and EBIT margin1: 5.3%
        ▪     Net debt of €476m2 driven by seasonal working capital
        ▪     Strong funding position with c. €4.6bn in available liquidity

     ✓ Turnaround actions on track with new organization and LEAP program in place
        ▪     Further consolidation of manufacturing capacity announced in January; simplification of the WTG organization ongoing

     ✓ Strong momentum in renewables and SGRE well positioned to benefit
        ▪     €30bn order backlog, up €2bn YoY, 9.3 GW Offshore pipeline, and actively involved with clients in 2021 Offshore auctions
        ▪     Q1 21 Group orders of €2.3bn with a steep increase in SG 5.X order intake volume: 1.1 GW

     ✓ Further improvement in sustainability metrics

1)    EBIT margin pre PPA and I&R costs, excluding the impact of PPA on the amortization of intangibles: €60m, and the integration and restructuring costs: €47m in Q1 21
2)    Short- and long-term lease liabilities included in net debt amounted to €677m as of December 31, 2020

© Siemens Gamesa Renewable Energy                                                                                     4
Q1Q2Q3Q4                           2021 …..............................................................................................................
                                                                                                                                                   Key points

Onshore turnaround levers progressively in place

                         2.4 GW in Onshore orders in Q1 21 under
                         the new commercial strategy                                               1.1 GW of leading SG 5.X orders in Q1 21
                         ▪     Profit over volume                                                  ▪   2.3 GW cumulative orders including 434 MW
                         ▪     Balanced risk reward project profile                                    Santo Agostinho in Brazil

                         Capacity consolidation and reduction of                                   WTG reorganization
                         supply chain complexity                                                   ▪   Enhanced backlog control
                         ▪     Further manufacturing footprint                                     ▪   Implementation of PM@SGRE1
                               consolidation announced in January 2021                             ▪   Transfer of best practices

1)   Content of the PM@SGRE can be found in page 42 of SGRE Capital Markets Day presentation

© Siemens Gamesa Renewable Energy                                                              5
Q1Q2Q3Q4                             2021 …..............................................................................................................
                                                                                                                                                                                                                                      Key points

Further progress in our ESG1 commitments

           Member of Gender Equality Index for the second year increasing the score from 69% to 75%

           Member of the Dow Jones Sustainability Indices World and Europe, effective as of November 23, 2020. #4 of 114 companies in
           the Machinery and Electrical Equipment (IEQ) sector, and stands at 97th percentile, among sector leaders

           ISS2 ESG corporate rating completed with an overall rating B+, status prime, and positioned in decile Rank 1 in the sector Machinery

      Committed to respecting human rights and the environment …                                                                    …and part of the main ESG indices

                                                                                                                                                                                                EURO STOXX®
                                                                                                                                                                                                 Sustainability

 1)   ESG: Environmental, Social and Governance
 2)   ISS ESG is a division of the ISS (Institutional Shareholder Services) group that, among other activities, rates the sustainability of listed companies on the basis of their environmental, social and governance performance

© Siemens Gamesa Renewable Energy                                                                                       6
Commercial activity

© Siemens Gamesa Renewable Energy
Q1Q2Q3Q4                            2021 …..............................................................................................................
                                                                                                                                                                                             Commercial activity

Order backlog: €30.1bn, up 7.2% YoY, with order intake of €2.3bn in Q1 21

                                  Order intake LTM1 and Q1 (€m)                                                                                                    Order backlog (€m)

                                                            1

                                                                                                                                                    +7.2%                                 +7.2%
                        -16.5%                                                                                                                                30,104
             14,836                                                                                                                                                                               30,104
                                                                                                                                         28,089                                  28,089
              3,840               12,389                                                                                                                                                          6,020
                                                                                                                                                                                  6,495
                                                                                                                                         13,023               15,272
                                   3,186                                             -50.7%                                                                                                       5,868
                                                                            4,628
              4,250                                                                                                                                                               6,062
                                   3,664                                    1,470
                                                       Service                                  2,281                                    7,586                 7,903
                                                                            1,547                                                                                                                 18,216
              6,746                                    WTG OF                                      505                                                                           15,533
                                   5,539                                                       157
                                                       WTG ON               1,611               1,619                                    7,480                 6,929

       LTM as of Q1 20 LTM as of Q1 21                                     Q1 20                 Q1 21                                   Q1 20                 Q1 21             Q1 20            Q1 21

              1.5x                  1.3x           Book-to-Bill             2.3x                  1.0x                              Service         WTG OF             WTG ON    APAC      Americas        EMEA

                                                            93% coverage2 of midpoint of FY21 revenue guidance
                         Volatile profile of Offshore market dynamics reflected in Q1 order intake in WTG and Service both in FY20 (+) and FY21 (-)

1)   Solar orders in LTM as of Q1 20 of €36m and in LTM as of Q1 21 of €61m. No solar orders in Q1 20 or Q1 21
2)   Revenue coverage: Q1 21 sales plus order backlog (€) as of December 20 for FY21 sales activity divided by the FY21 revenue guidance range of €10.2bn to €11.2bn

© Siemens Gamesa Renewable Energy                                                                                 8
Q1Q2Q3Q4                             2021 …..............................................................................................................
                                                                                                                                                                                                    Commercial activity

Strong contribution of the SG 5.X with 1.1 GW out of total 2.4 GW Onshore orders in Q1

                            Onshore order intake1 LTM and Q1 (MW)

                                                                                                                           ........................
                                                                                                                                                 Focus on profitability over volume
                    -17.4%                                                                -7.9%                                                  Commercial activity in Q1 21 driven by Americas and EMEA
          9,581                                                                2,563
                                7,919
                                                                                                     2,360                                       ▪ Sweden (22%), US (21%) and Vietnam and Brazil (each 20%) are the
          2,983                                                                 815                   479                                          largest contributors to order intake (in MW)
                                2,161
                                                        APAC
                                                                               1,069                 1,099
                                                                                                                          ...                    ▪ Declining APAC driven by slow down in the Indian market and lower
          4,452                 3,139
                                                        Americas                                                                                   order intake in China
          2,147                 2,619                   EMEA                    678                   782
                                                                                                                                                 Steep increase in 4 MW+ platforms: 82% of Q1 order intake
     LTM as of Q1 20 LTM as of Q1 21                                           Q1 20                 Q1 21                                       ▪ 1.1 GW in SG 5.X order intake

                Average selling price of Onshore order intake1 (€m/MW)

                                                                                                                           .......................
              -5.7%              -1.2%
       0.74              0.70              0.69
                                                                              0.78       0.73                 0.69                              Stable pricing
                                                                   0.63                            0.63
                                                                                                                          ...
                                                                                                                                                ▪ ASP variation reflects geographic and product mix, project scope and FX

     LTM as           LTM as            LTM as                    Q1 20      Q2 20      Q3 20     Q4 20       Q1 21
     of Q1 19         of Q1 20          of Q1 21

1)    Onshore order intake (MW) and average selling price of Onshore order intake includes only wind orders

© Siemens Gamesa Renewable Energy                                                                                     9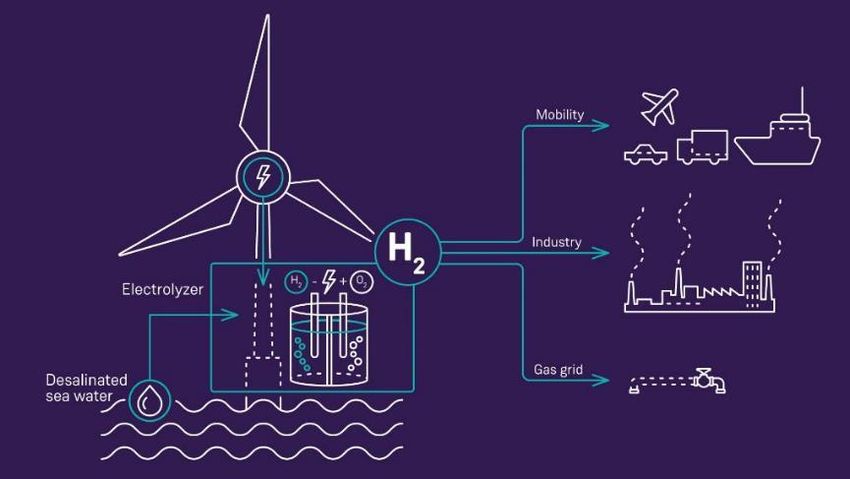
Q1Q2Q3Q4                              2021 …..............................................................................................................
                                                                                                                                                                              Commercial activity

Leading competitive positioning in Offshore: 6.1 GW in order backlog and 9.3 GW in pipeline

                Offshore order intake (MW)                                                                                        Backlog and Pipeline1 (GW)

                                                                                                               Backlog: 6.1 GW                            Pipeline1: 9.3 GW
              -14.4%

      3,343
                       2,860
      1,904                                                                                                                           1.5
                                         1,279                                                                                                      0.1
                       2,860
      1,439                        376
                                          903
     LTM as          LTM as              Q1 20           Q1 21                                                                                    0.6
     of Q1 20        of Q1 21                                                                                                    1.3 1.4
          APAC           Americas           EMEA
                                                                                                                                                                                             0.6
                                                                                           4.4                                                  0.3 1.1
           Offshore backlog and pipeline1
                                                                                                                                      1.0 1.5                                           1.3 0.3

                                                        9.3 GW
       6.1 GW

                                                                                                            Total pipeline1 for the SG 14-222 DD of 4.3 GW
Order backlog          Revenue       Order backlog Pipeline1
as of Dec. 20           FY21            FY21+                                 Actively involved with clients participating in Q4 202 and 2021 Offshore auctions amounting to c. 25 GW
                                                                                              Good order intake expectations for FY21 despite no order intake in Q1 21
1)    Pipeline made of preferred supply agreements and conditional orders that are not part of SGRE’s Offshore backlog
2)    Calendar year 2020 (Q1 fiscal year 2021)
© Siemens Gamesa Renewable Energy                                                                                   10
Q1Q2Q3Q4 2021 …..............................................................................................................
Commercial activity
51% of the Group backlog comes from Service
Service order backlog (€m)
.....................
+17.3%
15,272
13,023
€15,272m or 51% of order backlog in Service
2,384
2,195
2,546
2,460
APAC ... ▪ Retention rate of 69%
Americas ▪ Annual growth positively impacted by Senvion Service asset acquisition
10,428 in January 2020
8,283 EMEA
Q1 20 Q1 21
Service order intake LTM and Q1 (€m)
.....................
-17.0%
3,840 Sound commercial performance. YoY comparison reflects strong
1,006
3,186 Service activity in Q1 20 related to new Offshore turbine orders
679
367
768
APAC 1,470
-65.7% ... ▪ Book-to-Bill: 1.8x in LTM as of Q1 21 and 1.3x in Q1 21
Americas
479 ▪ 10-year contract for Senvion assets signed in Latin America, raising total
2,155 2,052 168 505
contracts signed since acquisition to 1.5 GW
EMEA 823 143 24
337
LTM as of Q1 20 LTM as of Q1 21 Q1 20 Q1 21
© Siemens Gamesa Renewable Energy 11Q1Q2Q3Q4 2021 …..............................................................................................................
Commercial activity
Decarbonization commitments and green recovery programs underpin strong prospects for the
wind industry 94
+30
63 GW/year
70
Global decarbonization targets1
brought forward. Transformation of the World3 56
energy market (2/3 of global emissions) is core to reach them (GW/year) 6
24
▪ US, EU, UK, Japan, South Korea…targeting1 net zero emissions by 2050; China by 2060 2019 2026-28
19
16
15 14
Joe Biden confirms climate among his priorities
19 11 10
▪ PTC and ITC extended; US to rejoin Paris Agreement Americas3
16
(GW/year) 3 4
0 0
2019 2020-22 2023-25 2026-28
Offshore wind to be the #1 source of electricity in the EU by 2040 with
300 GW installed by 20502 33
25
22
▪ NGEU funding programs started 16 21
19 20
12
EMEA3 5
12
4 4
10 point plan for a green industrial revolution (GW/year)
2019 2020-22 2023-25 2026-28
▪ Point 1: advancing Offshore wind (40 GW by 2040)
47
36 38
30
Offshore wind taking center stage in East Asia: Taiwan, Japan, South 31 32
38
Korea, Vietnam APAC3 28
(GW/year) 2 5 6 8
2019 2020-22 2023-25 2026-28
1) Official and non-official targets Onshore Offshore
2) According to the new EU Strategy on Offshore Renewable Energy
3) Market charts present the average annual installations according to Wood Mackenzie Q4 2020 outlook. Installations represent the expected annual averages for the 3-year periods
© Siemens Gamesa Renewable Energy 12Q1 21 Results & KPIs © Siemens Gamesa Renewable Energy
Q1Q2Q3Q4                            2021 .................................................................................................................
                                                                                                                                                                              Q1 21 Results & KPIs

Consolidated Group – Key figures Q1 21 (October - December)

P&L (€m)                                                                  Q1 20             Q1 21            Var. YoY
Group revenue                                                             2,001              2,295             14.7%     Top line: pandemic COVID-19 still slowing down movement of people and
EBIT pre PPA and I&R costs                                                  -136               121                N.A.   goods, impacting Onshore project execution mainly
EBIT margin pre PPA and I&R costs                                         -6.8%              5.3%            12.1 p.p.
                                                                                                                         EBIT pre PPA and I&R costs: solid performance in the Offshore and
PPA amortization1                                                             66                60              -9.2%
                                                                                                                         Service markets with no Onshore project cost overruns in Northern Europe
Integration & restructuring costs                                             27                47             72.0%
Reported EBIT                                                               -229                14                N.A.   Integration and restructuring costs of €47m in Q1 21 include:
Net interest expenses                                                        -12               -12              -3.6%    ▪ Restructuring of India and some operations in Europe
Tax income                                                                    68                 8            -88.7%
                                                                                                                         ▪ Integration of Senvion, end-to-end digitalization and IT digital office
Reported net income to SGRE shareholders                                    -174                11                N.A.
                                                                                                                           projects
CAPEX                                                                        92                140                48
                                                                                                                         Reported net income of €11m to SGRE shareholders in Q1 21 includes:
CAPEX to revenue (%)                                                       4.6%               6.1%            1.5 p.p.
                                                                                                                         ▪ PPA amortization1 net of taxes of €43m in line with annual expectations

Balance Sheet (€m)                                                        Q1 20             Q1 21            Var. YoY    ▪ I&R cost net of taxes of €34m. I&R impact to increase in coming quarters
Working capital                                                             -939            -1,699               -760
                                                                                                                           in line with guidance
Working capital to LTM revenue (%)2                                       -9.4%            -17.4%            -8.0 p.p.   Q1 21 CAPEX of €140m reflects investment for future growth:
Provisions3                                                               2,198              2,115                -83    ▪ Investment in blade and nacelle facility in Le Havre
Net (debt)/cash4                                                             175              -476               -650
Net (debt)/cash to LTM EBITDA2                                              N.A.               -3.4              N.A.    ▪ R&D investment in new Onshore and Offshore products

1)   Impact of PPA on the amortization of the fair value of intangibles
2)   LTM revenue as of December 20: €9,777m; LTM EBITDA as of December 20: €138m
3)   Within total provisions, Adwen provisions stand at €510m
4)   Short- and long-term lease liabilities included in net debt amounted to €677m as of December 31, 2020
© Siemens Gamesa Renewable Energy                                                                                14
Q1Q2Q3Q4 2021 .................................................................................................................
Q1 21 Results & KPIs
Revenue performance driven by Offshore and Service strength
Q1 Group revenue (€m) Q1 Onshore sales volume by geography (MWe)
-0.1%
+14.7% 1,747 1,744
2,295
2,001 363 456 +26% YoY
396
+8% YoY
366
838 +62% YoY
518 822 +5% YoY
861
-5% YoY
1,116 1,061 -24% YoY
562
427
Q1 20 Q1 21 Q1 20 Q1 21
Service WTG OF WTG ON APAC Americas EMEA
...
….....…..................................................................................................................................
▪ Negative FX impact on Q1 21 revenue
▪ Onshore project execution speed still impacted by COVID-19, especially in US, with an acceleration expected in H2 21
▪ Revenue performance in Offshore and Service in line with annual expectations
▪ YoY evolution of Offshore revenue favorably impacted by scheduled ramp-up of SG 8.0-167 DD in Q1 20, reducing manufacturing activity level
© Siemens Gamesa Renewable Energy 15Q1Q2Q3Q4 2021 .................................................................................................................
Q1 21 Results & KPIs
Sound performance in the Offshore and Service markets drive margin improvement
EBIT margin pre PPA and I&R costs Group EBIT pre PPA and I&R costs (€m): Q1 21 vs. Q1 20
25.9%
24.1%
Productivity gains offset
5.3%
pricing pressure
121
1.0%
-6.8% -136
-13.7% EBIT pre Pricing Productivity Other Fixed Volume Mix & Northern Other EBIT pre
PPA, EBIT costs scope Europe PPA,
I&R Q1 impact I&R Q1
Q1 20 Q1 21 Q1 20 Q1 21 Q1 20 Q1 21
20 21
...
…..................................................................
WTG SE Group
▪ Pricing, productivity and volume effects in line with expectations
▪ Positive impact on Service performance from lower product failure rates
and from reductions in third party spending
© Siemens Gamesa Renewable Energy 16Q1Q2Q3Q4 2021 .................................................................................................................
Q1 21 Results & KPIs
Net debt position in Q1 21 driven by working capital increase year to date
Net (debt)/cash variation YTD in Q1 21 (€m)
Q1 21 gross operating cash flow: €151m
▪ Q1 21 gross operating cash flow of €151m driven
by profitability improvement
▪ Q1 21 working capital variation of €409m2 driven
by:
▪ Lower order intake
-49
▪ Annual activity planning with increasing
deliveries in H2
▪ Normalization of high year-end FY20
working capital levels
▪ Asset management program in place to
-476 maintain a strict control of working capital
Net debt Income D&A incl. Other Provisions Provisions Taxes Working CAPEX Adwen Others Net debt ▪ CAPEX of €140m
Sept. 20 before PPA w/o cash charged used paid Capital related Dec. 20
Gross taxes impact variation provision Gross ▪ Adwen provision uses of €24m in line with FY21
debt1: usage debt1: estimate of c. €125m
-€1,670m -€2,008m
Cash: Cash:
€1,622m €1,533m
1) Gross debt includes lease liabilities of €611m as of Sept. 20 and €677m as of Dec. 20. Excluding lease liabilities, gross debt as of Dec. 20 amounts to €1,332m
2) Working capital cash flow effective change
© Siemens Gamesa Renewable Energy 17Q1Q2Q3Q4 2021 .................................................................................................................
Q1 21 Results & KPIs
Strong funding position
Liquidity status as of December 31, 2020 (€m) Financing facilities maturity profile (€m)
1,533 4,557
4,356 1,3413
Short-term1 credit lines €1,158m
2,191
Long-term2 credit lines €2,150m
1,158
2,039
Long-term Loans €1,048m 715 742
442 153 112
150 3 1 111 1 152
FY21 FY22 FY23 FY24 FY25 FY26
Authorized Drawn Cash Available
lines liquidity Available unused lines
Gross debt
1) Bilateral bank facilities renewed on a yearly basis
2) Maturity exceeding 1 year
3) Gross debt of €1,341m is reflected in accounting books as €1,332m due to €9m of capitalized debt structuring costs that are capitalized during the lifetime of each of the facilities
© Siemens Gamesa Renewable Energy 18Outlook & Guidance © Siemens Gamesa Renewable Energy
Q1Q2Q3Q4                         2021 .................................................................................................................
                                                                                                                                                          Outlook & Guidance

Strong potential of wind energy confirmed. SGRE placed to benefit from growth drivers

        Annual installations ON and OF (GW)                                                           Onshore + Offshore projections (GW)3

                              +364%                                                                                 CAGR 19-25e: +5%
                                                 280

                                                                                     63           78          80          73            72           76              86
                                                                                                 71          69
                                                                                                                         63                         64             65
                                                                                                                                       61
                                                                                    56

                                145                                                              41          35
                                                                                                                         37                         41             42
                                                                                    33                                                 39

                                                                                                                                                                          21
               60
                                                                                                             34                              11            12              8
                                                                                                 30                11    26    10
                                                                                    23  6             7                                22           23     5       23
                                                                                                                 8              5             5
                                                                                          2            4                                                                  13
                                                                                       4             3           3              5             6            6
              2019          2030 WEO         2030 WEO                                2019         2020e      2021e       2022e         2023e       2024e           2025e
          installations     Sust. Dev.2      NZE20502
            GWEC1                                                                             ON Emerging     ON Developed                  OF emerging         OF developed

                             Increased Offshore commitments throughout all markets with annual installations moving above 20 GW 3 by 2025

1)   GWEC: Global Wind Energy Council
2)   International Energy Agency (World Energy Outlook 2020)
3)   Wood Mackenzie: Global Wind Power Market Outlook Update: Q4 2020
© Siemens Gamesa Renewable Energy                                              20
Q1Q2Q3Q4 2021 .................................................................................................................
Outlook & Guidance
European Union fostering green transition through recovery programs such as Next Generation EU
NGEU Fund Breakdown (€bn)
Total NGEU: €750bn
.......................................
Budget
front- Loans The European Union launched in July 2020 the Next Generation
loading 78 EU fund of €750bn to drive COVID-19 recovery
10% 360
390
673 48%
52% ▪ Member States preparing National Recovery & Resilience Plans
90% including a minimum of 37% of expenditure “related to climate”
Recovery &
▪ Next Generation EU fund means a great opportunity for renewable
Resilience
Facility
Grants1
... energy industry development, boosting investment in the sector
▪ Wind energy industry, key pillar for green transition and renewable
Most subsidized countries – Grants2 (€bn) energy, as one of the benefited markets
76.7
70.0
SGRE playing an active role along with key stakeholders in the
value chain and fostering projects that support energy
40.9
transition
26.6 25.8
18.3 16.2 14.8
Germany
Italy
Portugal
Greece
Poland
Romania
Spain
France
1) Grants including Invest EU (€5.6bn) guarantees
2) Subject to further modifications. Includes Recovery and Resilience Facility, React-EU (only includes €37.5bn allocation of 2021) and Just Transition Fund – 2018 prices (source: EU commission)
© Siemens Gamesa Renewable Energy 21Q1Q2Q3Q4 2021 .................................................................................................................
Outlook & Guidance
Siemens Gamesa and Siemens Energy to unlock a new era of Offshore green hydrogen production
......................................
SGRE and SEn1 to launch development projects leading to an
integrated Offshore wind-to-hydrogen solution
▪ Both parties intend to invest a total sum of approximately €120m (€80m
SGRE + €40m SEn1) into their respective projects over five years
▪ Projects are first major step to develop an industrial-scale system
... coupling the SG 14-222 DD with a newly developed next generation
electrolyzer (demonstrator by 2025/2026)
▪ Developments will enable decarbonization of hard-to-abate sectors such
as transport and heavy industry
▪ Implementation within the framework of the ideas competition "Hydrogen
Republic of Germany" of the Federal Ministry of Education and Research
1) SEn: Siemens Energy
© Siemens Gamesa Renewable Energy 22Q1Q2Q3Q4 2021 .................................................................................................................
Outlook & Guidance
Solid Q1 21 financial performance; FY21 guidance confirmed
Guidance1 Q1 21 FY21 E
Revenue (in €m)
2,295 10,200 - 11,200
EBIT margin pre PPA and I&R costs (in %) 5.3% 3.0% - 5.0%
1) This outlook excludes charges related to legal and regulatory matters and it is given at constant FX rates. It does not include any impact from a potential lockdown of manufacturing activities or severe disruptions to the supply chain due to
COVID-19 developments
© Siemens Gamesa Renewable Energy 23Thank you! © Siemens Gamesa Renewable Energy
You can also read