2018 SELLSIDE MEETING - EXXONMOBIL
←
→
Page content transcription
If your browser does not render page correctly, please read the page content below
2018
SellSide meeting

Irving, September 17

This presentation is an amalgamation of our public Outlook for Energy, released on February 2, 2018 and our public March 7, 2018 Analyst Meeting presentation. Each of these
presentations is available separately on our website. All forward-looking statements included in this presentation and the assumptions made in developing these forward-looking
statements speak only as of the date of their original presentation unless specifically noted herein. Inclusion of such forward-looking statements in this material does not represent
an update or confirmation of such statements or their assumptions as of any later date.

Cautionary statement
Forward-Looking Statements. Outlooks, projections, estimates, goals, descriptions of business plans, market expectations and other statements
of future events or conditions in this presentation or the subsequent discussion period are forward-looking statements. Actual future results,
including future earnings, cash flows, returns, margins, and other areas of financial and operating performance; demand growth and energy mix;
ExxonMobil’s production growth, volumes, development and mix; the amount and mix of capital expenditures; future distributions; proved and
other reserves; reserve and resource additions and recoveries; asset carrying values and future impairments; project plans, completion dates,
timing, costs, and capacities; efficiency gains; operating costs and cost savings; integration benefits; product sales and mix; production rates and
capacities; and the impact of technology could differ materially due to a number of factors. These include changes in oil or gas demand, supply,
prices or other market conditions affecting the oil, gas, petroleum and petrochemical industries; reservoir performance and revisions; timely
completion and cost of ExxonMobil and third-party exploration and development projects; regional differences in product concentration and
demand; war and other political or security disturbances; changes in law, taxes or other government regulation, including environmental
regulations, taxes, and political sanctions; the outcome of commercial negotiations; the actions of competitors and customers; unexpected
technological developments; general economic conditions, including the occurrence and duration of economic recessions; unforeseen technical
difficulties; and other factors discussed here, in Item 1A. Risk Factors in our Form 10-K for the year ended December 31, 2017 and under the
heading "Factors Affecting Future Results" in the Investors section of our website at www.exxonmobil.com. The forward-looking statements in
this presentation are based on good faith market projections as of Feb 2, 2018 included in our Energy Outlook or on management’s good faith
plans and objectives as of the March 7, 2018 date of the Analyst Meeting presentation unless specifically noted herein. Inclusion of such forward-
looking statements in this material does not represent an update or confirmation of such statements as of any later date. We assume no duty to
update these statements as of any future date and neither future distribution of this material nor the continued availability of this material in
archive form on our website should be deemed to constitute an update or re-affirmation of these figures as of any future date. Any future update
of these figures will be provided only through a public disclosure indicating that fact.

Supplemental Information. See the Supplemental Information included on pages 21 through 24 of this presentation for additional important
information concerning definitions and assumptions regarding the forward-looking statements included in this presentation, including
reconciliations and other information required by Regulation G with respect to non-GAAP measures used in this presentation including earnings
excluding effects of tax reform and impairments; and definitions and additional information on other terms used including returns and resources.

                                                                        2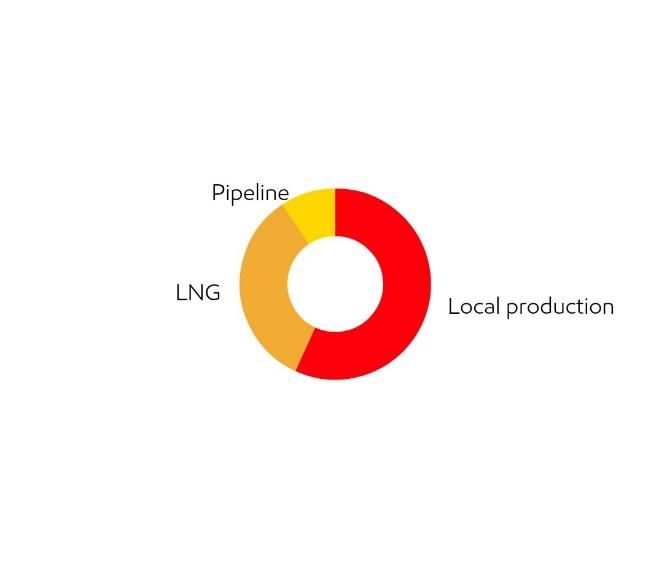
Agenda
• 13:00h – 13:45h   Lunch                Neil A. Hansen,
                                         Vice President Investor Relations & Secretary

• 13:45h – 14:45h   Energy Outlook       Theodore J. Wojnar,
                                         Vice President Corporate Strategic Planning

• 14:45h – 15:00h   Break

• 15:00h – 16:30h   Q&A                  Jack P. Williams,
                                         Senior Vice President ExxonMobil Corporation

                                     3
Outlook for Energy: A View to 2040
The Outlook for Energy includes Exxon Mobil Corporation’s internal estimates and forecasts of energy demand,
supply, and trends through 2040 based upon internal data and analyses as well as publicly available information from
external sources including the International Energy Agency. Work on the report was conducted throughout
T. J. Wojnar
2017. This presentation includes forward looking statements. Actual future conditions and results (including energy
demand, energy supply, the relative mix of energy across sources, economic sectors and geographic regions,
imports and exports of energy) could differ materially due to changes in economic conditions, technology, the
Vice President Corporate Strategic Planning
development of new supply sources, political events, demographic changes, and other factors discussed herein and
under the heading “Factors Affecting Future Results” in the Investors section of our website at
www.exxonmobil.com. This material is not to be used or reproduced without the permission of Exxon Mobil
Corporation. All rights reserved.
2018 Investor information 4Global energy demand likely to rise ~25% through 2040
Global Energy Demand by Type Highlights
MBDOE
• Population & prosperity underpin energy
demand growth, led by non-OECD
• Energy efficiency & de-carbonization trends
accelerate
Renewables
Nuclear
• Technology & policies affect competitive
landscape
Coal
• Oil demand driven by transportation &
chemicals
Gas
• Gas demand led by electricity & industrial needs
• Unconventionals drive supply growth
Oil
• Greatest uncertainty… step-changes in policies,
technology, or consumer preferences
ExxonMobil 2018 Outlook for Energy
5Liquids demand reflects expanding prosperity & efficiency
Liquids demand by sector Liquids demand by product
MBDOE MBDOE
120 Lubes
Asphalt
Power /
Res/Comm
Gas Liquids
100
Other Industrial
Naphtha
Chemicals
80 Kero/Jet
60 Commercial
Transportation Distillate
40
Gasoline
20 Light Duty
Fuel Oil
Other Oil
0
2000 2020 2040
ExxonMobil 2018 Outlook for Energy
6Hypothetical electric vehicle sensitivity
Liquids demand by sector Energy-related CO2 emissions
MBDOE Billion tonnes
Light duty Outlook
transportation Global emissions Sensitivity
Sensitivity liquids
demand
Commercial
transportation
Power generation
Chemicals
Other industrial Light duty transportation
Power generation /
Residential / Commercial
ExxonMobil 2018 Outlook for Energy
7Liquids demand & supply warrant investment
Global liquids supply/demand Global supply by type
MBDOE MBDOE
Biofuels
Other Liquids
120
Liquids supply
growth to meet
growing demand NGLs
Tight Oil
80
Oil Sands
Estimated Deepwater
natural Additional liquids
decline in the to keep supply New Conventional
absence of constant Crude and Condensate
further Development
investment
40
Developed Conventional
Crude & Condensate
0
2000 2020 2040
Excludes biofuels
ExxonMobil 2018 Outlook for Energy
8Liquids opportunities and challenges
Liquids Demand by Sector
Liquid Supplies
Light Duty Transport
• ~$10 trillion upstream oil investment needed to 2040 (IEA)
Commercial Transport
Chemicals • Tight oil boosts available supplies
Remaining Industry
Res/Comm / Power
Light Duty Transport
Other • Personal mobility rises but energy demand flattens with
• Policies increasingly target efficiency higher efficiency & more electric vehicles
gains & lower emissions 2040 • Need to adjust to changing product needs
2016
Chemicals ~20% growth
2016-2040
• Demand reflects growing prosperity
• Liquids serve as primary feedstock
Commercial Transport
• Scalable alternatives remain limited
• Policies target efficiency gains & alternative fuels
~45% share (e.g. biofuels, electrification)
~55% share
ExxonMobil 2018 Outlook for Energy
9Abundant gas supports demand growth
Global gas supplies Gas demand by region
BCFD BCFD
720 Share of growth,
2016-2040
600
Rest of World
480 Latin America NonOECD
Asia Pacific
North America
Africa/Middle East
360 Unconventional
AP NonOECD
240 Russia/Caspian
Europe NonOECD
Conventional
Other OECD
120
USA
0
2000 2020 2040
ExxonMobil 2018 Outlook for Energy
10Gas opportunities and challenges
LNG
Gas Demand by Sector
Electricity Generation
• Key to unlocking vast AP demand potential
Industrial • Affordability & energy security key considerations
Transportation
Residential / Commercial Residential / Commercial
• Resilient/seasonal needs support growth
Transportation 2040
• Strong Asia demand aids air quality
2016 Electricity Generation
• Marine growth to reduce emissions
• Major growth segment through 2040
• Gas advantaged as:
+38% growth • Lower carbon baseload option
2016-2040
Industrial • Back-up support of wind/solar
• Important growth area through 2040 • Shift toward lower-emission options aided by
policies, technologies
• Gas provides:
• Lower emissions option
• Feedstock/fuel for chemicals
• Shift toward lower-emission options
aided by policies, technologies
ExxonMobil 2018 Outlook for Energy
11Energy evolution reflects technology, scale & complexity
Global primary energy demand Outlook to 2040:
Quadrillion BTUs
• Energy powers expanding prosperity
• Non-OECD nations drive growth
Other Renewables
Nuclear • Efficiency & decarbonization trends improve
Hydro
• Wind+solar electricity expands by ~400%
Gas
• Oil & natural gas maintain ~55% share,
supporting mobility, modern products, and a
wide range of other needs
Oil • Oil & natural gas investment needs total
~$21 trillion (IEA New Policies Scenario)
• Tight oil, deepwater, oil sands in total
Coal increase >100%
• Unconventional gas up ~100%
Biomass
• Demand transitions in key sectors lead to
shift in global oil product mix
Source: Smil, Energy Transitions (1900-1960)
ExxonMobil 2018 Outlook for Energy
12Integration maximizes value from growing volumes
Upstream Volumes Refining Capacity: 4.9 MBOED (#1 IOC)
MBDOE • Downstream scale, logistics and
trading capture opportunities
Major Liquids: 2.3 MBOED (#1 IOC)
projects Gas: 1.7 MBOED
• Presence in all value chains directs
U.S. tight oil
investments to highest value
Energy
Base & work Market
programs • Integration enables lower cost of
Crude Logistics & supply
Exploration &
movement Trading
Production
• Improves returns by optimizing
response to market shifts
Chemicals Sales: 25 MTA (#1 IOC)
Source: ExxonMobil 2017 Financial & Operating Review.
Wood Mackenzie Corporate Benchmarking Tool (02 2018). IHS Markit.
Natural gas volumes converted into oil equivalent using 6,000 scf per barrel.
13Integration maximizes value from growing volumes
Upstream Volumes Refining Capacity: 4.9 MBOED (#1 IOC) ExxonMobil Downstream product shift
2025 vs. 2017
MBDOE
%
Major Liquids: 2.3 MBOED (#1 IOC)
projects Gas: 1.7 MBOED
U.S. tight oil
Energy
Base & work Market
programs
Crude Logistics &
Exploration &
movement Trading
Production
Chemicals Sales: 25 MTA (#1 IOC)
Source: ExxonMobil 2017 Financial & Operating Review.
Wood Mackenzie Corporate Benchmarking Tool (02 2018). IHS Markit.
Natural gas volumes converted into oil equivalent using 6,000 scf per barrel.
14Technology & integration deliver unique advantage
• Capturing and producing high-quality resources
• Choosing best feedstock molecules for fuels,
Conversion World-class fuel lubricants and chemicals
and lubes brands
~80% of refining capacity integrated • Proprietary catalysts and processes convert
with lubricants and chemical plants low-cost feedstocks to high-value products
Seeing better Understanding
than Others Every Molecule • Integration ensures every molecule is optimized
to the highest end value
• Growing sales of high-performance products
Conversion High-performance Polymers supported by world-class brands
and Intermediates
152018 SellSide meeting Irving, September 17 This presentation is an amalgamation of our public Outlook for Energy, released on February 2, 2018 and our public March 7, 2018 Analyst Meeting presentation. Each of these presentations is available separately on our website. All forward-looking statements included in this presentation and the assumptions made in developing these forward-looking statements speak only as of the date of their original presentation unless specifically noted herein. Inclusion of such forward-looking statements in this material does not represent an update or confirmation of such statements or their assumptions as of any later date.
Upstream next-generation assets drive growth

                                 • Our strongest portfolio of opportunities since the merger
    Deep water
    Guyana, Brazil               • Attractive across range of prices

                                 • All producing by 2025
    Unconventional
                                                 Upstream Earnings, Billion USD
    U.S. tight oil
                                                20

    LNG                                         10
    PNG, Mozambique

                                                  0
                                                               2017                      2020                      2025
                                                  Excludes one-time impact of U.S. tax reform and impairments in 2017; at $60/bbl flat real

          2018 Analyst Meeting        17
Downstream product shifts improving profitability
ExxonMobil Downstream product shift
2025 vs. 2017 • Upgrading 200 KBD of fuel oil to higher-value products
%
50
• Growing Group II basestocks and distillate >20%
• $9B invested in 6 major refining projects through 2025
0 Downstream Earnings, Billion USD
$47/bbl $64/bbl $88/bbl $65/bbl $98/bbl 2017 10
Prices1
5
-50
Fuel oil Gasoline Chemical Diesel / Lube
Feedstock Jet Basestock 0
1Platts, Argus, and IHS
2017 2020 2025
Excludes one-time impact of U.S. tax reform and impairments in 2017; at 2017 margins
18Chemical growth from advantaged investments
Chemical capacity growth
MTA • Delivering 30% global sales growth by 2025
35
• > $20B investments underway and planned; >15% return
Other
Asia • 7 of 13 new facilities operating by YE 2018
U.S.
Chemical Earnings, Billion USD
Gulf
Coast 10
New
investments
5
20
2016 2025
0
2017 2020 2025
Excludes one-time impact of U.S. tax reform in 2017; at 2017 margins
19Supplemental information
20Supplemental information
Important information and assumptions regarding certain forward-looking statements. Forward-looking statements contained in this
presentation regarding future volumes, future earnings, project returns, are not forecasts of actual future results. These figures are provided to
help quantify the targeted future results and goals of currently-contemplated management plans and initiatives including new project
investments, plans to grow profitable Upstream production volumes, plans to increase sales in our Downstream and Chemical segments and to
shift our Downstream product mix toward higher-value products, continued high-grading of ExxonMobil’s portfolio through our ongoing asset
management program, initiatives to improve efficiencies and reduce costs, and other efforts within management’s control to impact future results
as discussed in this presentation. These figures are intended to quantify for illustrative purposes management’s targets for these efforts over the
time periods shown, calculated on a basis consistent with our internal modelling assumptions for factors such as working capital and capital
structure, as well as factors management does not control, such as interest and exchange rates.
For all price point comparisons, unless otherwise indicated, crude prices and product margins are on a flat real basis. For 2017 crude oil prices we
used $53/bbl Brent. Where price is not stated, we assume a $60/bbl Brent for future periods. These prices are not intended to reflect
management’s forecast for future prices or the prices we use for internal planning purposes. For natural gas, except as otherwise explicitly noted
in this presentation, we have used management’s internal planning prices for the relevant natural gas markets. We have assumed that
Downstream product margins remain at 2017 levels. We have assumed Chemical margins reflect gas and market conditions. At $60/bbl Brent,
we have assumed Chemical margins reflect 2017 margins. We have also assumed that other factors such as laws and regulations, including tax
and environmental laws, and fiscal regimes remain consistent with current conditions for the relevant periods and that asset sales are consistent
with historical levels.
See the Cautionary Statement at the front of this presentation for additional information regarding forward-looking statements.
21Supplemental information
Non-GAAP and other measures. In this presentation, earnings excluding effects of tax reform and impairments, are non-GAAP measures. With
respect to historical periods, reconciliation information is included with the relevant definition below or as noted below in the Frequently Used
Terms available on the Investors page of our website at www.exxonmobil.com. For future periods, we are unable to provide a reconciliation of
forward-looking non-GAAP measures to the most comparable GAAP financial measures because the information needed to reconcile these
measures is dependent on future events, many of which are outside management’s control as described above. Additionally, estimating such
GAAP measures to provide a meaningful reconciliation consistent with our accounting policies for future periods is extremely difficult and
requires a level of precision that is unavailable for these future periods and cannot be accomplished without unreasonable effort. Forward-
looking non-GAAP measures are estimated in a manner consistent with the relevant definitions and assumptions noted above.
Definitions and non-GAAP financial measure reconciliations
Earnings excluding effects of tax reform and impairments. The table below reconciles 2017 earnings excluding effects of tax reform and
impairments used in this presentation to 2017 U.S. GAAP earnings:
Corporate and Corporate
(millions of dollars) Upstream Downstream Chemical Financing Total
Earnings (U.S. GAAP) 13,355 5,597 4,518 (3,760) 19,710
U.S. tax reform 7,122 618 335 (2,133) 5,942
Impairments (1,504) (17) - - (1,521)
Earnings excluding U.S. tax reform and impairments 7,737 4,996 4,183 (1,627) 15,289
22Supplemental information
Project. The term “project” as used in this presentation can refer to a variety of different activities and does not necessarily have the same
meaning as in any government payment transparency reports.
Resources, resource base, recoverable resources. These and similar terms include quantities of oil and gas that are not yet classified as proved
reserves under SEC definitions but that are expected to be moved into the proved reserves category and produced in the future. Proved reserve
figures are determined in accordance with SEC definitions in effect at the end of each applicable year. The term “resource base” or the terms
“design / develop” or “evaluating” as used to describe resources are not intended to correspond to SEC definitions such as “probable” or
“possible” reserves. The term “in-place” refers to those quantities of oil and gas estimated to be contained in known accumulations and includes
recoverable and unrecoverable amounts. “Net resource potential” amounts are not currently included in the resource base.
Returns, investment returns, project returns. Unless referring specifically to ROCE, references to returns, investment returns, project returns, and
similar terms mean discounted cash flow returns based on current company estimates. Future investment returns exclude prior exploration and
acquisition costs.
Other information
All references to production rates and project capacity are on a gross basis, unless otherwise noted. References to resource size are on a net basis,
unless otherwise noted.
Billion cubic feet per day (BCFD): A standard unit used to define volumetric rates of natural gas. One billion cubic feet per day of natural gas is
enough to meet about 2 percent of the natural gas used in homes around the world. Six billion cubic feet per day of natural gas is equivalent to
about 1 million oil-equivalent barrels per day.
23Supplemental information
British thermal unit (BTU’s): A BTU is a standard unit of energy that can be uised to measure any type of energy source. The energy content of one
gallon of gasoline is about 120,000 BTUs. “Quad” refers to quadrillion (10 15) BTUs. In the 2018 Outlook for Energy , energy content in BTUs for
each oil product (e.g. gasoline, diesel, LPG, etc.) is based on its specific energy density.
Liquefied natural gas (LNG): Natural gas (predominantly methane) that has been super-chilled for conversion to liquid form for ease of transport.
Million-oil equivalent barrels per day (MBDOE): A standardized unit of measure for different types of energy sources (natural gas, coal, etc.) based
on energy content relative to a typical barrel of oil. One million oil-equivalent barrels per day is enough energy to fuel about 4 percent of the light-
duty vehicles on the world’s roads today. Reporting for all energy types in MBDOE is done on an oil-equivalent basis, with the exception of oil
products, which are reported in physical barrels.
Natural Gas Liquids (NGL): A liquid fuel produced chiefly in association with natural gas. NGLs are components of natural gas that are separated
from the gaseous state into liquid during natural gas processing. Ethane, propane, butane, isobutene and pentane are NGLs.
24You can also read