IRP Public Advisory Meeting #2 - Workshop with IRP Stakeholders July 18, 2014 - IPL
←
→
Page content transcription
If your browser does not render page correctly, please read the page content below
IRP Public Advisory
  Meeting #2

Workshop with IRP Stakeholders

         July 18, 2014
          Barnes & Thornburg
         11 South Meridian St.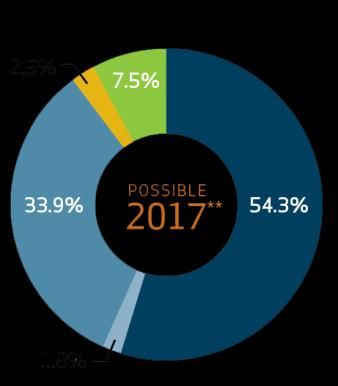
Welcome and
Introductions
Meeting Agenda
and Guidelines
Presented by Marty Rozelle, PhD, Meeting Facilitator

Meeting Objectives

    • Continue conversation on the Integrated Resource
      Plan, including providing new information and
      incorporating stakeholder feedback

    • Gather comments and feedback – specifically on
      the four Ventyx Scenario results presented

    • Continue relationship built on trust and respect

4
IRP Public Advisory Meeting #2
Agenda Topics
• Summary of IRP Public Advisory Meeting #1
• Demand Side Management Update
• Environmental Update
• Overview of Stakeholder Comments and Questions
• Incorporating Stakeholder Input
• Presentation of Ventyx Scenario Results
• Stakeholder Feedback and Comments
5Meeting Guidelines
• Time for clarifying questions at end of each presentation
• Parking lot for items to be addressed later
• The phone line will be muted. During the allotted question
time frames, you may press *6 to un-mute yourself or type a
question through the web-chat function.
• To inquire about confidential information please contact
Teresa Nyhart with Barnes & Thornburg, LLP at
teresa.nyhart@btlaw.com
6Written Comments and Feedback
• Please email comments and questions to
IPL.IRP@aes.com
• All comments and questions received by August 1
will have responses posted on the IPL IRP website
by August 15
7Questions?
Summary of IRP Public
Advisory Meeting #1
Presented by Herman Schkabla, Director of Resource Planning
IRP Public Advisory Meeting #1

                 May 16, 2014 --- Agenda Topics

     • Introduction to IPL and Integrated Resource
       Planning Process
     • Energy and Peak Forecasts
     • Demand Side Management: Energy Efficiency and
       Demand Response
     • Planning Reserve Margin
     • Generation Overview
     • Environmental Overview
     • Distributed Energy Resources
     • Proposed Modeling Assumptions

10
Company Profile
• 470,000 customers*
• 1,400 employees*
• 528 sq. miles territory
• 144 substations
Harding Street Station, Georgetown
Station, Solar REP Projects - 1,322 MW**
Eagle Valley Generating Station - 263 MW**
Petersburg Generating
Station – 1,760 MW**
Hoosier Wind Park PPA – 100 MW**
Lakefield Wind Park PPA – 201 MW**
(In Minnesota – Not pictured)
*approximate numbers
**nameplate capacity
11IRP Process Overview
Develop IPL’s Total Determine IPL’s Identify Key Risk
Supply Resource New Supply Parameters
Needs Resource Needs
Identify and Identify IPL’s
Evaluate Resource
Screen Resource Reference and
Expansion Plans
Technologies Short Term Action
Plans
12The Forecast : Energy
Average Energy
growth rates (2014-23):
• Residential: 1.2%
• SCI: 0.6%
• LCI: 0.6%
• Total: 0.8%
* The forecast does not reflect company-sponsored DSM savings.
13The Forecast : Peak
Peak (base forecast*)
3500
3000 Average Peak
2500 growth rate (2014-23):
0.9%
2000
MWs
1500
1000
500
0
2014 2015 2016 2017 2018 2019 2020 2021 2022 2023
Peak
* The forecast does not reflect company-sponsored DSM savings.
14DSM Integration into IPL’s
Planning and Portfolio
• IPL has offered DSM programs on essentially a continuous
basis since 1993
• IPL expects to continue to provide cost effective DSM
programs to help our customers reduce their energy use and
better manage their energy bills
• IPL reflects an ongoing level of end-use Energy Efficiency (ex.
home appliance improvements) in preparation of our base
case load forecast
• The 2015-2017 DSM Action Plan is being finalized
• The 2018 and beyond DSM forecast will be developed with
the support of EnerNOC
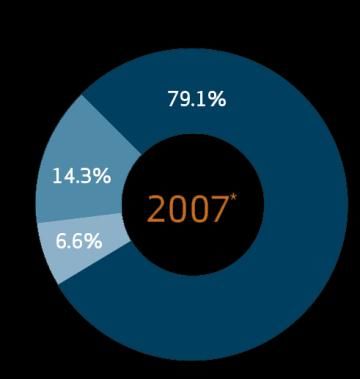
15Adapting our Generation Portfolio to
Respond to EPA Rules and Market Dynamics
Anticipated
*Resources based on maximum summer
rated capacity
**Includes long-term PPAs & anticipated
Rate REP contracts; plans subject to
Commission approval
16Environmental Regulations
• Current Environmental Regulations/Environmental Projects
o Mercury and Air Toxics Standard (MATS)
o NPDES Water Discharge Permits
• Future Environmental Regulations
o Coal Combustion Residuals (CCR)
o 316(b) – Cooling water intake structures
o Greenhouse Gas (GHG) New Source Performance
Standards (NSPS)
o National Ambient Air Quality Standards (NAAQS)
o Clean Air Interstate Rule (CAIR) Replacement Rule
NPDES= National Pollutant Discharge Elimination System
17Distributed Generation
• Distributed generation can be difficult to
implement on a large scale
• Solar has the best opportunity for growth in the
IPL service territory but is currently challenging
as a least cost resource
• Actively monitoring trends in Distributed
Generation and Distributed Energy Resources
18Ventyx’s Agenda
Introduction to North American Power Reference Case
Load and Resources
Natural Gas
Coal Forecast
Emissions Market
Renewables
Scenarios
Proposed IPL Modeling Assumptions
Natural Gas Prices
Market Power Prices
Carbon Policy
Modeling
| ©2012 Ventyx, an ABB company | 19›Reference Case Scenario Descriptions –
Modeling results were not presented at the May 16, 2014 meeting
Base Gas Price
Base Reference Case assumptions
No CO2 emissions cap
Low gas price
Ventyx subjective view of 10th percentile of probability distribution
Corresponds to production costs for best shale plays
High gas price
Ventyx subjective view of 90th percentile of probability distribution
Corresponds to limited shale supply scenario
Federal environmental legislation
CO2 emissions cap 2020 start, 80% below 2005 levels by 2050
RPS begins in 2020 and later target is 12% of retail sales by utilities with
load greater than 4 Terawatt hours (TWh)
| ©2012 Ventyx, an ABB company | 20Questions?
Demand Side
Management Update
Presented by Jake Allen, DSM Program Development Manager
Recent Developments

     • IPL has made a filing for approval of a DSM Plan
       for 2015/2016 in Cause No. 44497

     • Testimony filed in Cause No. 44441 regarding large
       customer’s ability to opt-out of DSM
          o First window for opt-out (July 1, 2014) has
             closed

     • Numerous comments on the IURC General
       Administrative Order have been made, providing
       recommendations for future DSM in Indiana

23
2015-2016 DSM Plan Filed -
Cause No. 44497
• Cause No. 44497 seeks Commission approval of a 2 Year Plan
(2015-2016); however, a 3 Year Action Plan (2015-2017) was
included in the prepared filing
• Petition filed on May 30, 2014
• Plan includes 13 DSM Programs (9 Residential; 4 Business)
• Target EE Savings approx. 1.2% of sales (total sales before large
customer opt-out)
• Expect to continue collaboration with Citizens Gas
24IPL’s Proposed DSM Programs -
Cause No. 44497
Segment 2015/2016 Proposed Programs Program Description
RES Lighting Prescriptive lighting buy down
Audit with direct install measures including air sealing
RES Income Qualified Weatherization
and insulation
Walk through assessment with direct install measures
RES Home Energy Assessment
and energy efficient recommendations
RES School Education – Kits Energy efficient kits and education to eligible students
Direct install measures delivered in multifamily housing
RES Multifamily
units
RES Online Energy Assessment Online assessment with kit delivery as fulfillment
Recycling of inefficient refrigerators, freezers, and
RES Appliance Recycling
window AC units
RES Peer Comparison Home energy reports
RES Air Conditioning Load Management Direct load control
BUS Prescriptive Rebates Prescriptive rebates for qualifying measures
BUS Custom Rebates Custom rebates for qualifying measures
Walk through assessment with direct install measures
BUS Small Business Direct Install
and energy efficient recommendations
BUS Air Conditioning Load Management Direct Load Control
25Proposal for Current Offerings -
RESIDENTIAL
Current Residential Programs 2015/2016 Proposal
Home Energy Assessment (was Energizing Indiana
IPL will begin to administer
Program)
Income Qualified Weatherization (was EI Program) IPL will begin to administer
Residential Lighting (was EI Program) IPL will begin to administer
Energy Efficient Schools – Education (was EI Program) IPL will begin to administer
Residential New Construction Program not continued
Online Energy Assessment w/ Kit IPL will continue to administer
Multifamily Direct Install IPL will continue to administer
Appliance Recycling IPL will continue to administer
Peer Comparison Report IPL will continue to administer
CoolCents® Residential ACLM IPL will continue to administer
Residential Renewables Program not continued
26Proposal for Current Offerings -
BUSINESS
Current Business Programs 2015/2016 Proposal
Program discontinued; Schools will continue to have
Energy Efficient Schools - Audit & DI (was EI Program)
EE opportunities
IPL will administer moving forward; measures
C&I Prescriptive – Core (was EI Program)
merged with IPL Business Energy Incentives
C&I Renewables Program not continued
CoolCents® C&I ACLM IPL will continue to administer
C&I Renewables Multifamily Direct Install IPL will continue to administer
Business Energy Incentive Program – IPL will continue to administer. Combined with
Prescriptive/Custom Prescriptive Measures from EI Core
27DSM Energy Savings
Annual DSM Program Energy Savings
180,000
160,000
140,000
120,000
100,000
MWhs
80,000
60,000
40,000
20,000
-
2010 2011 2012 2013 2014 2015 2016 2017
Note: 2014 is forecasted. 2015-2017 is as filed in Cause No. 44497.
28DSM Spending
Annual DSM Program Expenditures
$35,000
$30,000
$25,000
$20,000
$15,000
$10,000
$5,000
$-
2010 2011 2012 2013 2014 2015 2016 2017
Note: 2014 is forecasted. 2015-2017 is as filed in Cause No. 44497.
29Other DSM Considerations
• Update on Large Commercial & Industrial Customer
opt-out of participation in IPL DSM Programs
o First opt-out opportunity was July 1, 2014
o Next opt-out opportunity is January 1, 2015
o 41 IPL customers opted out
o These 41 customers had 231 services
o Annual sales to these customers are about 1,800 GWH or
about 13% of total IPL sales
• Working with Applied Energy Group (formerly known as EnerNOC)
on 2018-2034 DSM potential
• EPA Clean Power Plan
o Proposed rule issued June 2, 2014
30Other DSM Considerations
• Commission Report to Legislature
o Recommendations on future DSM
o Due not later than August 15, 2014 – pursuant to
SEA 340
o Review of recent DSM efforts in Indiana
• Procurement of Energy Service Providers
o For Program Delivery (2015-2016)
o Collaboration with Citizens Gas and Oversight
Board
31IPL Remains Committed to Providing
Cost Effective DSM to Our Customers
• In Cause No. 44497, IPL is requesting approval to spend
about the same amount as the current level for DSM, while
achieving…
• …About the same amount of annual savings in 2015/2016
as the current level for DSM
• IPL is retaining most of the existing programs and adding a
new program – Small Business Direct Install
32Questions?
Environmental Update
Presented by Angelique Oliger, Director of Environmental Policy
Environmental Updates

     •   316(b)
           o Final Rule Released May 19, 2014
           o Consistent with Proposed Rule

     •   Clean Power Plan
           o Proposed Rule Released June 2, 2014

35
Clean Power Plan
• EPA’s Clean Power Plan would reduce Carbon emissions from the
power sector nationwide by 30% by 2030 from 2005 levels
• State-specific rate-based (lbs CO2/MWhr) goals for carbon intensity
o 1,607 lb/MWh – 2020-2029 average
o 1,531 lb/MWh – 2030+
• Best System of Emission Reductions
o cost
o technical feasibility
o other factors
• States must develop plans to achieve these reductions
• State Plan or Multi-state Plan
36Timing
• 120 day comment period begins after publication in Federal
Register
• Four public hearings will be held
• Final Rule expected June 1, 2015
• State Plans due June 30, 2016 with potential for 1-2 year
extension
• Compliance with “interim goal” on average over the ten-
year period from 2020-2029
• Compliance with “final goal” in 2030 and thereafter
37EPA’s Building Blocks
• EPA based required reductions on "building blocks" which States
may incorporate into State Plans
o Heat Rate improvements at EGUs;
o Substituting generation from coal-fired EGUs with generation
from existing NGCCs;
o Substituting generation from coal-fired EGUs with generation
from renewables;
o Demand Side Energy Efficiency; and/or
• State may elect to use some or all of these measure to varying
degrees in their State regulations or they may use other measures
EGU-Electric Generating Unit
NGCC- Natural Gas Combined Cycle
38Potential Impacts
• Impacts will be heavily dependent upon State Plans and remain
largely uncertain at this time, but may include:
o Required heat rate improvements
o Decreased dispatch of coal-fired units
o Increased dispatch of renewables and existing NGCCs
o Additional demand side EE measures
• Eagle Valley CCGT is not subject to the Rule because
construction will commence after January 2014
39Questions?
Overview of
Stakeholder Comments
and Questions
Facilitated by Marty Rozelle, PhD
Explanations by IPL Team

                                    41
IPL’s Feedback Response Table
• IPL responded to 112 stakeholder comments and
questions
• All questions and responses were posted in IPL’s
Feedback Response Table on the IPL IRP
webpage on June 20
• Today, IPL will briefly review selected questions
and responses
42Energy and Demand Forecast
• 10 year forecast but 20 year plan?
• DSM assumptions in the forecast?
• Forecast consistent with industry-wide forecasts?
Please see the Feedback Response Table on IPL’s IRP webpage for all questions and answers.
43Demand Side Management
• How will IPL meet future DSM goals?
• Status of Applied Energy Group’s 2018 and
beyond DSM forecast?
Please see the Feedback Response Table on IPL’s IRP webpage for all questions and answers.
44Renewables/ Environmental
• Keep Renewable Energy Certificates (“REC”) in
Indiana?
• Combined heat and power opportunities?
• Many questions addressed the proposed EPA rule on
CO2. An update will be provided today.
Please see the Feedback Response Table on IPL’s IRP webpage for all questions and answers.
45IPL’s Modeling
• Define base case and reference case?
• Regional model vs. company specific model?
• Does IPL’s model compare the cost of running
generating units to the cost of purchasing or
selling energy on the market?
Please see the Feedback Response Table on IPL’s IRP webpage for all questions and answers.
46IPL’s Modeling (cont.)
• How are off system sales treated within the model?
• Retirement dates of all IPL plants?
• What would motivate an earlier retirement?
• Harding St 7 upgrades cost vs. Harding St 7
replacement generation costs?
Please see the Feedback Response Table on IPL’s IRP webpage for all questions and answers.
47Modeling Assumptions/ Inputs
• Many of the questions asked how DSM and CO2
will be treated in the model. An update on
both will be provided today.
• There were also detailed modeling questions that
can be addressed as we cover the initial modeling
results today
Please see the Feedback Response Table on IPL’s IRP webpage for all questions and answers.
48Questions?
Incorporating
Stakeholder Input
Presented by Herman Schkabla, Director of Resource Planning

                                                              50
Results from Public Advisory Meeting #1
Number of
Key Risk Factor
Responses
Amount and cost of energy generated by natural gas 4
Amount and cost of energy generated by coal 6
Amount and cost of energy generated by wind turbines 7
Amount and cost of energy generated by solar facilities 5
Amount and cost of energy generated by other renewable sources (biomass,
7
landfill gas, geothermal, etc.)
Amount and cost of consumer-initiated energy generation (“rooftop solar” /
10
net metering)
Level of federal “carbon tax” imposed on power plant emissions 11
Level of government environmental regulations for air and water quality 10
Level of consumer energy conservation through voluntary programs (energy
8
efficiency, etc.)
Load forecast 2
Cost of electricity delivered to the consumer ($ / megawatt hour) 5
Other Key Risk Factors Identified: (1) Level of energy conservation through
mandatory programs, (2) Cost of climate change resulting in weather calamities,
(3) Effects of water scarcity, (4) Health effects of emissions, (5) Industrial
customers dropping load through constructing own generation or co-generation
51Addressing Top Stakeholder Risk Factors
• Cost assumptions for wind turbines
o Reduced the Ventyx reference case cost
assumption for new wind resources by $200/KW
to reflect declining costs for wind generation
• Carbon/GHG Assumptions
o Included in the Ventyx environmental scenario
o Will incorporate the “EPA Clean Power Plan” into
the IPL base case scenario
52Addressing Top Stakeholder Risk Factors
• DSM/EE
o Will incorporate updated projections from Applied
Energy Group analysis
o Provide transparency on cost/benefit analysis
evaluated on a consistent basis with supply-side
options
o Ventyx Model is not the best tool for DSM
cost/benefit analysis
• Distributed Generation Impact
o Will reduce energy forecast to reflect increasing
level of customer dis gen (e.g. 2% by 2020, 4% by
2030)
53Retirement Timing of Remaining Coal Units
• IPL is conducting a detailed parallel assessment of
continued operation of its big 5 coal units
o Part of upcoming IURC regulatory filing to
develop a compliance plan for waste water
rules (NPDES)
o Unable to provide results at this time
• The NPDES compliance plan and supporting
analysis will be integrated into the final 2014 IRP
NPDES – National Pollutant Discharge Elimination System
54Questions?
Presentation of Ventyx
Scenario Results
Presented by Diane Crockett, Ventyx and
Herman Schkabla, Director of Resource Planning
Reference Case Scenario Descriptions
     •   Base Gas Price
          o Base Reference Case assumptions
          o No CO2 emissions cap
     •   Low gas price
          o Ventyx subjective view of 10th percentile of probability distribution
          o Corresponds to production costs for best shale plays
     •   High gas price
          o Ventyx subjective view of 90th percentile of probability distribution
          o Corresponds to limited shale supply scenario
     •   Federal environmental legislation
          o CO2 emissions cap 2020 start, 80% below 2005 levels by 2050
          o RPS begins in 2020 and later target is 12% of retail sales by utilities with
            load greater than 4 Terawatt hours (TWh)

57
Henry Hub Proposed Annual Gas Price Forecast
(Fall 2013 Reference Case $/MMBtu)
$/MMBtu
Base Low Gas High Gas Environmental
58Proposed Annual MISO-Indiana Market Prices
(7x24)(Fall 2013 Reference Case $/MWh)
$/MWh
Base Environmental High Gas Low Gas
59Proposed Carbon Prices ($/Ton)
$/Ton
Environmental
60Results - Expansion Plans
Unit
YEAR Base Environmental High Gas Low Gas Retirements
2015 Market 150 MW Market 150 MW Market 150 MW Market 150 MW
2016 Market 450 MW Market 450 MW Market 450 MW Market 450 MW
2017 EV CCGT 644 MW EV CCGT 644 MW EV CCGT 644 MW EV CCGT 644 MW
2018 -
2028
2029 Wind 50 MW
2030 Market 50 MW Wind 200 MW Market 50 MW Market 50 MW
HS ST5 100
CC 200 MW CC 200 MW CC 200 MW CC 200 MW MW HS ST6 100
2031 Market 50 MW Wind 200 MW Market 50 MW Market 50 MW MW
Wind 150MW
2032 Market 100 MW Market 50 MW Market 50 MW Market 100 MW
Wind 200 MW
CC 200 MW CC 200 MW
2033 Market 150 MW CC 400 MW Market 100 MW CC 400 MW Pete1 220 MW
Wind 50 MW
CC 400 MW CC 200 MW CC 400 MW CC 200 MW Market
2034 Market 150 MW Market 100 MW Market 100 MW 150 MW HS7 405 MW
61Wind/Solar Generation as Percent of Load
18%
15%
12%
9%
6%
3%
0%
2027 2028 2029 2030 2031 2032 2033 2034
Base Environmental High Gas Low Gas
62Generation Mix in 2034
Generation Mix in 2034
4500
4000
3500
3000
Capacity
2500
2000
1500
1000
500
0
Base Environmental High Gas Low Gas
Wind Solar Fuel Oil Gas Coal
63Reserve Margins
25%
20%
15%
10%
Shortfalls are met with
capacity purchases.
5%
0%
2014 2016 2018 2020 2022 2024 2026 2028 2030 2032 2034
-5%
Base Environmental High Gas Low Gas
64Present Value of Revenue Requirements
PVRR (2015-2034)
$16,000
$14,000
$12,516
$12,000
$ in millions
$9,295 $9,464 $8,967
$10,000
$8,000
$6,000
$4,000
$2,000
$0
Base Environmental High Gas Low Gas
65SO2 Emissions
45,000
40,000
35,000
30,000
25,000
Tons
20,000
15,000
10,000
5,000
0
Base Environmental High Gas Low Gas
66NOx Emissions
16,000
14,000
12,000
10,000
Tons
8,000
6,000
4,000
2,000
0
2016
2020
2024
2028
2032
2015
2017
2018
2019
2021
2022
2023
2025
2026
2027
2029
2030
2031
2033
2034
Base Environmental High Gas Low Gas
67CO2 Emissions
20,000,000
18,000,000
16,000,000
14,000,000
12,000,000
Tons
10,000,000
8,000,000
6,000,000
4,000,000
2,000,000
0 2022
2031
2015
2016
2017
2018
2019
2020
2021
2023
2024
2025
2026
2027
2028
2029
2030
2032
2033
2034
Base Environmental High Gas Low Gas
68Conclusions from IPL’s Initial Modeling
• IPL does not have a need for new capacity
resources for the next 15 years
o Eagle Valley CCGT in 2017
o Low load growth + DSM/EE
o Subject to change if NPDES evaluation
indicates earlier retirement of big 5 coal units
• Combined cycle is a preferred capacity resource
addition in all scenarios
• Wind is added in the environmental and high gas
scenarios
69Questions?
Stakeholder Feedback
and Comments
Facilitated by Marty Rozelle, PhD
Next Steps
Presented by Marty Rozelle, PhD

                                  72
Next Steps
Schedule for the Rest of 2014
July 25, 2014 IRP Public Advisory Meeting #2 Notes Posted to
IPL Website
August 1, 2014 Deadline to Submit Comments/Questions to
IPL.IRP@aes.com
August 15, 2014 IPL’s Response to Comments/Questions Will
be Posted to IPL Website
September 23, 2014 IRP Public Advisory Meeting #3 – Final modeling
results presented
October 31, 2014 Submit IRP Document to the IURC
Give us your feedback. IPL is here to listen to you.
73Thank You!
74You can also read