An Analysis of China's INDC - China Carbon Forum
←
→
Page content transcription
If your browser does not render page correctly, please read the page content below
An Analysis of China’s INDC
Fu Sha, Zou Ji, Liu Linwei
China National Center for Climate Change Strategy and International Cooperation
(NCSC)
Translated by China Carbon Forum
On 30 June 2015, the Chinese government submitted its Intended Nationally
Determined Contribution (INDC), detailing its commitment to climate change
mitigation and adaptation for the post-2020 period. Highlights of the INDC include
specific goals such as:
To achieve peak carbon dioxide emissions by approximately 2030, or sooner
as best efforts allow;
To lower carbon dioxide emissions per unit of GDP by 60% to 65% from 2005
levels;
To increase the share of non-fossil fuels in the primary energy mix to
approximately 20%;
To increase the volume of forest stock by approximately 4.5 billion cubic
meters over 2005 levels; and
Continue to proactively adapt to climate change through: enhanced
mechanism- and capacity-building; the effective management of climate
change risks in sectors such as agriculture, forestry, and water resources and
in regions including urban, coastal, and ecologically vulnerable areas;
improved early warning and emergency response systems and disaster
prevention and mitigation mechanisms.
This article offers an analysis of China’s INDC in terms of its basic assumptions and
considerations, the ambition and fairness of the intended contributions, and the
obstacles and challenges facing China in achieving these goals.
1. Basic Assumptions and Considerations
The recent IPCC Fifth Assessment Report further confirmed the imminence of
climate change based on science and observed facts. The international community is
faced with a serious challenge in addressing climate change and achieving its target of
capping the increase in the average global temperature at 2°C. Low-carbondevelopment has emerged as a mainstream trend of development worldwide, and is
indeed a necessary condition for achieving sustainable development. In this context,
the INDCs proposed by each country should be motivated by an interest in containing
the risks of climate change and actualizing equitable opportunities to achieve
sustainable, low-carbon development.
Even though China has become the largest carbon emitter and the second-largest
economy in the world, its main development indicators and the ongoing bifurcation of
rural and urban economic structures demonstrate the fact that China is still a
developing country. This implies significant differences between China and developed
countries in terms of their respective stages of development, development needs,
historical responsibilities, and over capacity. China’s foremost strategic priorities
continues to focus on poverty alleviation, increasing incomes, bolstering social security,
expanding coverage of public services (including infrastructure), and generally raising
the standard of living. Meanwhile, China's traditional input-heavy growth model is no
longer sustainable. Constrained by limited resources and environmental pressures,
China risks falling into the “middle-income trap.” China must therefore seek an
innovative new path of development and upgrade its growth model to a “new normal”:
shifting the drivers of growth from the quantity of input to the efficiency of input;
reducing dependence on energy, resources, and environmental inputs; cultivating new
growth points and competitive advantages; and adopting a low-carbon, efficiency-
focused path of development.
The system of indicators underlying China’s INDCs reflects the need for
transformation and innovation in China's model of development; these indicators
include an intended time target for peak emissions and quantitative indicators
designed to evaluate carbon efficiency (including targets for carbon intensity, share
of non-fossil fuels, and carbon sinks). China is committed to changing its path of
development; exploring innovative, sustainable and low-carbon models that differ
from the traditional development pathways of both the US and the EU; and creating
the technological, financial, and other conditions necessary to achieve this
transformation.
China’s INDC also contains a range of implementation measures and policies
designed to mitigate existing climate change risk and fulfill the INDC's mandate across
mitigation, adaptation, financing, technology development and transfer, capacity
building, and transparency. China's INDC also calls for broadening and deepening
south-south cooperation on climate change, including the establishment of a fund forsouth-south climate cooperation.
2. Ambition and Fairness of Contributions
On the whole, the INDC demonstrates China’s overall determination to take
serious action on climate change, control greenhouse gas emissions, strengthen
adaptation capacity, and actively engage in global governance, including the
acceptance of reasonable international commitments.
A. The implementation of China's INDC will promote economic decoupling from
carbon emissions.
As can be seen from Table 1 and Figure 1, economic growth is the major
contributor to the increase in China’s carbon dioxide emissions. Relative to 2005,
China’s GDP per capita will grow 3.2x, 5.2x and 11x by 2020, 2030, and 2050,
respectively. Implementation of the INDC can contain the increase of China’s energy-
related CO2 emissions over the same time period to 1.8x, 2x and 0.84x, respectively.
This indicates a decoupling between China’s economic growth and carbon emissions;
that is, the economy’s dependence on carbon will be reduced, creating more favorable
conditions for the transition toward a low-carbon path of development.
The major reason for the decoupling will be the decrease in energy intensity per
unit of GDP (which in turn will benefit from industrial restructuring and improved
energy efficiency) and the decarbonization of China’s energy mix. By 2030 and 2050,
China’s energy intensity per unit of GDP will drop roughly 57% and 82%, respectively,
relative to 2005 levels, while its carbon intensity per unit of energy will drop by 20%
and 61%, respectively.
In particular, during the period of 2005 to 2020 and the period of 2020 to 2030,
the contribution from decreasing energy intensity will be more significant than the
decarbonization of the energy mix. From 2030 onward, the contribution from the
decarbonization of energy will become more pronounced.Table 1 Major factors in implementation of China’s INDC (2005=100)
2005 2010 2015 2020 2030 2040 2050
Population 100 103 105 108 112 112 111
GDP per capita 100 166 235 321 517 783 1103
Energy intensity per unit of GDP 100 81 68 59 43 29 18
Carbon intensity per unit of energy 100 98 94 89 80 63 39
consumption
Energy related CO2 emissions 100 135 158 182 201 158 84
Sources: Data for 2005 and 2010 is from China Statistical Yearbook, China Energy Statistical
Yearbook and China’s official review of target completion. Data after 2015 is developed based
on INDC scenario study results calculated by the PECE model of NCSC and Renmin University
of China.
1200
1100
1000
900
800
700
2005=100
600
500
400
300
200
100
0
2005 2010 2015 2020 2025 2030 2035 2040 2045 2050
Population GDP per capita Energy Intensity per GDP
Carbon Intensity per energy Energy related CO2 emission
Figure 1-1 Change of major driving factors after the implementation of INDC in
China (2005 = 100)80%
60%
40%
20%
0%
-20%
-40%
-60%
-80%
2005-2020 2020-2030 2030-2040 2040-2050
Population GDP per capita Energy Intensity per GDP Carbon Intensity per GDP
Figure 1-2 Decomposition of the change in China’s energy–related CO2 emissions
Sources: Data of 2005 and 2010 are from China Statistical Yearbook, China Energy Statistical
Yearbook and the China’s official review of target completion. Data after 2015 is developed
based on INDC scenario study results calculated by the PECE model of NCSC and Renmin
University of China.
B. China’s emission reduction efforts after 2020 will be further strengthened
compared to its 2020 commitments
Table 2 demonstrates that by the period of 2020-2030, the annual rate of decline
of China’s CO2 emissions per unit of GDP will be further enhanced from 3.9% in the
2005-2020 period to 4.4%, with the potential to reach 6.3% in the 2030-2040 period
and 9.2% in the 2040-2050 period. Meanwhile, China will speed up the deployment
and construction of non-fossil energy projects, promoting an increase in the growth
rate of non-fossil energy sources. By 2030, China’s installed capacity of non-fossil
power is expected to increase by approximately another 900 gigawatts from the 2014
level, roughly equivalent to the country’s installed thermal power capacity in 2014,
and much higher than U.S. and European levels over the same period (see Figure 2).
Average annual installation of non-fossil power generation capacity will increase from
41.5 gigawatts in the period of 2005-2020 to 62.8 gigawatts during 2020-2030, and to
90 gigawatts in the 2040-2050 period.Table 2 China’s action in reducing carbon intensity and developing non-fossil energy
2005-20 2020-30 2030-40 2040-50
Annual average rate of decrease of CO2 intensity 3.9% 4.4% 6.3% 9.2%
per unit of GDP
Annual average newly installed non-fossil power 41.5 62.8 79.6 90.1
generation capacity (GW), among which
Wind power (GW) 13.9 23.0 31.0 35.0
Solar power (GW) 7.0 24.5 33.0 40.8
Nuclear power (GW) 3.4 9.0 9.3 10.5
Sources: Developed based on INDC scenario study results calculated by the PECE model of
NCSC and Renmin University of China. The carbon intensity and non-fossil target in 2020 are
calculated as 45% and 15%, and in 2030 as 65% and 20%, respectively.
Hydro
Nuclear
US
EU
Wind
China
Solar
(50) 0 50 100 150 200 250 300 350 400
Changes in non-fossil power genera on capacity in 2030 compare to 2014 , GW
Figure 2 Change in non-fossil generation capacity in 2030 compared to 2014 (GW)
Source: Developed based on INDC scenario study results calculated by the PECE model of NCSC
and Renmin University of China. U.S. and EU data are from World Energy Outlook 2015 Special
Report by IEA, covering the change by 2030 over 2013.C. As a country starting late in its development, China has the potential to achieve
the following transformation through implementation of its INDC targets, and to
achieve an innovative development pathway that will be less carbon-intensive
and peak lower and earlier, with lower income levels than other developed
countries
Seen from the historical CO2 emissions trajectory of major economies, there exists
a Kuznets curve (an inverted ‘U’ curve) relation between economic development levels
and CO2 emissions per capita, i.e., along with the increase of GDP per capita, the level
of CO2 emissions per capita will experience continual growth until reaching a peak and
then dropping. Although the level of emissions peaks vary, until today, no economy
has avoided this trend of “dropping after growing”.
For major developed countries, their CO2 emissions per capita peaked at around
10-22 tons when their GDP per capita reached around 20,000-25,000 US dollars per
annum (in 2010 price levels). Yet according to China’s targets set in the INDC, it is
possible that China’s CO2 emissions per capita will peak at around 8 tons when its GDP
per capita reaches around 14,000 US dollars. This is a major feature of China’s
innovative development pathway as a country starting late in its development. If taking
consideration of China’s position as the “world’s factory” and its abundant coal
resources, it is likely that the peak values of consumption-based emissions and energy
use will be lower than those of developed countries.
Figure 3 Trajectory of GDP and CO2 emissions per capita of major economies
Data sources: only contains energy related CO2 emissions. Data of historical CO2 emissions
from 1960 to 2012 is quoted from CDIAC. Population and GDP information are cited from theWorld Bank. Data after 2012 is calculated based on INDC targets of each economy.
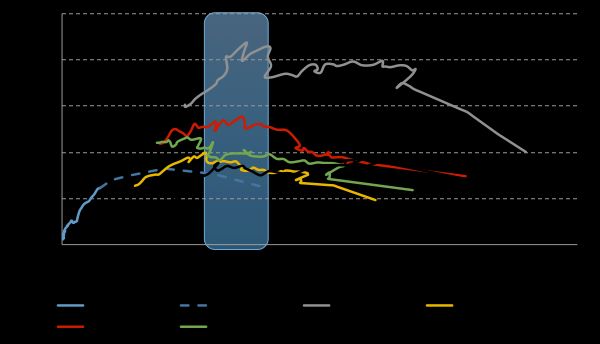
D. If China can realize its 2030 targets proposed in the INDC, it will lay a solid
foundation for China to further transform its development pathway to achieve
the global goal of limiting warming within 2°C
According to multiple scenarios with more than 50% probability to achieve the 2°C
target in the IPCC’s Fifth Assessment Report which are consistent with China’s actual
situation, the emission reduction requirement for China by 2030 is almost coherent
with the emission reduction target China sets in its INDC. However, the key focus is on
whether China could accelerate the pace of decarbonization after peaking in 2030.
That is to say, if China could decarbonize at a faster rate after achieving its 2030 goals,
it is possible that China’s long-term development pathway will meet the international
goal of holding the increase in global average temperature below 2°C. As
demonstrated in Figure 4, the dotted lines, standing for the simulated emission
footprints under the INDC scenario (before and after energy data readjustment), fall
right into the range (in purple shade) of multiple IPCC AR5 scenarios which are
coherent with the 2°C temperature goal, in line with China’s actual situation. Since
China’s INDC contains practical arrangements in technology, finance, policy
mechanisms and capacity building geared towards an innovate development pathway,
and it is committed to avoiding the lock-in effect of urbanization, infrastructure
construction and high-carbon industry through scientific planning (urban spatial layout)
and administrative orders (limiting increases in high-energy consumption industry), it
is safe to conclude that through implementation of the INDC, China will build up its
development philosophy, public opinion, policy and institutional reserve,
technological reserve system, innovation capacity, capital stocks and flows,
comprehensive and specialized capabilities, laying a solid foundation for
transformation at a faster rate after 2030.16000
14000
12000
CO2 emission, Mt CO2
10000
8000
6000
4000
2000
0
2005 2010 2015 2020 2025 2030 2035 2040 2045 2050
Figure 4 Relations between China’s INDC scenario and IPCC 2°C Scenario
Note and sources: the purple shade stands for a range of multiple possible scenarios from the
IPCC AR5 scenario database (more than 50% probability to achieve 2°C goal) that meets
China's actual situation, including scenarios developed by global models like GCAM, IMAGE,
MERGE, MESSAGE, POLES, REMIND, TIAM-ECN, WITCH, etc. Scenarios with 2010 and 2015
emission levels which were very different to China's actual emissions were removed. The
yellow dotted line stands for China's emissions trend when implementing INDC targets
(without consideration of Chinese energy data adjustment in 2014), calculated with the PECE
model developed by NCSC and Renmin University of China. The red line describes a rough
trend taking into consideration the Chinese energy data adjustment in 2014. To make the data
comparable with global data, the CO2 emissions include energy-related CO2 emissions plus CO2
emissions from cement production.
E. Through Implementation of its INDC, China’s cumulative emission level by 2030
will stay lower than the US and EU levels
The IPCC Fifth Assessment Report confirmed the approximate linear relation
between global warming and cumulative emissions. As demonstrated in Figure 5, for
developed countries, the peaking period of their GHG emissions occurred throughout
1850 until 1990. During that period, their process of industrialization was marked by
large amounts of GHG emissions. In China, CO2 emissions grew sharply since the mid-
20th century, in particular from the rapid industrialization during the period of ‘reform
and opening up’, which started around 1980. Under the INDC targets and through its
innovate development pathway, China will be sure to maintain its cumulative energy-
related CO2 emissions by 2030 lower than those of the US and the EU (at that time,the ratio of cumulative energy-related CO2 emissions among US, EU and China will be
1.4:1.2:1.0), even lower than the current (1751-2012) cumulative emission level of US
and EU. China’s cumulative emissions per capita from 1751 to 2030 are projected to
be much lower than the US and EU (18% and 30% respectively).
5000
4500
4000
Cumula ve CO2 emission, 108 t CO2
3500
2013-2030
3000
2500 1991-2012
2000 1851-1990
1500 1751-1850
1000
500
0
China US EU
Figure 5-1 Cumulative CO2 emissions comparing China, US, and EU
1400
1200
Cumula ve CO2 emission per
capita, 1751-2030, , t CO2
1000
800
600
400
200
0
China US EU
Figure 5-2 Cumulative CO2 emissions per capita comparing China, US, and EU
Sources: only contains energy-related CO2 emissions. Data of historical CO2 emissions from
1960 to 2012 is quoted from CDIAC. Population and GDP information are cited from the World
Bank. Data after 2012 is calculated based on INDC targets of each country.
F. China will provide demonstration and reference for future developing countries,and will transfer experience and provide support for developing countries
through means such as south-south cooperation
As the largest developing country in the world, China is taken as an example for
many other developing countries seeking growth. Through its innovative development
pathway, China will become a demonstration model which other developing countries
can follow in pursuing sustainable development. Learning from China’s experience,
other developing countries can avoid reliance on the traditional high-carbon
development pathway and the lock-in effect, enabling them to take on a new
development pathway that is efficient and innovative with low pollution and emissions.
At the same time, China will promote global transformation by fulfilling its
commitment, contributing to the reshaping of the global development pathway.
3. Difficulties and challenges facing China in achieving INDC targets
Although it is clear that low-carbon growth is inevitable for China’s future
development, China will face a number of challenges in achieving its INDC targets,
including limitations brought by China’s stage of economic and social development,
economic structure, natural reserves of energy resources, energy efficiency,
technological capacity, institutional policy basis, the international political and
economic structure it faces, etc.
1. Accessibility to natural resources will increase the risk of failing the INDC targets.
For example, clean energy such as natural gas is needed to replace coal
consumption to meet the targets. A huge challenge in this process is how to
ensure a sufficient and reliable supply of resources and guarantee national energy
security while controlling costs.
2. As China is still in the process of industrialization and urbanization, heavy industry
sectors such as machinery manufacturing, iron and steel, construction materials
and chemical industry still form a large share of the economy. Together with rapid
urbanization, which comes with large scale infrastructure construction, this
implies a constant increase of energy consumption and carbon emissions. Even
though the Chinese government has committed to adjustment of economic
structure and transformation of economic growth, it is no overnight process.
Furthermore, potential downward economic pressure would present a great
challenge.
3. With the ratio of middle class population rising every year, the emissions from
transportation and buildings will increase accordingly, surpassing that of the
manufacturing industry in mid-long term. To realize the targets set in the INDC, itwill be vital to cultivate the young generation to adopt a low-carbon consumption
model and lifestyle.
4. Reliability and uncertainty of technology is another major challenge facing China
in achieving its INDC objectives. For instance, China needs to address issues such
as how to ensure renewable energy generation and reliability of the power grid,
how to manage environmental impacts of hydropower and safety of nuclear
power, and how to reduce the uncertainty of carbon capture and storage (CCS)
technology.
5. As a developing country, China’s overall technological level lags behind, with
limited R&D capacity of key technologies, especially in low-carbon and adaptation
technology. How to ensure access to technologies through effective international
cooperation is one of the key issues in implementing the INDC targets.
6. To achieve mitigation and adaptation targets requires huge investment and
construction costs. Some of the incremental investments bring about economic
returns, while a majority of them are just huge economic costs, for example, the
application of technologies like CCS. Besides economic costs, China may face social
costs in the process such as structural unemployment caused by the closure of
outdated production facilities, requiring measures to mitigate these social impacts.
7. Competencies and capacities of key stakeholders in climate change are generally
still limited, bringing about the heavy task of raising social awareness, and
improving institutional and social mechanisms. China lacks macro management
capacities to address climate change and its legislative and policy system in this
area is incomplete. At present, China still lacks a sound statistical and accounting
system for GHG emissions and is comparatively weak in monitoring, regulation,
and calculation of GHG emissions, as well as in law enforcement capacity. All of
these shortcomings present challenges for China to realize its INDC targets.You can also read