EVALUATING SOLAR ENERGY PLANTS TO SUPPORT INVESTMENT DECISIONS
←
→
Page content transcription
If your browser does not render page correctly, please read the page content below
EVALUATING SOLAR ENERGY PLANTS
TO SUPPORT INVESTMENT DECISIONS

                                                                                        Author
                                                                              Marie Schnitzer
                                                                     Director of Solar Services

                                                     Published for AWS Truewind October 2009
                                                               Republished for AWS Truepower:
                                                                                    May 2010

   AWS Truepower, LLC | 463 New Karner Road | Albany, NY 12205
        awstruepower.com | info@awstruepower.com | +1‐518‐213‐0044
Page | 2 EVALUATING SOLAR ENERGY PLANTS TO SUPPORT INVESTMENT DECISIONS
INTRODUCTION
As solar projects increase in quantity and scale, capital to fund the projects will be increasingly challenging to
acquire. Coupled with tighter capital markets, an accurate resource and energy production analysis plays a critical
role in presenting a “bankable” report to financial institutions. The methods applied to conduct a thorough analysis
require the input of several factors including: solar resource assessment, energy production projections, and their
associated uncertainties. This paper provides guidance on how these factors are evaluated as an independent
engineering component of bankable assessments for both developers and equity/debt participants.
Resource assessment and the data used to estimate energy production encompasses measurement standards,
data validation and quality control, long term climate trends, solar resource modeling, and correlating modeled
and measured data. Financeable independent energy production estimates utilize thoroughly screened resource
data, solar system design specifications, and project specific loss factors and uncertainties to estimate both the
expected production of the plant and the corresponding uncertainty, to provide several probability levels
quantifying financial risk.
The solar industry has traditionally been limited to residential and light commercial scale installations used to
supplement onsite electricity consumption. However, declining costs and increased demand has made utility scale
projects increasingly attractive to investors and developers. These new projects take advantage of the favorable
political environment, tax credits and/or feed‐in tariffs, renewable portfolio standards, and an increased
awareness from consumers.
ENERGY PRODUCTION REPORTS
Energy production reports used for investment consideration include an estimated project lifetime and annual
production table with data at five confidence levels (P50, P75, P90, P95 and P99) and two table matrices
quantifying average net production values on monthly and diurnal time scales. The five confidence levels provide
a range of expected average production outputs for the project.
A thorough approach to generating annual energy predictions and energy production reports requires
accumulating the data and other information needed to make determinations about project viability as outlined in
Figure 1.
Figure 1. Method to Develop Solar Energy Production Reports
May 2010Page | 3 EVALUATING SOLAR ENERGY PLANTS TO SUPPORT INVESTMENT DECISIONS
SOLAR RESOURCE ASSESSMENT
For preliminary site assessment, the solar resource is often characterized by using publicly available data sources,
some with high levels of uncertainty. For a detailed analysis, additional data sets are needed as is a much more
rigorous analysis to accurately determine a site’s potential.
Data Sources
The first step to screen potential project sites is to assess the solar resource by reviewing the modeled data sets.
The most widely available dataset from National Renewable Energy Laboratories is the National Solar Radiation
Database (NSRDB) (1); however, as the data resolution is 10‐km, a more rigorous approach is needed to create
representative site‐specific solar resource data with reduced uncertainty. The combination of the uncertainty
introduced by the satellite imagery conversion process and its coarse resolution does not take into account sub‐
grid scale (such as terrain‐induced) climate effects. The uncertainty in the database is dependent on geographic
region and ranges from 8% to greater than 25%. This level of uncertainty may be acceptable for prospecting and
screening. It may also be suitable for smaller scale projects; however, with an increase in project size from tens to
hundreds of megawatts, additional onsite measurements are needed to mitigate the project risks by characterizing
the site to a greater degree.
Another source used to evaluate the solar resource of a particular location is data from long term reference
stations. These stations record meteorological data throughout the United States, although there is a limited
network of measurement within this network that capture irradiation values. In the southwest U.S., an area of
great interest and activity for developers, only four long term reference stations have solar resource measurement
capabilities: Hanford, CA, Mercury Desert Rock, NV, Albuquerque, NM, and El Paso, TX. This network does not
provide many opportunities to determine site characteristics within an area of the U.S. with significant activity in
prospecting and solar project development furthering the need to conduct on‐site measurements.
On‐site Measurement
The observations obtained from on‐site resource assessment campaigns provide extremely valuable data to
develop and design solar energy projects. Solar monitoring station design is influenced by the type of data needed
and budget considerations. Radiation data needs are influenced by solar plant design and project phase. Solar
thermal or CSP projects require the direct normal radiation measurements along with the other meteorological
parameters. Photovoltaic (PV) projects require at least two of the radiation components to accurately characterize
the solar resource. Thus, instrumentation should measure minimally global horizontal and diffuse radiation, wind
speed and direction, temperature, and relative humidity. On‐site campaigns provide micrositing data that can be
extremely valuable in characterizing the solar resource to reduce the overall uncertainty of the energy analysis.
Based on our experience and industry best practices, AWS Truewind designs customized solar resource
measurement programs that operate in remote locations and collect essential meteorological data.
Recommended measurements include global horizontal, direct beam, plane of array and diffuse radiation, wind
speed and direction, temperature, precipitation and relative humidity.
AWS Truewind procures and manages the installation of the monitoring stations at client specified locations. Once
the stations are commissioned, our company provides station operations and maintenance (O&M) support as well
as data analysis and reporting. O&M support consists of the following:
• Scheduled and unscheduled maintenance
• Calibration checks
• Troubleshooting and repairs
• Regular inspections of all data parameters to ensure proper operations
Data recorded by the station is routinely transmitted to AWS Truewind as part of this support. The data is
subjected to validation routines to ensure that quality standards are continuously being met. Analyzing this data
for any measurement error, anomalies or other inconsistencies on a regular basis ensures a robust data set for use
May 2010Page | 4 EVALUATING SOLAR ENERGY PLANTS TO SUPPORT INVESTMENT DECISIONS
in detailed energy analysis for project assessment.
Validation
Data from solar meteorological stations needs careful quality control and assessment to remove errors that may
lead to biased and misleading energy production results. All data obtained should be validated using established
procedures to ensure high data quality. Validation can be done in a number of ways including the following:
• Time series analysis to identify and flag any obvious failures or performance anomalies
• Comparison to satellite‐derived data or comparing to the satellite observations for the same time period
• Comparison of multiple stations installed in the same region.
Site Specific Characteristics
A typical meteorological year (TMY), is defined as a long‐term annualized hourly time series of insolation (global
horizontal, plane‐of‐array, direct, diffuse) and relevant meteorological parameters (ambient temperature, winds)
chosen from a typical monthly time series of historical observations. Through data analysis and validation, biases
and anomalies can be identified in any of the datasets available in the NRSDB and other weather databases.
The measure‐correlate‐predict (MCP) method is useful in reducing the uncertainty in projecting the long‐term solar
climate. In MCP, a linear regression or other relationship is established between a target site, spanning a relatively
short time period, and a reference site, spanning a much longer time period. The complete record of the reference
station is then used in this relationship to estimate the long‐term historical climate at the target site. AWS
Truewind, a renewable energy consulting firm, recommends an on‐site period of record of six to twelve months for
use in the MCP process. The company’s experience in the wind industry supports this approach as a means to
validate the solar resource, predict long term trends in climate data, and provide a solid foundation to assess
energy production over a project life of 20 or more years.
Case Study
AWS Truewind completed a solar study in the southwestern U.S. that combined modeled data and regional
measurements to provide more accurate predictions of the site‐specific solar resource compared to either data
source alone. This study evaluated short‐term on‐site observations with the records from the NSRDB using MCP to
adjust the short‐term observations to the long‐term. On‐site observations for less than three months were used in
this study. The relevant NSRDB data were merged with Clean Power Research (CPR) records to extend the
satellite‐derived irradiance record through the time period of on‐site observations. This process provided the
opportunity to compare the modeled records with on‐site observations, although we typically recommend an on‐
site period of record of at least six to twelve months for use in the MCP process in solar resource.
In our analysis (3), we identified a bias in the NSRDB/CPR database compared with ground station data. To
quantify the bias, data from the NSRDB/CPR gridded output were compared with eight years of observations at
Hanford, CA. This analysis revealed that the model tended to underestimate the insolation from June through
August and overestimate the insolation from October through April. For more details, see Freedman et al (3).
Given the bias present in the NSRDB/CPR database, we adopted a different approach to estimate the long‐term
resource characteristics of the site in the study. We performed a linear regression using the annualized hourly time
series of NSRDB/CPR data with Hanford observations as the predictor variable to develop a bias‐corrected TMY for
more accurate energy production estimates. The resulting bias‐corrected time series produced an overall 1.7%
decrease in the annually‐averaged global insolation and an average decrease of 3.2% in net energy production.
ENERGY PRODUCTION PROJECTIONS
Evaluating solar energy production can vary in complexity and are based on a range of variables used to predict
performance under operating conditions. Several important factors to consider include the use of solar resource
characterization and site characterization, computer simulation models, system specifications, power plant losses,
and the uncertainties associated with each of these factors.
May 2010Page | 5 EVALUATING SOLAR ENERGY PLANTS TO SUPPORT INVESTMENT DECISIONS Computer Simulation Computer simulation models should be evaluated and developed carefully to ensure the most accurate simulation of energy production. The capabilities of publicly and commercially available models vary significantly using different meteorological and equipment databases, radiation and system simulation models and loss factors. These simulation models are limited in capability to evaluate project uncertainty and further steps are needed to complete a bankable report with probability levels, e.g. P50, P90, P99. An essential element for this next step is to develop proprietary simulation models and calculators are created and used in conjunction with the commercial software programs. This step provides the opportunity to customize simulation models to accommodate for uncertainty calculations, integrate lessons learned, or increase functionality of the stand‐alone model. A site‐specific TMY is an essential element for accurate energy calculations. The meteorological files included in the commercially available computer simulation model databases usually have a coarse resolution and do not offer data for the exact project location. These database files provide a method for screening and prospecting and are not recommended for use in a detailed system simulation. The use of meteorological data included in the database can introduce a bias of several percent in annual energy production. System Specifications There are considerations for the type of plant and meteorological data needs between a CSP or Solar Thermal and PV plants. The system equipment, component arrangement, and module simulation model must be known to predict system performance at non‐ideal conditions. For example, PV modules are rated at standard test conditions which include solar irradiance of 1000 W/m2 and cell temperature of 25oC; however, the PV system rarely operates at these conditions. Radiation levels change constantly throughout the day and the PV cell temperature can much higher than 25°C for areas in southwestern U.S. PV systems operate in these non‐ideal conditions much of the time, so the model used to simulate PV performance must be able to adjust the system’s performance accordingly. The simulation model should calculate module temperature (using irradiation, wind speed, ambient temperature, and mounting structure) and adjust performance using a validated correction model. For PV systems, the performance of the inverter must be simulated for different operating scenarios. Inverter performance is typically described using an efficiency curve (efficiency versus percentage of nominal power). The curve expresses a combination of electrical and maximum power point tracking efficiency. This generalized performance indicator is satisfactory for initial performance estimates; however, inverter performance will change with different operating conditions and system voltages. Also, the efficiencies stated in the inverter curve are generalized for a typical module; the ability for the inverter to track the maximum power point of the system will depend on module technology, since different modules have more/less pronounced maximum power points depending on their current‐voltage curves. An important step in the energy prediction process is accurately quantifying the environmental and system losses. These losses will greatly impact the performance of the system. A partial list of typical system losses can be found in Table 1. While some of these are static losses, some change with time and others are dynamic. To produce accurate estimates for system performance, these losses need to be assessed for the specific components of the system and the exact project location. May 2010
Page | 6 EVALUATING SOLAR ENERGY PLANTS TO SUPPORT INVESTMENT DECISIONS
Table 1. Typical Losses for Solar Plants
Partial list of PV system losses Partial list of CSP system losses
Soiling Tracking
Shading System Availability
Electrical System Losses Convective Heat Loss
Module Thermal Loss Radiative Heat Loss
System Availability Parasitic Pumping
Annual Power Degradation
UNCERTAINTY
Each step in the energy production analysis increases the uncertainty of the end result; therefore, it is important to
quantify this uncertainty at each step of the process to produce an accurate range of production values with
associated probability levels. The main sources of uncertainty exist in the solar resource datasets used to create
the TMY the simulation model’s algorithms, the solar plant estimated losses, and the tolerance in the
manufacturer supplied power and electrical characteristics of the system components.
The TMY uncertainty includes include those from the NSRDB dataset, long term reference station datum and on‐
site measurement campaigns. On site measurement campaign uncertainty include that from the measurement
equipment accuracy, installation and maintenance protocols, proximity to actual project siting, and equipment
calibration.
The computer simulation model’s uncertainties include the translation of horizontal radiation to the plane of array,
estimation of module temperature and an accurate representation of module performance in non‐ideal
conditions. There are also varying uncertainties in estimating each of the environmental and system loss factors
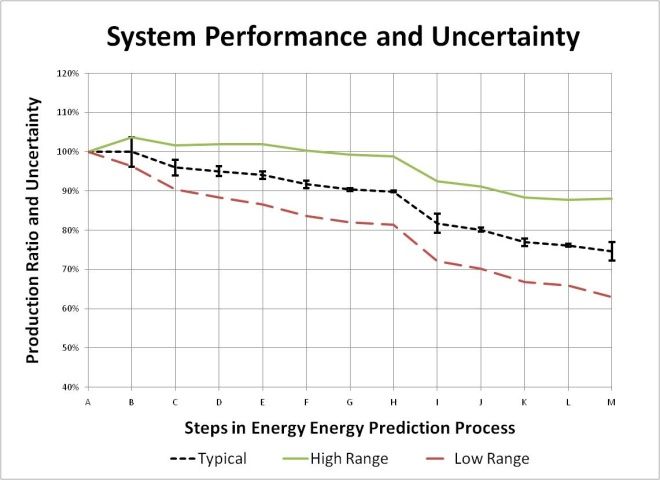
outlined above. The uncertainty of estimated system performance increases with each step of the solar resource
and energy assessment process as illustrated in Figure 2.
Figure 2. System Performance and Associated Project Uncertainty
All of the noted uncertainties are combined into an overall project uncertainty that is used to calculate various
probability levels for the annual production of the system (P50, P75, P90, P90, and P99). In combination with the
annual degradation of system performance, the probability levels are used to calculate annual energy estimates
for each year of the project’s expected lifetime. Additionally, two table matrices of average net production on
monthly and diurnal time scales is provided to demonstrate expected system performance throughout the year,
allowing load matching and more detailed economic studies.
May 2010Page | 7 EVALUATING SOLAR ENERGY PLANTS TO SUPPORT INVESTMENT DECISIONS Conducting a thorough solar production assessment requires the input of numerous key variables. The first variable is an accurate and representative solar resource assessment to create the TMY dataset with a solar resource measurement campaign as a key component. Imperfect data and models, complex cloud or solar climates, and other factors combine to create significant uncertainties in energy production estimates. A second variable is a carefully reviewed energy production estimate simulation model that takes into account system specifications as well as environmental and system losses. The third variable in the production assessment is a thorough understanding of the sources of uncertainty to develop the probability levels for the annual production of the system. Strategies to mitigate them are critical to providing well characterized energy production predictions in support of overall risk quantification for financial participants in the project. May 2010
Page | 8                                   EVALUATING SOLAR ENERGY PLANTS TO SUPPORT INVESTMENT DECISIONS

References
(1) Perez, R., Ineichen, P., Moore, K., Kmiecikm, M., Chain, C., George, R., Vignola, F., “A New Operational Satellite‐to‐Irradiance
Model”, Solar Energy, 73 5, pp. 307‐317.
(2) Schnitzer, M.A., et al., “Solar Energy Plant Analysis to Support Investment Decisions”, Proceedings of the 38th ASES National
Solar Conference, Buffalo, New York, May 2009.
(3) Freedman, J.M., et al., “Quantifying Uncertainties in the National Solar Radiation Database”, Proceedings of the 38th ASES
National Solar Conference, Buffalo, New York, May 2009.

May 2010
You can also read