Weekly Influenza and COVID-19 Surveillance graphs - GOV.UK
←
→
Page content transcription
If your browser does not render page correctly, please read the page content below
Weekly Influenza and COVID-19
                         Surveillance graphs
   PHE publishes a weekly national influenza and COVID-19 surveillance report
   which summaries the information from the surveillance systems which are used
   to monitor influenza, COVID-19 and other seasonal respiratory viruses in
   England.

   Additional figures based on these surveillance systems are included in this slide
   set.

   The figures presented in this slide set are based on data from week 38 (between
   20 and 26 September 2021).

30 September 2021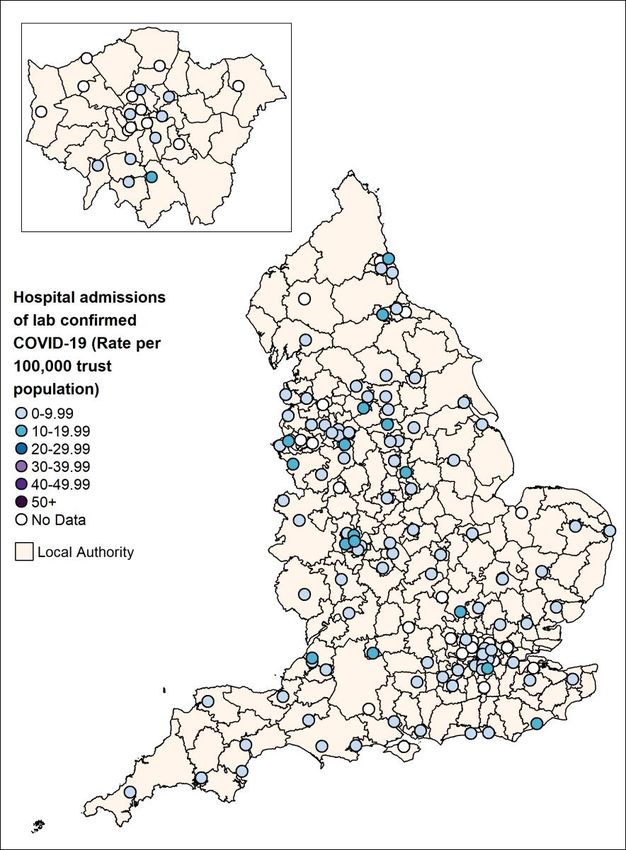
COVID-19 Pandemic Overview

30 September 2021                  Return to main menu
Confirmed COVID-19 cases tested under Pillar 1 and Pillar 2, by sample week,
                               since week 5 2020

                     400,000      Pillar 1 cases

                     350,000
                                  Pillar 2 cases

                     300,000
    Nuber of cases

                     250,000

                     200,000

                     150,000

                     100,000

                      50,000

                          0
                               5 7 9 11131517192123252729313335373941434547495153 2 4 6 8 101214161820222426283032343637

                                                                   Sample Week

30 September 2021                                                                                    Return to main menu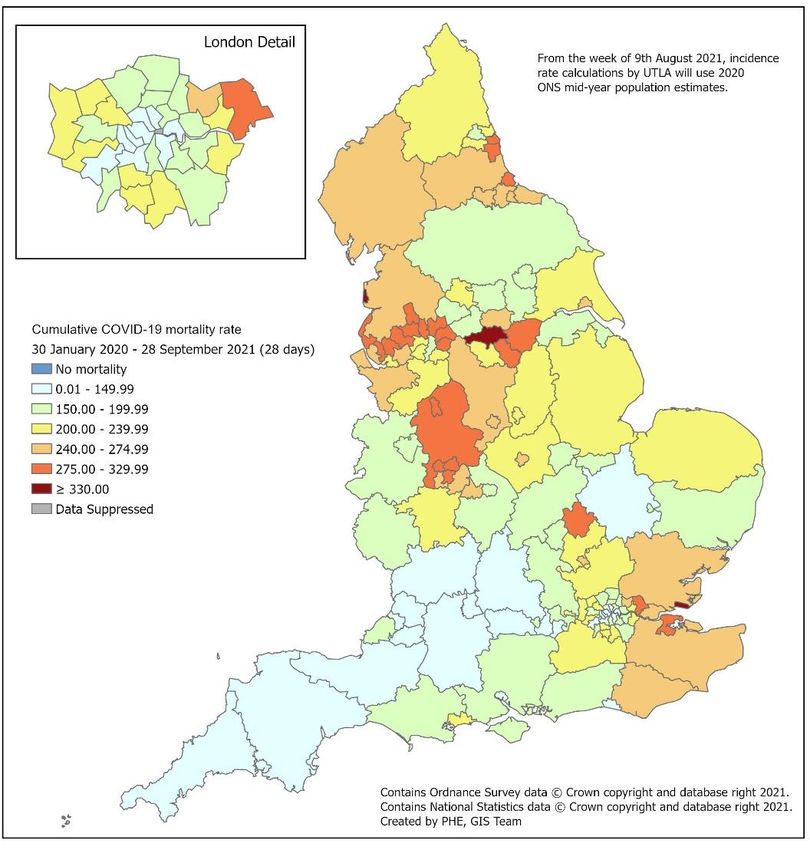
Weekly overall hospital and ICU/HDU admission rates per 100,000 of new COVID-
                                            19 positive cases reported through SARI Watch, England since week 12 2020

                                           40.00
                                                                                                                                            COVID-19 hospital admission
                                                                                                                                            rate
                                           35.00

                                           30.00
            Admission rate (per 100,000)

                                           25.00

                                           20.00

                                           15.00

                                           10.00

                                            5.00

                                            0.00
                                                   12 14 16 18 20 22 24 26 28 30 32 34 36 38 40 42 44 46 48 50 52 1 3 5 7 9 11 13 15 17 19 21 23 25 27 29 31 33 35 37
                                                                                                        Week number

30 September 2021                                                                                                                          Return to main menu
Number of deaths since week 10 2020 by week of death and time since
                               laboratory confirmation of COVID-19, England

                            10000
                                                                                                                                  28 day definition
                                                                                                                                  60 day definition
                            9000

                            8000

                            7000
         Number of deaths

                            6000

                            5000

                            4000

                            3000

                            2000

                            1000

                               0
                                    10 12 14 16 18 20 22 24 26 28 30 32 34 36 38 40 42 44 46 48 50 52 1 3 5 7 9 11 13 15 17 19 21 23 25 27 29 31 33 35 37
                                                                                          Week of death

30 September 2021                                                                                                              Return to main menu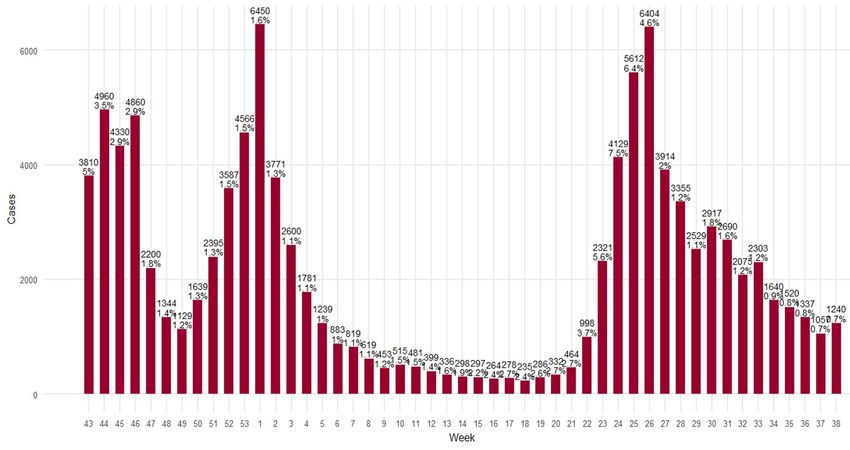
Confirmed COVID-19 cases in
                       England

30 September 2021                   Return to main menu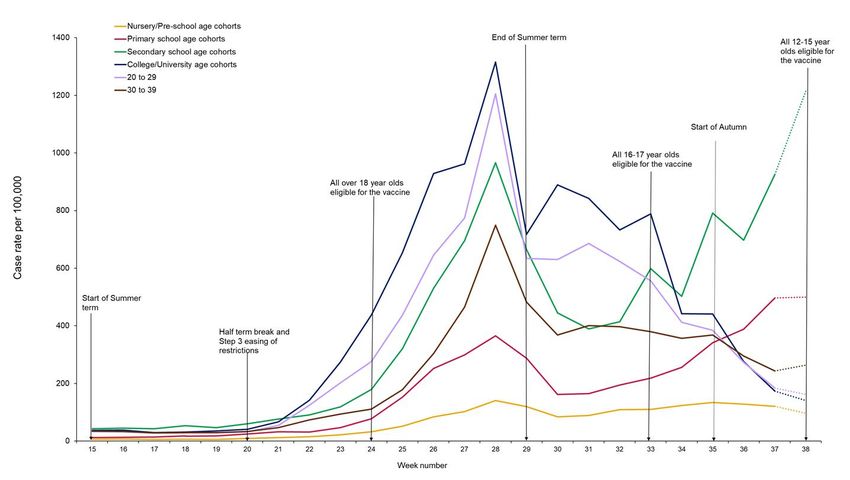
Confirmed COVID-19 cases in England

    Data Information
    • From the week 32 report onwards, case rates have been updated to use the latest ONS population estimates for mid-2020. Previously
      case rates were calculated using the mid-2019 population estimates
    • Rates by ethnicity and IMD quantile will continue to be presented using the mid-2019 estimates, until the mid-2020 estimates become
      available.

30 September 2021                                                                                            Return to main menu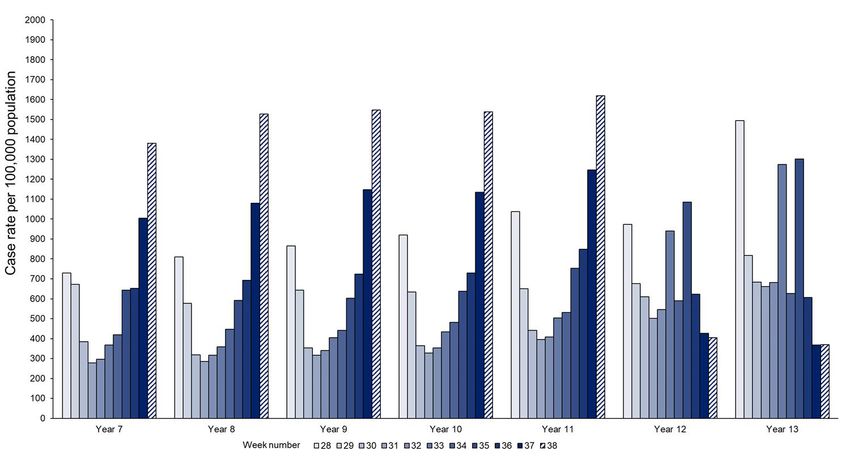
Weekly COVID-19 incidence per 100,000 population by age group and region,
                weeks 29 to 38

30 September 2021                                                         Return to main menu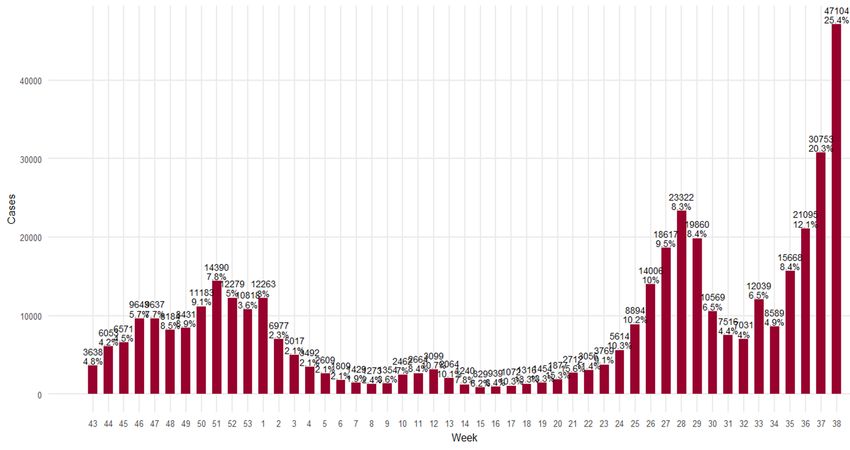
Weekly COVID-19 incidence per 100,000 population by ethnicity and region,
                    weeks 29 to 38

                                              *these incidence rates have been calculated using the mid-2019 ONS
                                              population estimates
30 September 2021                                                                                Return to main menu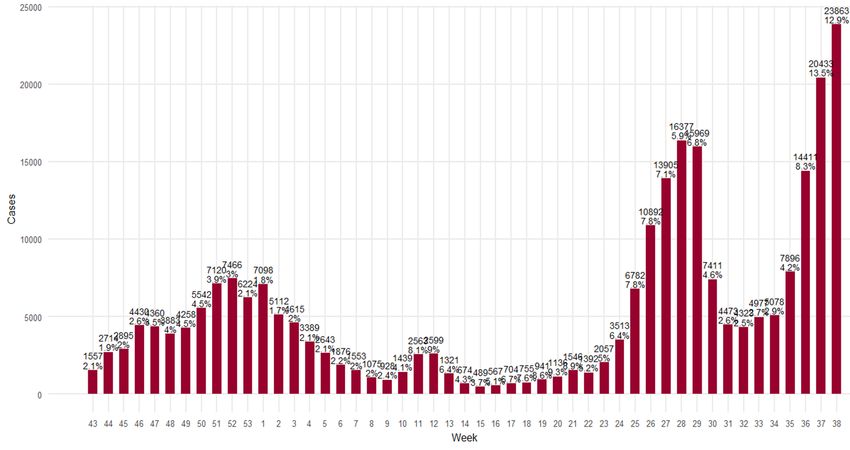
Weekly COVID-19 rate per 100,000 population by IMD quintile (1 being the
most deprived and 5 being the least deprived)
750.0
700.0
650.0
IMD Q1
Case rate per 100,000 population
600.0
IMD Q2
550.0
IMD Q3
500.0
IMD Q4
450.0
IMD Q5
400.0
350.0
300.0
250.0
200.0
150.0
100.0
50.0
0.0
39 41 43 45 47 49 51 53 2 4 6 8 10 12 14 16 18 20 22 24 26 28 30 32 34 36 38
Week Number
*these incidence rates have been calculated using the mid-2019 ONS
population estimates
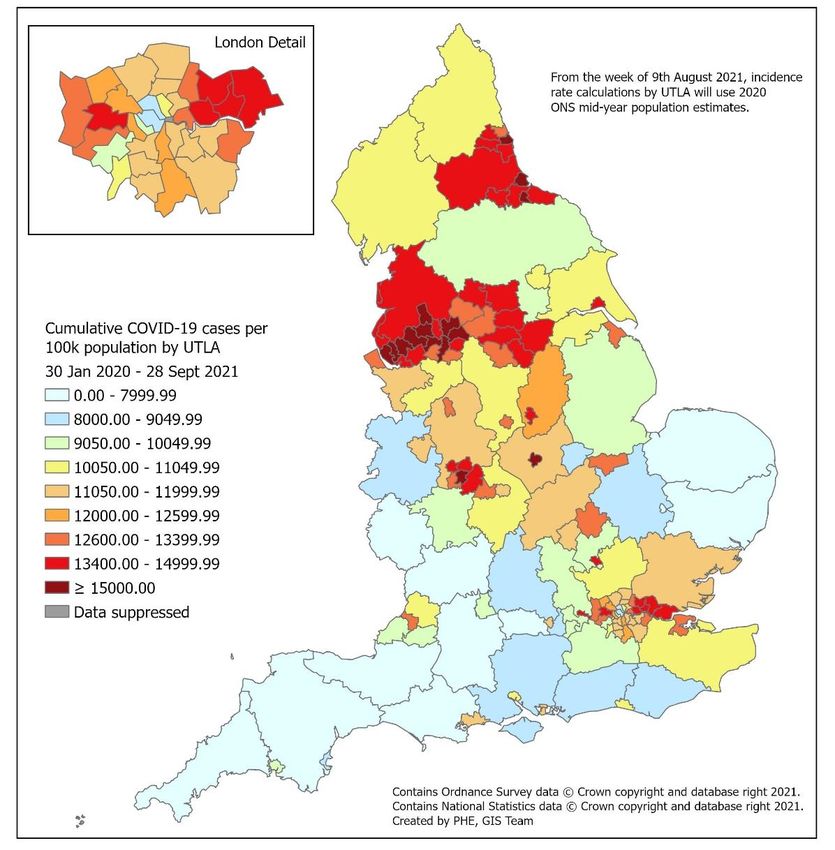
30 September 2021 Return to main menuCumulative rate of COVID-19 cases per 100,000 population tested under Pillar 1
and 2, by upper-tier local authority, England (box shows enlarged map of London
area)
30 September 2021 Return to main menuWeekly PCR positivity of COVID-19 cases by reason for test, weeks 41 to 38
45
40
35
30
Positivity (%)
25
20
15
10
5
0
41 43 45 47 49 51 53 2 4 6 8 10 12 14 16 18 20 22 24 26 28 30 32 34 36 38
Week number
Local council testing Symptomatic Citizen Symptomatic essential worker Study
30 September 2021 Return to main menuRespiratory Datamart system (England) 30 September 2021 Return to main menu
Respiratory DataMart – Influenza subtypes

30 September 2021                                               Return to main menu
Respiratory DataMart – Respiratory syncytial virus (RSV)

                                                                          RSV           Positive samples
                                                     450                                                   30
                                                                                        % 2018/19
                        Number of positive samples   400
                                                                                        % 2019/20
                                                                                                           25
                                                     350                                % 2020/21

                                                                                                                Proportion positive (%)
                                                                                        % 2021/22
                                                     300                                                   20

                                                     250
                                                                                                           15
                                                     200

                                                     150                                                   10

                                                     100
                                                                                                           5
                                                     50

                                                      0                                                    0
                                                           27 31 35 39 43 47 51 3 7     11 15 19 23
                                                                          Week number

30 September 2021                                                                                                                         Return to main menu
Respiratory DataMart – Respiratory syncytial virus
(RSV) weekly positivity by PHE region
25.0
North of England
Proportion positive (%)
South of England
20.0
London
15.0 Midlands and East of England
10.0
5.0
0.0
40 44 48 52 3 7 11 15 19 23 27 31 35 39
Week number
30 September 2021 Return to main menuRespiratory DataMart – other respiratory viruses
Return to main menu
30 September 2021Second generation surveillance system
(SGSS)
30 September 2021 Return to main menuSGSS reported RSV cases by region (all ages)
The presented figures are based on laboratory reports through SGSS. Testing and reporting procedures vary by virus,
PHEC and over time, including short-term trends in testing. Therefore comparisons should be done with caution.
30 September 2021 Return to main menuCommunity surveillance 30 September 2021 Return to main menu
COVID-19 clusters or outbreaks in educational settings

    Data Information
    • we report on new acute respiratory infection (ARI) incidents reported to Health Protection Teams (HPTs) and entered on
      HPZone in the previous reporting week in educational settings by locality
    • individual case notes are reviewed by an epidemiologist and an assessment made about whether the criteria for a confirmed
      COVID-19 cluster or outbreak are met. See definitions below
    • the incidents captured on HPZone represent a subset of all ongoing clusters and outbreaks in England. A variety of
      arrangements are in place with local authorities and other stakeholders supporting HPTs, however data may not routinely be
      documented on HPZone. As a result, the number of outbreaks reported for some of the regions are underestimates
    • For the 2021-2022 academic year the thresholds for reporting an outbreak in an educational setting to HPTs and HPZone have
      been revised, therefore comparisons with the 2020 to 2021 season should be interpreted with caution. Please see the next slide
      for the updated thresholds.

    Caveats
    • National Schools and Universities helplines remain in place to support educational settings to manage cases and outbreaks that
      may not require HPT input
    • From Monday 19 July 2021, schools, colleges and nurseries no longer carry out routine contact tracing. Close contacts are now
      identified and contacted by NHS Test and Trace.

30 September 2021                                                                                           Return to main menu
COVID-19 clusters or outbreaks in educational settings
Thresholds for reporting
For the 2021-2022 academic year the thresholds for reporting an outbreak in an educational setting to HPZone have been revised,
therefore when comparing with the 2020-2021 season, please interpret with caution.
Clusters and outbreaks are now reported to HPZone if either of the two following criteria are met:
• 5 cases or 10% (whichever is reached first) test-confirmed cases of COVID-19 (either PCR testing or LFD Ag testing with follow-
up PCR) within 10 days, among students or staff clustered in a consistent group or cohort. Dates should be calculated based on
illness onset, or test date if asymptomatic
Or
• Evidence of severe illness e.g. students or staff members admitted to hospital or a death as a result of a COVID–19 infection
(PCR or LFD Ag with follow up PCR) as the setting may require advice on risk assessment and communication.
Definitions
Cluster: two or more test-confirmed cases of COVID-19 among individuals associated with a specific non-residential setting with
illness onset dates within a 14-day period (in the absence of detailed information about the type of contact between the cases).
Outbreak: two or more test-confirmed cases of COVID-19 among individuals associated with a specific non-residential setting with
illness onset dates within 14 days, and one of:
• identified direct exposure between at least 2 of the test-confirmed cases in that setting (for example under one metre face to
face, or spending more than 15 minutes within 2 metres) during the infectious period of one of the cases
• When there is no sustained local community transmission - absence of an alternative source of infection outside the setting for
the initially identified cases
30 September 2021 Return to main menuNumber of COVID-19 confirmed clusters or outbreaks by type of educational
setting, England
Nursery
300
Combined
Primary school
250
Secondary school
Number of ARI incidents
Special Educational Needs (SEN) schools
200
College/University
150
100
50
0
36 38 40 42 44 46 48 50 52 2 4 6 8 10 12 14 16 18 20 22 24 26 28 30 32 34
Date of report week
30 September 2021 Return to main menuNumber of COVID-19 confirmed clusters or outbreaks by type of educational
setting, England
End of academic year total
Week 36 2020- 34 2021
Cumulative number of confirmed COVID-19 clusters or outbreaks by type of educational setting for the 2020/21 academic year Week 36 2020- 34 2021
PHE Centres Special Educational
Nursery Primary School Secondary School Combined College University Total
Needs (SEN) schools
Total 846 2125 2122 40 666 268 6067
Week 38 2021
Main table
Cumulative number of confirmed COVID-19 clusters or outbreaks by type of educational setting for the 2021/22 academic year from Week 35 2021
PHE Centres
Special Educational
Nursery Primary School Secondary School Combined College University Total
Needs (SEN) schools
East Midlands Centre 4 (0) 12 (3) 9 (3) 3 (1) 33 (8) 2 (2) 63 (17)
East of England Centre 0 (0) 6 (5) 2 (2) 0 (0) 2 (0) 0 (0) 10 (7)
London Centre 11 (4) 102 (40) 60 (27) 19 (7) 22 (14) 5 (3) 219 (95)
North East Centre 0 (0) 1 (1) 0 (0) 0 (0) 0 (0) 0 (0) 1 (1)
North West Center 0 (0) 7 (3) 3 (2) 1 (0) 18 (4) 0 (0) 29 (9)
South East Centre 10 (1) 115 (29) 56 (17) 12 (3) 31 (11) 2 (0) 226 (61)
South West Centre 1 (1) 22 (17) 26 (18) 2 (1) 18 (13) 1 (1) 70 (51)
West Midlands Centre 6 (1) 22 (12) 27 (18) 1 (1) 26 (12) 1 (0) 83 (44)
Yorkshire & the
3 (0) 7 (4) 12 (7) 2 (0) 17 (8) 0 (0) 41 (19)
Humber
Total 35 (7) 294 (114) 195 (94) 40 (13) 167 (70) 11 (6) 742 (304)
* Number of clusters or outbreaks for the most recent week in brackets
30 September 2021 Return to main menuWeekly number of COVID-19 cases in NHS Test and Trace contact tracing data,
who reported attending educational settings
Data sources/definitions
1. The NHS Test & Trace contact tracing form asks individuals about their work or education settings. This report includes those who
selected: 'Attending childcare, school, education setting’ and selected an education setting of: 'Primary school’, 'Secondary school' or
'college' (counted together), 'University’.
2. Age was used to confirm that cases were likely to be students, using the following age ranges as inclusive cut-offs: Primary school: 4 to
12 years old Secondary school college: 11 to 19 years old University: 16 years and above
3. Student cases may not be recorded if 'work and education' was selected rather than 'Attending childcare, school, education setting’
Approximately 1% of primary, secondary, and college cases may be underreported because of this, and 4% of university cases.
4. Weeks are defined using ISO-8601, meaning Week 1 starts Monday January 4th and ends Sunday January 10th, 2021.
5. Percentages in charts = percent of all cases (people who tested positive and were referred for contact tracing) for that week, this
includes cases which may not have completed the forms and entered work or education settings.
6. The data starts 23 October 2020, when education settings started to be recorded in the present format, and ends with the most recent
complete week.
7. Cases are assigned to dates by the date they were transferred to the NHS Test and Trace contact tracing system.
8. If a case reports being in education, this does not specify that they attended the setting in person during the time that they were
exposed/infectious (for example they may have been remote learning). In addition, cases that did attend in person may have been
exposed in other settings, such as their household or while doing other activities. This data can not be used to directly infer that these
cases acquired their infection, or that they exposed others, in an the education setting.
30 September 2021 Return to main menuNumber of people testing positive that reported attending primary school
and proportion among all people testing positive (weeks 43 to 38)
(Data source: NHS Test and Trace)
30 September 2021 Return to main menuNumber of people testing positive that reported attending secondary school and
proportion among all people testing positive (weeks 43 to 38)
(Data source: NHS Test and Trace)
30 September 2021 Return to main menuNumber of people testing positive that reported attending university and
proportion among all people testing positive (weeks 43 to 38)
(Data source: NHS Test and Trace)
30 September 2021 Return to main menuContacts by exposure/activity setting in week 38, England
(Data source: NHS Test and Trace)
Household
Unknown
Education
Household visitor
Leisure/community
Visiting friends/relatives
Other workplace
Other activity
Travel
Shops
Working in healthcare
Personal services
Health care
Social care or home care
Prison / detention facility
0 50000 100000 150000 200000 250000 300000 350000 400000
Number of contacts
Note: categories have been grouped as follows: leisure / community includes eating out, attending events and celebrations, exercising, worship, arts,
entertainment or recreation, community activities and attending play groups or organised trips; other workplace includes: retail, manufacturing or
construction, hospitality, transport, emergency services or border force, food production and agriculture, prison, financial services, civil service or local
government, information and communication, military, critical national infrastructure.
Personal services include hairdressers, barbers, tattooists and nail bars.
30 September 2021 Return to main menuEvents and activities reported by people testing positive, prior to symptom
onset in week 38, England
(Data source: NHS Test and Trace)
Attending childcare educational setting
Other (combined)
Shopping
Exercising
Eating out
Other
Entertainment and day trips
Sport events
Holiday
Activity event
Teaching and education
Living alone or with family
Other occupational sector Household
event
Visiting friends or relatives
Healthcare Work or
Travel and commuting education event
Manufacturing or construction
0 5000 10000 15000 20000 25000 30000 35000 40000 45000 50000 55000 60000 65000
Number of reports
Note: ‘Other’ includes a wide range of different activities and settings, each of which has small numbers of individuals, as well as activities which did not fit any
specific category and were added as Other by the case. This includes: all within ‘activities’: Arts, entertainment or recreation; Civil service or government; Close
contact services; Community and charity activities; Critical national infrastructure; Emergency services; Financial services; Food production; Hospitality; Immigration
border services; Information and communication; Military; Personal care; Prison; Private events and celebrations; Public events and mass gathering; event within a
shared household; Sport events; Supported living; Teaching and education; Transport; ‘Other (combined)’ includes all exposure group types that have small counts
such as “went to church”, “went to the zoo” within that event type.
30 September 2021 Return to main menuSurveillance in ‘educational-age’
cohorts
30 September 2021 Return to main menuMethodology and limitations
• Data source: SGSS Pillar 1 (NHS and PHE testing) and Pillar 2 (community testing) – England
• Educational-age cohorts have been calculated using dates of birth that correspond to a particular
year group. School year groups run from 1 September to 31 of August of the following calendar
year.
• We include all cases regardless of whether or not they attended an educational setting or whether
or not the educational setting was open during the reporting period
• Data for the most recent week are provisional and likely to be an underestimate
• The 2021-2022 school season commenced 1st September 2021. For information regarding the
2020-2021 school season please refer to the Weekly National Flu and COVID-19 reports
published between 22nd October 2020 to 2nd September 2021.
• The following cohorts became eligible for COVID-19 vaccination on the dates indicated below :
– All over 18 year olds, from week 24 2021
– All 16 to 17 year olds, from week 33 2021
– All 12 to 15 year olds, from week 38 2021
• More information on vaccine coverage can be found here:
https://www.gov.uk/government/publications/covid-19-vaccine-surveillance-report
30 September 2021 Return to main menuMethodology and limitations - Birth cohort – Year group
Birth cohort Year group
• The table aside represents the birth cohorts for each
01/09/1999 to 31/08/2000 Uni Year 4
year group 01/09/2000 to 31/08/2001 Uni Year 3
01/09/2001 to 31/08/2002 Uni Year 2
01/09/2002 to 31/08/2003 Uni Year 1
01/09/2003 to 31/08/2004 Year 13
01/09/2004 to 31/08/2005 Year 12
01/09/2005 to 31/08/2006 Year 11
01/09/2006 to 31/08/2007 Year 10
01/09/2007 to 31/08/2008 Year 9
01/09/2008 to 31/08/2009 Year 8
01/09/2009 to 31/08/2010 Year 7
01/09/2010 to 31/08/2011 Year 6
01/09/2011 to 31/08/2012 Year 5
01/09/2012 to 31/08/2013 Year 4
01/09/2013 to 31/08/2014 Year 3
01/09/2014 to 31/08/2015 Year 2
01/09/2015 to 31/08/2016 Year 1
01/09/2016 to 31/08/2017 Reception
01/09/2017 to 31/08/2018 Pre-school
01/09/2018 to 31/08/2019 Nursery
30 September 2021 Return to main menuWeekly number of COVID-19 cases, from Week 15
2021 in:
- nursery/preschool age cohorts
- primary school age cohorts
- secondary school age cohorts
- college/University age cohorts
Above figure: Historic data - Weekly number of COVID-19 cases, from Week 13 2020 to
Week 34 2021Weekly incidence of COVID-19 cases per 100,000
population from Week 15 2021, in:
- nursery/preschool age cohorts
- primary school age cohorts
- secondary school age cohorts
- college/University age cohorts
Above figure: Historic data - Weekly COVID-19 case rate per 100,000,
from Week 13 2020 to Week 34 2021Weekly incidence of COVID-19 cases per 100,000 population in educational age cohorts presented by Year group, from nursery to Year 6, weeks 28 to 38
Weekly incidence of COVID-19 cases per 100,000 population in educational
age groups presented by secondary school year groups (Year 7 to Year 13),
weeks 28 to 38
Weekly incidence of COVID-19 cases per 100,000 population in educational
age cohorts corresponding to university/college year groups, weeks 28 to 38
Weekly incidence of COVID-19 cases per 100,000 population by educational age
cohorts and PHE region, weeks 28 to 38
Weekly number of new COVID-19 cases in educational age cohorts presented
by Year group, from nursery to Year 6, weeks 28 to 38
Weekly number of new COVID-19 cases
in educational age cohorts presented by
Year group, from nursery to Year 6 (from
Week 15 2021)

                                           Above figure: Historic data - Weekly number of COVID-19 cases, from Week 13 2020 to
                                           Week 34 2021
Weekly number of new COVID-19 cases in educational age groups presented by secondary school year groups (Year 7 to Year 13), weeks 28 to 38
Weekly number of new COVID-19
cases in educational age groups
presented by secondary school year
groups (Year 7 to Year 13) (from
Week 15 2021)

                                     Above figure: Historic data - Weekly number of COVID-19 cases, from Week 13 2020 to
                                     Week 34 2021
Weekly number of new COVID-19 cases in educational age cohorts corresponding to university/college year groups, weeks 28 to 38
Weekly number of new COVID-19 cases in
educational age cohorts corresponding to
university/college year groups (from Week 15
2021)

                                               Above figure: Historic data - Weekly number of COVID-19 cases, from Week 13 2020 to
                                               Week 34 2021
Weekly number of new COVID-19 cases by educational age cohorts and PHE Number of new COVID-19 cases region, weeks 28 to 38
Weekly PCR positivity rates of COVID-19 cases in educational age cohorts
presented by Year group, from nursery to Year 6, weeks 28 to 38
Weekly PCR positivity rates of COVID-19 cases in educational age cohorts
presented by secondary school year groups (Year 7 to Year 13), weeks 28 to 38
Weekly PCR positivity rates of COVID-19 cases in educational age cohorts
corresponding to university/college year groups, weeks 28 to 38
Weekly SARS-CoV-2 PCR positivity rates,
                    Week 15 2021 to week 38 2021:
                    - nursery/preschool age cohorts
                    - primary school age cohorts
                    - secondary school age cohorts
                    - college/University age cohorts
                                                                                                    Above figure: Historic data - Positivity rate from Week 13 2020 to
                                                                                                    Week 34 2021

•   Positivity data presented in this report has been calculated only using PCR from week 19 2020
•   Previous reports have also included lateral flow device tests
Weekly rate of individuals tested for SARS-CoV-2 by
PCR per 100,000 population, from Week 15 2021:
- nursery/preschool age cohorts
- primary school age cohorts
- secondary school age cohorts
- college/University age cohorts
Above figure: Historic data - Weekly rate of individuals tested from
Week 13 2020 to Week 34 2021
• Positivity data presented in this report has been calculated only using PCR from week 13 2020
• Previous reports have also included lateral flow device testsSecondary Care surveillance 30 September 2021 Return to main menu
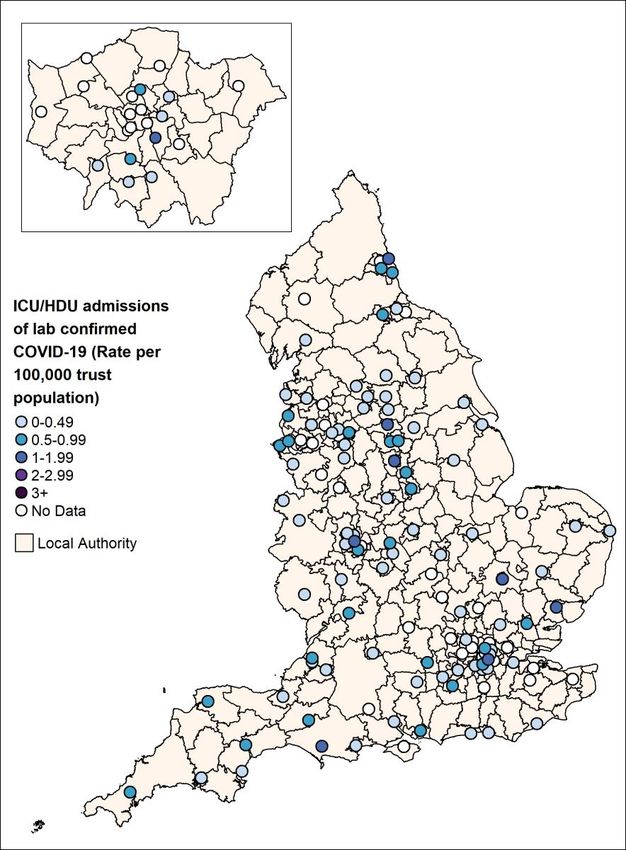
Weekly admission rates for hospital and ICU/HDU laboratory confirmed COVID-
                    19 cases reported through SARI Watch, week 38

30 September 2021                                                          Return to main menu
Age/sex pyramid of hospitalisations (all levels of care) for COVID-19, data
from sentinel acute NHS trusts, England
(a) Peak of 2nd wave (week 53 2020 to (b) Most recent 4 weeks (week 35 to 38
week 3 2021) n= 6,359 2021) n=1,364
80+ 80+
70-79 70-79
60-69y 60-69y
50-59y 50-59y
40-49y 40-49y
30-39y 30-39y
20-29y 20-29y
10-19y 10-19y
Female Female Male
5-9y 5-9y
MaleAge/sex pyramid for admissions to ICU/HDU for COVID-19, mandatory case
level data, acute NHS trusts, England
(a) Peak of 2nd wave (week 53 2020 to (b) Most recent 4 weeks (week 35 to 38
week 3 2021) n= 3,349 2021) n=433
80+ 80+
70-79 70-79
60-69y 60-69y
50-59y 50-59y
40-49y 40-49y
30-39y 30-39y
20-29y 20-29y
10-19y 10-19y
5-9y Female Male
5-9y Female MaleLaboratory confirmed admissions for COVID-19, to acute NHS trusts, by level
of care and ethnicity
(a) Peak of 2nd wave (week 53 2020 to (b) Most recent 4 weeks (week 35 to 38
week 3 2021) 2021)
88.81 89.60
White White
72.06 76.70
7.43 6.28
Asian Asian
17.09 10.99
2.08 2.49
Black Black
7.91 9.69
0.86 Lower level of care (n=5932) 0.77
Mixed ethnic group Mixed ethnic group
1.44 1.83
ICU/HDU (n=3060) Lower level of care (n=1163)
0.86
0.83 Other ethnic group ICU/HDU (n=382)
Other ethnic group 0.79
1.50
0 10 20 30 40 50 60 70 80 90 100
0 20 40 60 80 100
proportion of admitted cases (%) proportion of admitted cases (%)
Reporting trusts Reporting trusts
Lower level of care=21 Lower level of care=15
ICU/HDU=68 ICU/HDU=48
This figure is based on individual patient level data which are provided to SARI Watch from a subset of NHS Acute Trusts, therefore the data should be
interpreted with caution as the distribution of age, sex and ethnic group may not be representative of all hospitalised patients.
Caveat: From week 24 the ethnicity analysis is based on a new method for assigning ethnicity, developed by PHE. The previous method used the most
recent ethnicity recorded through linkage to Hospital Episode Statistics. However, this method led to unfeasibly high rates in the ‘Other’ ethnic group
when applied to COVID-19 cases, hospitalisation or mortality. The new method uses the most frequent ethnicity recorded through linkage to Hospital
Episode Statistics, unless the most frequent was ‘Other’ when the second most frequent was chosen.
30 September 2021 Return to main menuWeekly COVID-19 hospitalisation rate per 100,000 trust catchment population by
age group and region, weeks 29 to 38
30 September 2021 Return to main menuHospital admission rate (excluding ICU/HDU) by ethnicity per 100,000 trust
catchment population
70.00
Per 100,000 Ethnicity-specific Trust Catchment Population
60.00
50.00
40.00
30.00
20.00
10.00
0.00
12 14 16 18 20 22 24 26 28 30 32 34 36 38 40 42 44 46 48 50 52 1 3 5 7 9 11 13 15 17 19 21 23 25 27 29 31 33 35 37
Week Number
White Asian Black Mixed Other
Caveat: From week 24 the ethnicity analysis is based on a new method for assigning ethnicity, developed by PHE. The previous method used the most recent ethnicity
recorded through linkage to Hospital Episode Statistics. However, this method led to unfeasibly high rates in the ‘Other’ ethnic group when applied to COVID-19 cases,
hospitalisation or mortality. The new method uses the most frequent ethnicity recorded through linkage to Hospital Episode Statistics, unless the most frequent was
‘Other’ when the second most frequent was chosen.
30 September 2021 Return to main menuRate of admission to ICU/HDU by ethnicity, per 100,000 trust catchment
population
Per 100,000 Ethnicity-specific Trust Catchment Population 16.00
14.00
12.00
10.00
8.00
6.00
4.00
2.00
0.00
12 14 16 18 20 22 24 26 28 30 32 34 36 38 40 42 44 46 48 50 52 1 3 5 7 9 11 13 15 17 19 21 23 25 27 29 31 33 35 37
Week Number
White Asian Black Mixed Other
Caveat: From week 24 the ethnicity analysis is based on a new method for assigning ethnicity, developed by PHE. The previous method used the most recent ethnicity
recorded through linkage to Hospital Episode Statistics. However, this method led to unfeasibly high rates in the ‘Other’ ethnic group when applied to COVID-19 cases,
hospitalisation or mortality. The new method uses the most frequent ethnicity recorded through linkage to Hospital Episode Statistics, unless the most frequent was
‘Other’ when the second most frequent was chosen.
30 September 2021 Return to main menuMortality surveillance 30 September 2021 Return to main menu
Cumulative mortality rate of COVID-19 cases per 100,000 population tested
                under Pillar 1 and 2 since the beginning of the pandemic by (a) 28 day definition
                and (b) 60 day definition

  (a)                                              (b)

30 September 2021                                                             Return to main menu
Age-adjusted mortality rate** (per 100,000 population) in laboratory-confirmed
cases of COVID-19 by IMD quintile, by week using the 60 day definition
900
800
700
Rate (100,000 population)
600
500
400
300
200
100
0
39 40 41 42 43 44 45 46 47 48 49 50 51 52 53 01 02 03 04 05 06 07 08 09 10 11 12 13 14 15 16 17 18 19 20 21 22 23 24 25 26 27 28 29 30 31 32 33 34 35 36 37 38
Week of Death
1 2 3 4 5
**Rates are time-adjusted: a weekly population denominator has been used to calculate the mortality rate
30 September 2021Possible reinfections in England
(updated monthly – last update 16 September)
30 September 2021 Return to main menuPossible reinfections in England
The following figures present population data based on the first time that individuals tested positive for SARS-CoV-2
through PCR and/ or lateral flow device testing in England together with those who have tested positive for SARS-CoV-
2 through PCR and/ or lateral flow testing with an interval of at least 90 days between two consecutive positive tests.
This excludes positive LFD test results removed from the main SGSS dataset because the LFD test positive result was
followed by a negative PCR result within 3 days and LFD test results where we have had feedback that a positive result
was entered in error. The interval of 90 days is in line with the definition currently adopted within Siren, by CDC in
their definition of a person to prioritise for investigation of suspected SARS-CoV-2 reinfection and the draft definition
being considered by the World Health Organisation for a suspected reinfection.
These figures present population level data that complements studies that can undertake more detailed investigation
at an individual level as exemplified by SIREN the large multicentre prospective cohort study that has followed around
45,000 participants employed by NHS hospitals. In line with other studies, this suggested that those with serological
evidence of a previous SARS_CoV-2 infection had an 84% lower risk of infection than those without evidence of prior
infection over a median 7-month period.
For a possible reinfection to be categorised as confirmed they require sequencing of a specimen at each episode and
for the second specimen to be genetically distinct from that sequenced from the first episode. Availability of such dual
sequencing is currently very low for several reasons; sequencing was not widely undertaken early in the pandemic;
LFD test results do not allow sequencing and some PCR samples have a low viral load where sequencing cannot be
undertaken. To meet the definition of a probable reinfection requires sequencing at the second episode that identifies
a variant that was not circulating at the time of the first episode.
Further data on reinfections is published in the weekly Influenza and COVID-19 surveillance report.
30 September 2021 Return to main menuPossible reinfections in England
It is important to consider reinfections in the context of first infections and there is a 90-day delay before people with a first
infection can become eligible for reinfection. This graph shows: numbers of possible reinfections and numbers of first
infections (secondary Y-axis) by week of onset (based on sample date throughout) through the weeks of the pandemic
30 September 2021 Return to main menuThe age and sex distribution of possible reinfections by overall rate per 1000 first infections
(up to week 34) by sex and age group in England
30 September 2021 Return to main menuCo/secondary infections with COVID-19
(updated monthly – last update 2 September)
30 September 2021 Return to main menuCo/secondary infections with COVID-19
(data updated monthly)
• Caveat - undertesting for other pathogens may result in an underestimate of co/secondary
infection cases.
• Co/secondary infections refers to when a patient has an infection with more than one pathogen
at the same time (co-infection), or acquires another infection after contracting the first
infection (secondary infection).
• Numbers of co/secondary infection remain low across PHE surveillance systems except for
patients with severe respiratory failure requiring Extra Corporeal Membrane Oxygenation
(ECMO). Analysis of COVID-19 cases with severe respiratory failure requiring ECMO indicates
co/secondary infections among these account for just less than a third of all severe respiratory
failure cases due to infection.
• Preliminary data analysis from the first pandemic wave indicates that health care associated
infections, Streptococcus pneumoniae, influenza, Aspergillus and Candidemia cases and cases
with severe respiratory failure requiring ECMO have increased risk of mortality in comparison
to patients without co/secondary infection.
Definitions agreed with DAs
30 September 2021 Return to main menuCo/secondary infections among Extra Corporeal Membrane Oxygenation (ECMO)
patients (patients with most severe clinical respiratory signs)
Analysis is based on cumulative data on ECMO activity from week 40 2019 (30 September
2019) to week 21 2021 (ending 8 August 2021) to cover two complete seasons. This period
includes data from the first and second waves of the pandemic. COVID-19 cases are from
week 05 2020 (commencing 27 Jan 2020) due to retrospective reporting.
• 31% (199/649) of ECMO patients with a laboratory confirmed respiratory infection (all
aetiologies) had a co/secondary infection reported.
• 43% (16/37) of ECMO patients with a laboratory confirmed influenza had co/secondary
infections (data from 2019/2020, no flu admissions to ECMO in 2020/21)
• 30% (168/549) of ECMO patients with laboratory confirmed COVID-19 had co/secondary
infections. Of these 168 cases, the most frequent co/secondary infections in COVID-19
cases were Gram-negative bacilli (n=61) and fungi (n=33), accounting for 56% (94/168).
30 September 2021 Return to main menuBloodstream & respiratory infections (bacterial & fungal co/secondary infections)
& Clostridioides difficile infections, in COVID-19 patients diagnosed in England in
wave 2 (29 June 2020 to 30 April 2021 incl.) & wave 3 (1 May 2021 to 6 June 2021
incl.)
• In Wave 2 0.2% of COVID-19 patients had a key bacterial/fungal co/secondary infection, while in
Wave 3 it was 0.1%, where a coinfection is defined as a positive bacterial/fungal isolate±1 day of
first SARS-CoV-2 positive specimen date and a secondary infection defined as a positive
bacterial/fungal isolate identified between 2 days andCo/secondary infection with respiratory viruses, vaccine preventable bacteria and
fungi
First Wave Second Wave Third Wave
Bacteria/Fungi/Virus (30 Jan 2020 - 28 June (29 June 2020 – 30 April (1 May 2021 – 24 August Total Cases
2020) 2021) 2021)
Influenza A 33 3 2 38
Influenza B 13 7 3 23
Influenza A & B 1 0 0 1
Flu (not typed) 1 0 0 1
Parainfluenza (any subtype) 14 10 17 41
Seasonal coronavirus 111 52 18 181
Enterovirus 5 7 3 15
Adenovirus 14 14 5 33
Rhinovirus 97 61 15 173
RSV 23 3 83 109
Human metapneumovirus 55 1 6 62
Aspergillus fumigatus ISOLATES
46 (4) 120 (2) 32 (1) 198 (7)
(azole resistant)
Probable/Proven cases of CAPA 15 38 8 61
Candida spp.: Candidemia 63 133 4 200
Bordetella pertussis 0 0 0 0
Haemophilus influenzae 3 2 0 5
Neisseria meningitidis 2 0 0 2
Streptococcus pneumoniae 40 45 6 91
Please note fungal data refers to secondary infections only.
The UK moved out of influenza season in early 2020 (for the 2019/20 season) when COVID-19 began to increase in March 2020.
Data contains results from two systems (Respiratory DataMart system and SGSS). Coinfection is defined as their sample datesYou can also read