EVALUATING THE UNCERTAINTIES IN NEW ZEALAND'S GIS DATASETS; UNDERSTANDING WHERE AND WHEN FRAMEWORKS SUCH AS LUCI CAN ENABLE ROBUST DECISIONS ...
←
→
Page content transcription
If your browser does not render page correctly, please read the page content below
Taylor, A. I., Jackson, B.M. and Metherell, A.K.2018. Evaluating the uncertainties in New Zealand’s GIS datasets; understanding where and
when frameworks such as LUCI can enable robust decisions surrounding farm management practices. In: Farm environmental planning –
Science, policy and practice. (Eds L. D. Currie and C. L. Christensen). http://flrc.massey.ac.nz/publications.html. Occasional Report No. 31.
Fertilizer and Lime Research Centre, Massey University, Palmerston North, New Zealand. 12 pages.

       EVALUATING THE UNCERTAINTIES IN NEW ZEALAND’S GIS
DATASETS; UNDERSTANDING WHERE AND WHEN FRAMEWORKS
 SUCH AS LUCI CAN ENABLE ROBUST DECISIONS SURROUNDING
                                 FARM MANAGEMENT PRACTICES

                         Alicia Taylor1,2, Bethanna Jackson1 & Alister Metherell2
 1
     School of Geography, Environment & Earth Sciences, Victoria University of Wellington, Wellington
                                              2
                                                  Ravensdown Ltd, Christchurch
                                           Email:Alicia.Taylor@ravensdown.co.nz

Introduction
The connection between agricultural activities and water quality degradation is not new, with
many studies identifying forms of diffuse pollution such as nitrogen, phosphorus and sediment
emitted from intensive agriculture. While the quantities of nutrients lost from agriculture are
not large compared to the total nutrients residing in the soil-plant-animal system, the transfer
of nutrients from agricultural land to water causes significant environmental impact (Monaghan
et al., 2007). With increasing attention on more sustainable land-use practices and mitigating
the impact of agricultural intensification on the environment, decision support tools like the
Land Utilisation and Capability Indicator (LUCI) are well suited to aid agricultural
management, at both small and large scales (Trodahl et al., 2017).

This paper discusses how the varying quality and resolution of New Zealand’s soil and elevation
datasets impact LUCI’s output. One case study is presented on the application of LUCI’s
Nitrogen to Water and Phosphorus to Water tools to a farm located on the Canterbury plains.
Four different data combinations are carried out, using both freely and nationally available
topography and soil data in the form of the NZSoSDEM 15m national digital elevation model
(DEM) generated by the Otago School of Surveying (available from koordinates.com) and the
Fundamental Soil Layer (FSL- available from https://lris.scinfo.org.nz/). The two remaining
datasets are not currently freely available or of full national coverage, with the 2m DEM sourced
from Environment Canterbury and S-Map soil data available under license from Landcare
Research (smap.landcareresearch.co.nz/).

LUCI
LUCI, described in detail in Jackson et al. (2013); Sharps et al. (2017); and Trodahl et al. (2017)
is a GIS-based framework that explores land management scenarios to identify locations where
changes in land use might deliver improvements in ecosystem services, or where trade-offs
between services are present (Sharps et al., 2017). The algorithms in LUCI include an
exploration of the impacts of land management changes on flood risk, habitat connectivity,
erosion and sedimentation, nutrient movements, carbon sequestration and agricultural
productivity. This research is solely focused on LUCI’s ability to model and track the flow of
nitrogen, phosphorus and sediment across the landscape to waterways.

A benefit of using LUCI to model and understand the complex interaction between nutrients,
sediment and water quality on a farm system is that it is spatially explicit. Using the different

                                                                     1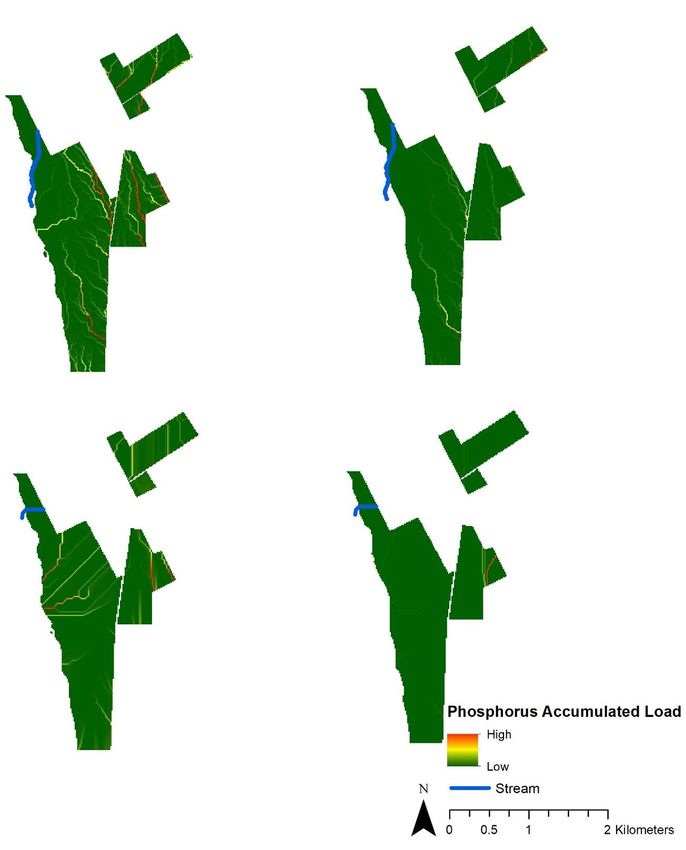
tools within the framework the user can track changes across the entire farm, or within smaller
blocks, enabling mitigation strategies that improve water quality to be effectively targeted.
Minimum base data required for LUCI is a DEM, soil and land cover data. These can be sourced
from nationally available datasets. However, the addition of further national or local data along
with stakeholder consultation can improve the accuracy of LUCI's output (Figure 1).

Figure 1- LUCI process diagram, based on Figure 1 in Trodahl et al. (2017)

The Nitrogen to Water and Phosphorus to Water tools use an export coefficient approach to
model nitrogen and phosphorus lost to water in kg/ha/yr. The export coefficient approach
describes the rate at which a contaminant is input into a water body per unit of source area, in
this case, the unit area is one DEM grid cell (White et al. 2015). These export coefficients are
linked to land cover classification, climate and region being modelled and are commonly used
to represent the movement of diffuse pollution in the landscape (Trodahl et al., 2017).

Soil Data
To test how varying quality and resolution of New Zealand’s soil data effects LUCI’s output,
two soil maps were used to produce estimates of nitrogen and phosphorus lost from one site.
The Fundamental Soil Layer combines the polygons in the New Zealand Land Resource
Inventory (NZLRI) with the soil data from the National Soil Database (NSD). In the Canterbury
region, this information was based on the original Plains and Downs Survey at a scale of 1:126
720 (Kear et al. 1967). Expert knowledge along with consultation with stakeholders merged the
existing soil profiles and determined the seventeen soil attributes that the FSL describes
(Barringer et al., 2016). The second dataset used, S-map, has been under development since
2003 and is the newest soil database covering New Zealand. This dataset incorporates the
historic data held within the NSD with new soil surveys and fills in data gaps with an inference
engine which uses rule-based validation to infer soil properties if unavailable from the measured
data (Lilburne et al., 2012). S-Map is designed to be used at scales between 1:50 000 and 1:20
000 and users need to consider the implications of using this dataset outside of the scale of
analysis it was designed for (S-MapOnline, 2018).

Topographic Data
The only nationally available DEMs are derived from the LINZ NZTopo50 database with 20
m contours. Columbus et al. (2011) interpolated a 15m2 DEM from this data choosing this
resolution as a balance providing a DEM of reasonable spatial resolution, without creating a
                                                   2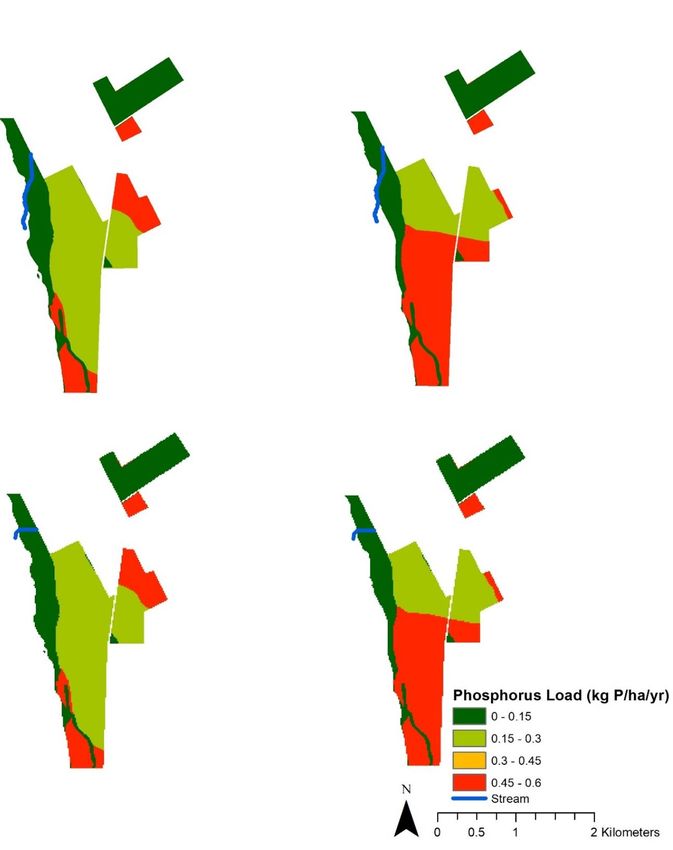
file so large that it would often be impractical to be used in research. National coverage of
   LiDAR (Light Detecting and Ranging) data is not yet available. However, regional councils
   hold LiDAR data over some or (in the case of Greater Wellington) all of their region, which
   can be used to create fine resolution DEMs if researchers are allowed access. LINZ is actively
   procuring LiDAR data from the separate databases held by councils and private companies to
   facilitate access (LINZ, 2018).

   Case Study: North Canterbury
   The study site is a 309ha sheep and beef farm located
   in North Canterbury in the Ashley watershed (Figure
   2). The terrain is mostly flat, with a mix of brown, pallic
   and recent soil orders (Figure 3). There is a steep
   escarpment and one permanent stream on the property.
   FSL and S-Map soil datasets and DEMs at 15m and 2m
   resolution are available for this study site. For the
   results presented in this paper land cover data is taken
   from the national LCDB4 database which classed 67%
   of the farm area as high producing grassland and 23%
   as rotational cropland (Figure 4). The other smaller
   areas classified were exotic forest, gorse and deciduous
   hardwoods.

                                                                 Figure 2- Location of study site.

Figure 3- Soil order classification in FSL and S-Map.

                                                        3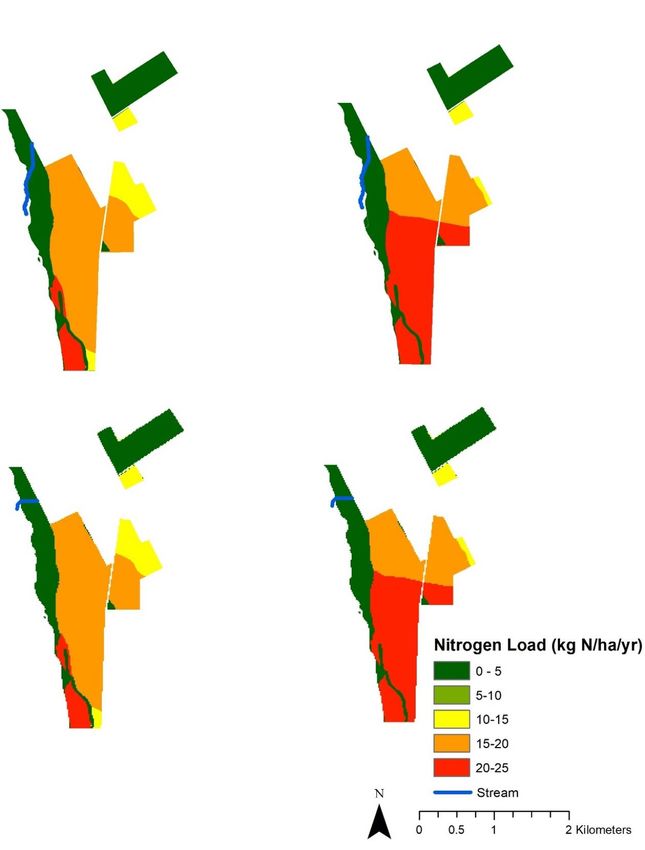
Method
                                                             LUCI water quality models (Nitrogen to
                                                             Water and Phosphorus to Water) were
                                                             run using four combinations of soil and
                                                             topographic data (Table 1). In general,
                                                             default parameters were used, except
                                                             when the default values clearly showed
                                                             a deviation from the real word
                                                             characteristic of the landscape. The
                                                             nitrogen and phosphorus load estimates
                                                             were then analysed in Matlab to
                                                             understand the distribution of load
                                                             estimates and the probability of a loads
                                                             occurrence on the landscape. In Matlab
                                                             the load results from each cell were then
                                                             summed across the landscape to
                                                             calculate the total load on the farm in kg
                                                             N(P)/yr.

 Figure 4- Land use classification in the LCDB4

Table 1- Data input for the four LUCI applications

 LUCI Application          Soil Data                     Topographic Data
 S-Map 2m                  S-Map (1:50 000)              LiDAR (2m)
 S-Map 15m                 S-Map (1:50 000)              National DEM (15m)
 FSL 2m                    FSL (1:126 720)               LiDAR (2m)
 FSL 15m                   FSL (1:126 720)               National DEM (15m)

Results and Discussion
LUCI Nitrogen to Water and Phosphorus to water tools produce a variety of outputs that allow
the user to explore total nitrogen and phosphorus loads on the landscape (kg nutrient/ha/yr) and
accumulated total loads (kg nutrient/yr). Accumulated load considers the nutrient load at any
point plus the contribution to that cell from “uphill” sources (Jackson et al., 2013). The results
are represented by a traffic light colour scheme where red indicates high nutrient loads and
green indicates low nutrient loads (note this is a reversal of the original colour scheme presented
in Jackson et al. (2013), in use until a change in 2017).

Nitrogen loads from the four applications are shown in Figure 5 and nitrogen accumulated load
is shown in Figure 6. The distribution of high and low nitrogen loads can be seen to follow the
pattern of each applications input soil data (Figure 3). The changing ratio of brown, pallic and
recent soil order classifications across the farm when using the newer, S-Map dataset, resulted
in the reduction in the high load estimates classified as recent soil in the FSL as this area was
reclassified as a brown soil. The area classified as pallic soil remained as a low nitrogen load.
This was expected as pallic soils leach less nitrogen due to increased denitrification and lower
drainage rates compared to well drained recent and brown soils (Pollacco et al., 2014).

                                                     4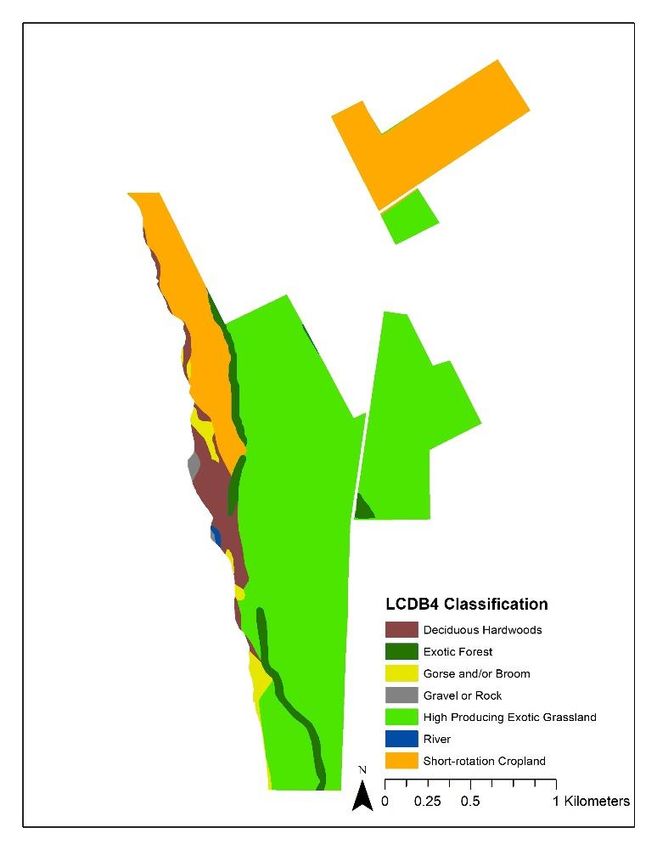
While the highest estimates of total nitrogen load remain the same for the applications using
identical soil data, the two FSL applications estimated a higher total nitrogen load, as shown in
Table 2. The highest total nitrogen load was 4,443 kg N/yr calculated from FSL 15m, with the
second highest estimate from FSL 2m, this pattern is present in the total estimates of phosphorus
as well. This indicates that the source of soil data plays a more significant role on the results of
total nutrient loads then the resolution of the DEM.
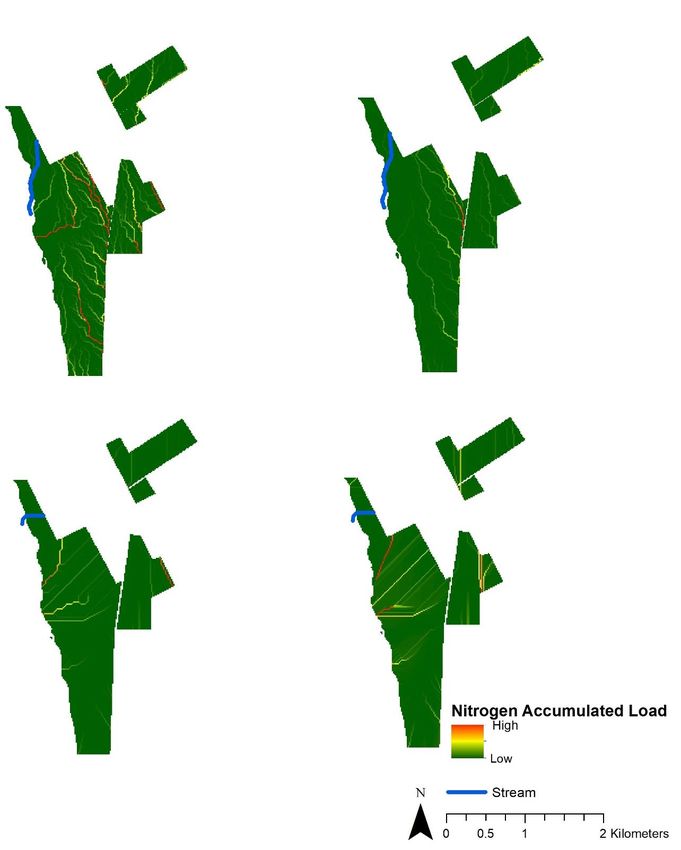
However, when looking at the outputs of accumulated nutrient load on the landscape, the effect
of the different soil datasets is not apparent and instead, the changing resolution of the DEM is
the main cause of difference between the applications. When looking at the accumulated loads
of S-Map 2m and S-Map 15m, it is apparent that the 15m DEM is estimating different pathways
to the 2m DEM and this is the same when comparing FSL 2m and FSL 15m. Since LUCI
estimates accumulated load using a topographic routing algorithm that associates soil, climate,
slope based on the grid size of the DEM provided, when using a lower resolution DEM, the
microtopography present on the farm is not picked up by the algorithm and the accumulated
load patterns are not realistic in this relatively flat landscape. LUCI’s estimates of accumulated
load differ between DEM resolution regardless of what soil dataset is used.
5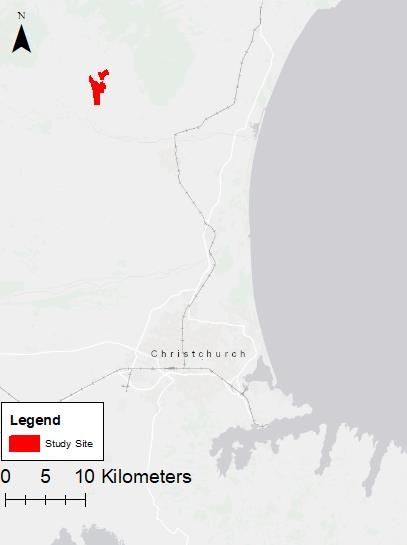
S-Map 2m                                      FSL
                                                      B 2m

      S-map 15m                                    FSL 15m

Figure 5- LUCI's estimates of Nitrogen Load using all data input scenarios.

                                                    6
S-Map 2m FSL 2m
S-Map 15m FSL 15m
Figure 6- LUCI's estimates of Nitrogen Accumulated Load using all data input scenarios.
Table 2- Total Nitrogen Loads calculated from all applications
LUCI Application Total Nitrogen Total Phosphorus
Load (kg N/yr) Load (kg P/yr)
S-Map 2m 3,691 57.2
S-Map 15m 3,713 57.8
FSL 15m 4,401 89.2
FSL 15m 4,443 90.1
7Not only is soil classification effecting LUCI’s estimates of nitrogen loads but the land cover
classification in the LCDB4 has resulted in load inconsistencies. The estimates of nitrogen loads
along the river flat on the western edge of the farm vary despite being classed as recent soils in
both FSL and S-Map datasets. The reason for the different loading estimates along this block is
the classification of the upper northern part as cropland and the southern half as high producing
grassland (Figure 4). In reality, the entire river flat is covered by high producing grassland,
showing the importance of understanding the underlying data used in models such as LUCI,
and if available, the importance of using high resolution, site specific land cover data. For farm
scale use land use information would normally be derived from an Overseer nutrient budget
and associated farm management block map as these provide LUCI with information on the
cropping practices, fertiliser and irrigation management present on this farm.
Phosphorus load estimates also follow the pattern in soil input data (Figure 7). Again, FSL 2m
and FSL 15m estimate higher phosphorus loads then their S-map counterparts, with FSL 2m
estimating 89.2 kg P/yr and S-Map 2m estimating 57.2 kg P/yr (Table 2). Comparing the load
of individual cells with the same soil order between applications, the values are similar, so the
reason for the 32 kg P/yr difference between S-Map and FSL applications can be attributed to
the classification change from recent to brown soil over the main block of the farm (this is the
most significant area of difference between the two soil maps). The accumulated phosphorus
load results show a similar pattern to the accumulated nitrogen load output, where the effect of
the lower resolution DEM results in a different representation of accumulated load across the
landscape (Figure 8).
8S-Map 2m FSL 2m
S-Map 15m FSL 15m
Figure 7-LUCI's estimates of Phosphorus Load using all data input scenarios.
9S-Map 2m FSL 2m
S-Map 15m FSL 15m
Figure 8-LUCI's estimates of Phosphorus Accumulated Load using all data input scenarios.
It is important to note the different pathways of nutrient movement through a farm system.
Nitrogen is easily lost by leaching to ground water, whereas, phosphorus is mainly lost through
runoff and erosion (McDowell and Condron, 2004). While phosphorus loss from farm is in
smaller quantities then the total amount present in the soil, only a small quantity of phosphorus
entering a water body causes significant environmental damage through the enhanced growth
of aquatic weeds and algae (McDowell and Condron, 2004). The area of pallic soil has been
classified as cropland in the LCDB4, resulting in low predicted phosphorus losses on this site,
again highlighting the importance of site specific landcover data. Pallic soils are naturally prone
to pugging due to the impermeable nature of the soil, this means that surface water rich in
10phosphorus can be lost to water bodies via surface runoff (FLRC, 2016). Pallic soils have low
P retention meaning that little phosphorus is removed from the soil solution and held on the
surface of soil colloids. Given this case study has a flat topography, with the only area of major
elevation change (the river escarpment) covered in forest, phosphorus loss on this site is not as
large or complex as expected loss from a site with rolling, steep hill topography.
Conclusion
In this case study, LUCI’s estimates of nitrogen and phosphorus load lost from the landscape
are affected by the soil data used as input to the model. The changing classification from recent
to brown soil with the newer, S-Map dataset, results in reduced estimates of nitrogen and
phosphorus loads on this farm. Load estimates are also dependant on land use. Accumulated
load patterns however, are not sensitive to changing the source of the soil data and instead, the
resolution of the DEM used in each application had the most pronounced effect. These
relationships between difference soil datasets and DEM resolutions are being explored further
in five other case studies. These sites are located in both the North and South Island, ensuring
different climates, land management practices, soil datasets and topography are incorporated
this analysis of the LUCI model.
Acknowledgements
Thanks to Ravensdown, Callaghan Innovation and Victoria University for supporting this
project. S-Map and FSL data used in this research reproduced with the permission of Landcare
Research New Zealand Limited. The LiDAR data for this site is part of the 2005 Waimakariri
LiDAR survey, owned by Waimakariri District Council and Environment Canterbury and the
National 15m DEM was created by the University of Otago School of Surveying. Both datasets
are licensed under Creative Commons Attribution 3.0 New Zealand.
References
Barringer, J.R.F., Lilburne, L., Carrick, S, Webb, T., $ Snow, V. (2016). What difference does
detailed soil mapping information make? A Canterbury case study. In: Integrated nutrient and
water management for sustainable farming. (Eds L.D. Currie and R.Singh).
http://flrc.massey.ac.nz\publications.html. Occasional Report No. 29. Fertilizer and Lime
Research Centre, Massey University, Palmerston North, New Zealand. 12 pages.
Columbus, J., Sirguey, P., & Tenzer, R. (2011). A Free Fully Assessed 15 m DEM for New
Zealand. Survey Quarterly, (66), 16–19.
Fertiliser and Lime Research Center. (2016). Sustainable Nutrient Management in New
Zealand Agriculture. Massey University, Palmerston North, New Zealand.
Jackson, B., T. Pagella, F. Sinclair, B. Orellana, A. Henshaw, B. Reynolds, N. Mcintyre, H.
Wheater & A. Eycott. (2013). Polyscape: A GIS mapping framework providing efficient and
spatially explicit landscape-scale valuation of multiple ecosystem services. Landscape and
Urban Planning 112:74-88.
Kear, B.S., Gibbs, H.S., & Miller, R.B. (1967). Soils of the downs and plains, Canterbury and
North Otago, New Zealand. Soil Bureau Bulletin 14, New Zealand Soil Bureau, Department
of Scientific and Industrial Research, Wellington. 92 p.
11Lilburne, L.R., Hewitt, A.E., & Webb, T.H. (2012). Soil and informatics science combine to
develop S-map: a new generation soil information system for New Zealand. Geoderma 170,
232–238.
Land Information New Zealand (LINZ). (2018). LINZ Data Service. In
https://data.linz.govt.nz/group/national-elevation/data/category/elevation/. Accessed 20 Feb
2018.
R. W. McDowell & L. M. Condron .(2004). Estimating phosphorus loss from New Zealand
grassland soils, New Zealand Journal of Agricultural Research, 47:2, 137-145, DOI:
10.1080/00288233.2004.9513581
Monaghan, R. M., Wilcock, R. J., Smith, L. C., Tikkisetty, B., Thorrold, B. S., & Costall, D.
(2007). Linkages between land management activities and water quality in an intensively
farmed catchment in southern New Zealand. Agriculture, Ecosystems & Environment, 118,
pp.211–222. https://doi.org/10.1016/j.agee.2006.05.016
Pollacco, J.A.P., Lilburne, L.R., Webb, T.H., & Wheeler, D.M. (2014). Preliminary
assessment and review of soil parameters in OVERSEER® 6. Landcare Research Contract
Report LC2002, Landcare Research, Lincoln, New Zealand.
Sharps, K., Masante, D., Thomas, A., Jackson, B., Redhead, J., May, L., Prosser, H., Cosby,
B., Emmett, B. & Jones, L. (2017). Comparing strengths and weaknesses of three ecosystem
services modelling tools in a diverse UK river catchment. Science of the Total Environment,
584, pp.118-130.
S-MapOnline. (2018). Data Provenance. https://smap.landcareresearch.co.nz/data-
provenance/. Accessed 21 February 2018.
Trodahl, M. I., Jackson, B. M., Deslippe, J. R., & Metherell, A. K. (2017). Investigating
trade-offs between water quality and agricultural productivity using the Land Utilisation and
Capability Indicator (LUCI)–A New Zealand application. Ecosystem Services, http://dx.
https://doi.org/10.1016/j.ecoser.2016.10.013
White, M., D. Harmel, H. Yen, J. G. Arnold, M. Gambone & R. Haney. (2015). Development
of sediment and nutrient export coefficients for U.S. Ecoregions. Journal of the American
Water Resources Association 51(3):758-775.
12You can also read