MAPPING OF THE CATCHING AREA SKIPJACK TUNA - Global Scientific Journal
←
→
Page content transcription
If your browser does not render page correctly, please read the page content below
GSJ: Volume 9, Issue 1, January 2021
   ISSN 2320-9186                                                                                    1178

                GSJ: Volume 9, Issue 1, January 2021, Online: ISSN 2320-9186
                                          www.globalscientificjournal.com

MAPPING OF THE CATCHING AREA SKIPJACK TUNA
FISH (Katsuwonus pelamis) BASED ON CHLOROPHY-
A DISTRIBUTION LANDED IN PPN PALABUHANRATU
Breagitta Dwi Yuniarto *, Herman Hamdani **, Izza Mahdiana Apriliani**, and Lantun Paradhita Dewanti **

*) Students of the Faculty of Fisheries and Marine Sciences, Padjadjaran University
**) Lecturer at the Faculty of Fisheries and Marine Sciences, Padjadjaran University

Fisheries Study Program, Faculty of Fisheries and Marine Sciences, Padjadjaran University

                                                      Abstract
This study aims to determine the potential fishing area for skipjack tuna (Katsuwonus pelamis) landed at
PPN Palabuhanratu Sukabumi, West Java based on the distribution of chlorophyll-a. The method used is a
survey method. Primary spatial data in the northern waters of Palabuhanratu are chlorophyll-a data, and
skipjack tuna fishing production data. Chlorophyll-a data is obtained from satellite images downloaded
from the websitehttp://oceancolor.gsfc.nasa.gov/cms, while the fishing production data of skipjack tuna is
obtained fromPPN Palabuhanratu, West Java. Based on the data obtained, it can be concluded that the
highest amount of catch occurred in 2015 with a total of 606,044 kg and the lowest was in 2016 with a total
of 134,792 kg. This is due to high market demand in 2015 which resulted in a drastic decline in the
following year. HThe catch of skipjack tuna is only 0.79% influenced by the distribution of chlorophyll -a
and 99.21% is influenced by other factors because chlorophyll-a is not the only indicator used to identify
potential fishing areas. Apart from chlorophyll-a, there are other indicators that are usually used to
determine potential fishing areas, namely sea surface temperature and currents. The relationship between
the distribution of sea surface temperature and the catch has a very weak relationship with a correlation
coefficient of 0.0888 and is obtained10 DPI in Palabuhanratu waters are identified, there are 5 DPI which
are included in the category of potential fishing areas, 4 in the medium category and 1 in the less potential
category.

Key words: skipjack tuna, fishing area, Palabuhanratu

                                                     GSJ© 2021
                                             www.globalscientificjournal.com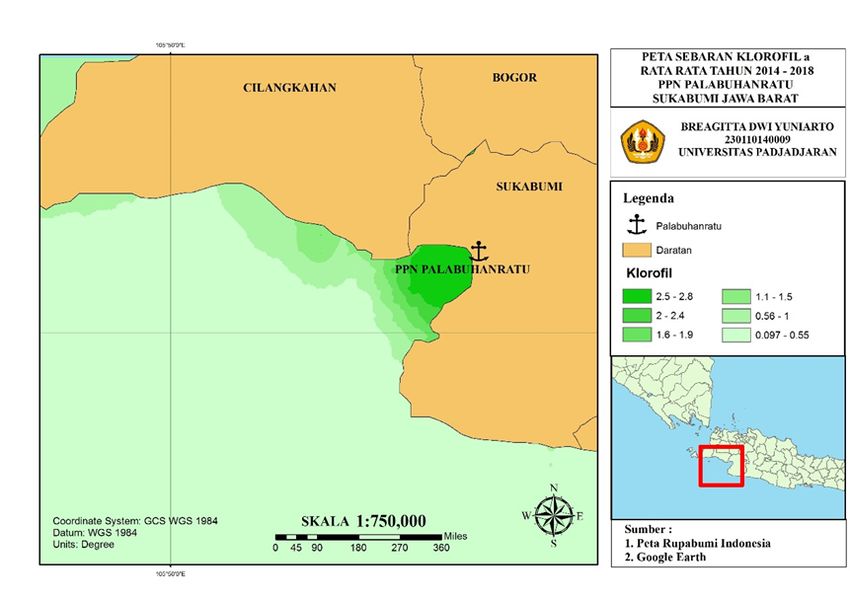
GSJ: Volume 9, Issue 1, January 2021
   ISSN 2320-9186                                                                                      1179

PRELIMINARY
      Palabuhanratu is an important location for capture fisheries on the southern coast of West Java. One
of the dominant catches and has an important economic value landed in PPN Palabuhanratu is skipjack
tuna (Katsuwonus pelamis). The statistical data of PPN Palabuhanratu fishery in 2005-2008 shows the
amount of skipjack fishing production has decreased every year. Therefore we need an alternative
sustainable management so that the skipjack fishery remains sustainable, by conducting a study on growth,
mortality, exploitation rates and potential areas of skipjack tuna landed at PPN Palabuhanratu.
      Skipjack tuna (Katsuwonus pelamis) is a type of pelagic fish that has an important economic value in
Indonesian marine waters. As part of the tuna resources, skipjack tuna is a source of animal protein that is
beneficial to the community. Skipjack tuna is one of Indonesia's export fishery commodities to countries,
such as Korea, Japan, Vietnam, Iran and Australia so that it can contribute to increasing foreign exchange
(Gigentika 2012). Skipjack tuna can be found in Palabuhanratu Sukabumi, West Java.
      Barnes and Hughes (1988) chlorophyll-a is a pigment capable of photosynthesis and is present in all
autotrophic organisms. Phytoplankton as primary producers is the base of the food chain and is the basis
that supports the life of all other biota. Furthermore, the phytoplankton will be eaten by early eaters
(primary consumers) and subsequent eaters. The high concentration of chlorophyll-a indicates many
natural food sources for fish. So that fish tend to occupy a lot of areas that are rich in food sources (Nontji
2002).
      .
      This study aims to determine the potential fishing area for skipjack tuna (Katsuwonus pelamis)
landed at PPN Palabuhanratu Sukabumi, West Java based on the distribution of chlorophyll-a.

MATERIALS AND METHODS

Time and place
        This research will be carried out in two stages. The first stage is the data collection stage in the
waters of Palabuhanratu, West Java with the Palabuhanratu Fishery Port (PPN) fishing base which was held
in February 2019. The second stage was carried out in September 2018 by downloading chlorophyll-a
satellite image data from the NASA database (Oceancolor). .gsfc.nasa.gov) in the 2014 - 2018 period.

Tools and Materials
         The tools used in this research are Microsoft Excel 2016 software, arc GIS 10.3 and seaDAS
Stationery, to record all important things during research. Camera, for documentation during research
activities.
Questionnaire sheet, to obtain data from fishermen and abk. Laptop, to process data. The materials used in
this research are production data of skipjack fish catches for 5 years at the PPN Palabuhanratu fishing base,
Aqua-MODIS         chlorophyll-a     satellite   image       data    downloaded        from     the     NASA
database,http://oceancolor.gsfc.nasa.gov/cms.

Research methods

         The method used is a survey method. Primary spatial data in the northern waters of Palabuhanratu
are chlorophyll-a data, and skipjack tuna fishing production data. Chlorophyll-a data is obtained from
satellite images downloaded from the website http://oceancolor.gsfc.nasa.gov/cms, while skipjack fishing
production data is obtained from PPN Palabuhanratu, West Java. In addition, to validate the fishing position
data obtained, interviews were conducted with several fishermen in the PPN Palabuhanratu area.
Furthermore, the data is processed using software that produces a horizontal profile output and spatial
analysis descriptively.

Research procedure
         The method used is a survey method. Primary spatial data in the northern waters of Palabuhanratu
are chlorophyll-a data, and skipjack tuna fishing production data. Chlorophyll-a data is obtained from
satellite images downloaded from the website http://oceancolor.gsfc.nasa.gov/cms, while skipjack fishing
production data is obtained from PPN Palabuhanratu, West Java. In addition, to validate the fishing position

                                                  GSJ© 2021
                                          www.globalscientificjournal.com
GSJ: Volume 9, Issue 1, January 2021
ISSN 2320-9186 1180
data obtained, interviews were conducted with several fishermen in the PPN Palabuhanratu area.
Furthermore, the data is processed using software that produces a horizontal profile output and spatial
analysis descriptively.
Chlorophyll-a data that has been downloaded from the website is then opened using SeaDAS
software to carry out the cropping process for the area to be used in research. To change the cropped .nc
data so that it can be read by ArcMap software and to remove missing data, further data processing is
carried out in Microsoft Excel then the data interpolation process is carried out in ArcMap software to
determine the distribution of chlorophyll-a in the Palabuhanratu Waters. .
The visualization of the distribution of chlorophyll-a was done by combining the processed
chlorophyll-a image data and the Skipjack tuna fishing location data using ArcGIS 10.3 software. The
processed chlorphyll-a distribution map is then overlaid with the coordinates of the location of fishing
activities. The results will be known coordinates with the optimum chlorophyll-a value and potential catch.
The relationship between the catch and the chlorophyll-a concentration was known through spatial
analysis between chlorophyll-a and catch. To determine the degree of relationship between the catch
variable and the chlorifl-a variable, a correlation analysis was performed. The higher the correlation value,
the tighter the relationship between the two coefficients. Correlation analysis was performed using
Microsoft Excel software. The degree of relationship is expressed by the correlation coefficient (r). The
higher the r value indicates a tighter relationship (Walpole 1995).
PThe determination of potential fishing areas (DPI) is based on three indicators, namely the
number of fish caught, the length, and the distribution of chlorophyll-a values in the fishing area. To assess
the length of the fish used a scoring method based on the assessment of the length of the skipjack tuna.
RESULTS AND DISCUSSION
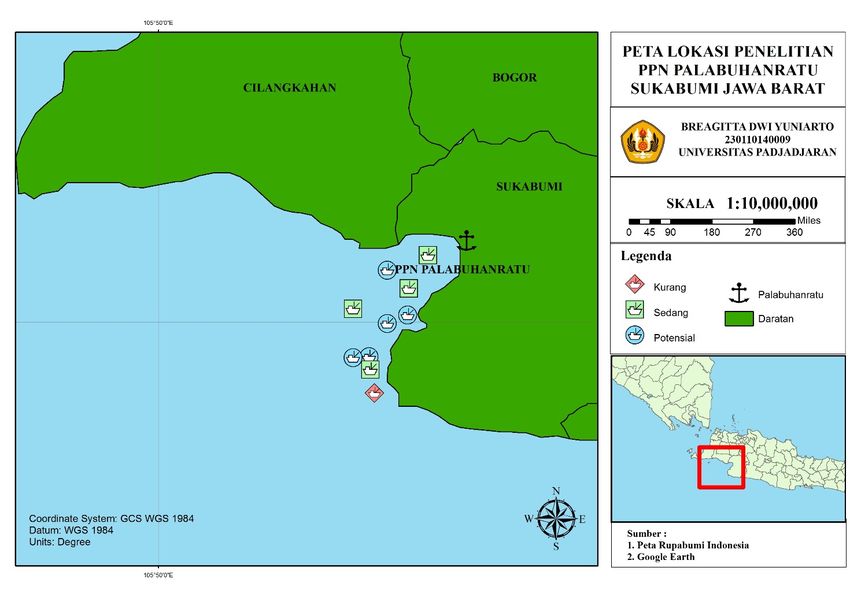
1. General Condition of Palabuhanratu Waters
Palabuhanratu District is in Sukabumi Regency which has eight villages or sub-districts including
Palabuhanratu, Citarik, Citepus, Cibodas, Pasirsuren, Cikadu, Tonjong, and Buniwangi villages.
Astronomically the Palabuhanratu area is at 1060 31 East Longitude - 1060 37 East Longitude and between
60 57 LS - 7 0 04 LS, administratively Palabuhanratu District is directly adjacent to Cikakak and Cikondang
Districts in the north, Cimanggu District in the east, Simpenan District in the south and West Palabuhanratu
Bay The length of the Palabuhanratu water beach is 7.9 km with a sandy beach type. Pelabuhanratu is
famous as the main producer of marine fisheries in Sukabumi Regency. Pslabuhanratu waters are located
on the southern coast of Java Island which is directly opposite the Indian Ocean.
Fishing business activities in Palabuhanratu are currently taking place freely (open access) without
clear rules and controls so that all fishermen and fishing gear in the district / city coastal areas are free to
access to catch skipjack. Until now, skipjack fishing has been carried out without clear regulations in
accordance with the principles of fishery resource management. Fishermen have a tendency whenever and
wherever they are free to catch, including fish that are not yet fit to be caught. For the purposes of fish
resource management, information on the size composition, growth patterns and size of fish that are fit to
catch (legal size) will be very important.
2. Distribution of Chlorophyll-a in Palabuhanratu Waters
This research was conducted in April 2019 in Palabuhanratu Bay, Sukabumi, West Java. The
distribution value of chlorophyll -a is obtained from the Aqua Modis satellite image data. Based on the data
obtained in 2014 to 2018, the highest chlorophyll value was 4.7 mg / m3 in December 2018 while the
lowest value was 0.0 mg / m3 in November 2016. Overall the chlorophyll data obtained can be projected on
the map in Figure 1.
GSJ© 2021
www.globalscientificjournal.comGSJ: Volume 9, Issue 1, January 2021
ISSN 2320-9186 1181
Picture 1. Map of chlorophyll-a distribution in Palabuhanratu waters
Based on the data obtained, during the last five years (2014-2018) the highest value of chlorophyll
distribution occurred in December 2018 and February 2017. The high distribution of chlorophyll-a in
December 2018 and February 2017 was thought to be due to the upwelling phenomenon.
3. Catch of Skipjack Catch at PPN Palabuhanratu
The catch of skipjack tuna at PPN Palabuhanratu from 2014 to 2018 fluctuates every month. The
fluctuations that occur can be seen in Figure 2
Figure 2. Fluctuation of Skipjack Catch Results 2014-2018
GSJ© 2021
www.globalscientificjournal.comGSJ: Volume 9, Issue 1, January 2021
ISSN 2320-9186 1182
Based on the data obtained, it can be concluded that the highest amount of catch occurred in 2015
with a total of 606,044 kg and the lowest was in 2016 with a total of 134,792 kg. This is due to high market
demand in 2015 which resulted in a drastic decline in the following year. There is a tendency for excessive
exploitation in peak production years to be followed by a very sharp decline in production in the following
year (Inaya 2004 in Zakiah 2015). In June 2015, the highest catch of skipjack tuna was 257,131 kg while the
lowest was 3,082 kg in January 2018.
4. Determination of Skipjack Fishing Areas
The fishing area is an important factor in determining the success or failure of a fishing effort.
Knowing the right fishing area according to the lightened main catch can help fishermen so that their
fishing efforts can be more effective and efficient.
Fishermen who land skipjack tuna at PPN Palabuhanratu usually use boats with a capacity of three
to six GT and use trolling rods. For navigation aids used only a simple compass and GPS which are operated
by the steering wheel. In determining the catchment area of skipjack tuna, so far, it only relies on the
knowledge obtained from parents who have experience that can be considered very traditional.
The author has assessed the determination of the fishing area using the scoring method based on
the variables that have been mentioned, namely the catch, the distribution of chlorophyll a and the weight
of the fish, the results can be seen in table 1
.
Position
DPI indicator
DPI category
DPI
to- Chlorophyll Size Length
Catch Yield (Kg)
Latitude Longitude (mg / m3) (cm)
Total
Score Weight Score Weight Score Weight Category
weight
7.00- 106,33- 18723 5 3 5 13 p
1 0.32 37.2
7.04 106,38
7,25- 106,33- 6734 1 3 5 9 s
2 0.47 42.3
7,29 106,38
7,33- 106.38- 20678 1 1 5 7 k
3 0.25 38.6
7,38 106.42
7,13- 106.38- 24824 5 3 5 13 p
4 0.84 42.6
7,17 106.42
7,21- 106.29- 50127 5 3 5 13 p
5 0.47 32
7,25 106.33
7,21- 106.25- 257131 5 3 5 13 p
6 0.31 33.6
7,25 106.29
7.00- 106.46- 19518 1 3 5 9 s
7 0.71 32.1
7.04 106.50
7,17- 106.38- 49125 5 3 5 13 p
8 0.72 44.7
7,21 106.42
GSJ© 2021
www.globalscientificjournal.comGSJ: Volume 9, Issue 1, January 2021
ISSN 2320-9186 1183
7,13- 106.29- 111252 5 3 1 9 s
9 0.33 28
7,17 106.33
7,08- 106.42- 29266 5 5 1 11 s
10 1.18 28.5
7,13 106.46
Table 1. Assessment of skipjack fishing areas using the scoring method
Based on table 7, the results obtained are 10 coordinate points with 3 categories, namely
potential, medium and less potential. There are 5 points with potential categories, 4 points with moderate
categories and 1 point with less potential. The coordinate point is the location where the fishing aid in the
form of FADs is placed. FADs are used because skipjack tuna is a predator that usually consumes smaller
fish such as tembang fish, kite fish, anchovies. squids and crustaceans (Restinangsih et al. 2018).
Phytoplankton are also referred to as primary producers because they have the ability to form organic
substances from inorganic substances. The presence of chlorophyll-a concentration indicates a primary
productivity as an indication of fish groups (Purwadhi 1986) .
Conclusion
The conclusion that can be drawn from the research results is that there are 10 points in the waters of
Palabuhanratu identified, there are 5 points included in the potential fishing area category, 4 in the
medium category and 1 in the less potential category.
GSJ© 2021
www.globalscientificjournal.comGSJ: Volume 9, Issue 1, January 2021
ISSN 2320-9186 1184
REFERENCES
Arikunto, S. 2010. Research Procedure A Practical Approach. Jakarta: Rineka Cipta
Arsjad, ABSM, Y. Siswantoro and RS Dewi. 2004. Natural Resources and Environment Intervariations:
Distribution of Chlorophyll-a in Indonesian Waters. Jakarta: Center for Marine Natural Resources
Survey BAKOSURTANAL.
Astuti, P. 2008. Java Sea Water Fertility Area in El Nino Period and Normal Period. Department of
Geography. Faculty of Mathematics and Natural Sciences. Depok: University of Indonesia. 62 Pages:
14.
Barnes, RSK and RN Huges. 1988. An Introduction to Marine Ecology. 2nd edition. Oxford: Balckwell
Scientific. 351 pages
Butler, MJA, MC Mouchot, V. Berale and C, Leblanc. 1989. The Application of The Remote Sensing
Technology to Marine Fisheries, An Introduction Manual. FAO Fisheries Paper 295. Rome.
Coan, ALJr., Cakifornia's Living Marine Resources and Their Utilization Eastern Pacific Skipjack Tuna. NOAA /
NFMS Southwest Fisheries Science Center, California, USA. 10 p
Dahuri, R. 2003. Marine Biodiversity. Jakarta: PT. Gramedia Pustaka Utama.
Dewayani, S. 2000. Benefits of SIG Sensing for Marine Fisheries Development: Potential for Fish Cultivation
Development in Floating Cages. Proceedings of the Integrated Coastal Zone Management Training.
Bogor: 29 October - 3 November 2001. Page: 226-235.
Dimyati, RD and Dimyati M. 1998. Remote Sensing and Geographical Information Systems for Planning.
Jakarta: CV RESOTA.
Effendi, CD 2006. Making a fishing area map using remote sensing technology in the waters of Bali.
Surabaya: Final Project of Geodesy Engineering Study Program.
Gaol, JL 2003. Study of Oceanographic Characteristics of the Eastern Indian Ocean Using Multisensory
Satellite Imagery and Its Relationship to the Catch of Big Eye Tuna (Thunnus obesus). [Dissertation].
Bogor: Postgraduate Program, IPB.
Gaol, J. L and B. Sadhotomo. 2007. Characteristics and Variability of Java Sea Oceanographic Parameters in
Relation to the Distribution of Fish Catches. Indonesian Fisheries Research Journal. 13 (3): 201-211.
Gower, JFR and JR Apple. 1972. Opportunities and problems in satellite measurements of the sea. UNESCO
Tech. Pap. 46. 70 p.
Gordon, AL 2005. Oceanography of the Indonesian Seas and Their Throughflow. Journal of Oceanography.
USA: The Oceanography Society. 18 (4): 15-20.
Graham, S. 2005. Aqua Project Science. http://aqua.nasa.gov/ [24 November 2017]
Hasan, I. 2003. Analysis of Research Data with Statistics. Jakarta: Earth Literacy
Hamka, Edy. 2012 Mapping of potential fishing ground for skipjack tuna (Decapterus spp) in the Banda Sea.
Bogor: Faculty of Fisheries and Marine Sciences, Bogor Agricultural University
Hela, I., and Taivo L. 1970. Fisheries Oceanography: New Ocean Environmental Services. England: Fishing
News Books.
GSJ© 2021
www.globalscientificjournal.comGSJ: Volume 9, Issue 1, January 2021
ISSN 2320-9186 1185
Insanu, RK, HH Handayani, BM Sukojo. 2013. Mapping Analysis of Fishing Ground Using Terra Modis
Satellite Imagery and Oceanographic Parameters. Proceedings of the XVIII National Seminar on
Technology Management. Surabaya: MMT-ITS Study Program
Kirk, RE and Othmer, VR 1994. Encyclopedia of Chemical Technology, vol. 11 Flavor Characterization to Fuel
Cells, John Wiley & Sons Inc., New York
Mallawa, A., Musbir, Amir, f and Marimba, AA, 2014 Biological Performance of Skipjack (Katsuwonus
pelamis) Populations Caught with Purse Seine in the East Season in Flores Sea, Faculty of Fisheries
and Marine Sciences Hasanuddin University, Makassar
Meliani, F. 2006. Study of the Concentration and Spatial Distribution of Chlorophyll-a in Jakarta Bay Waters
Using Aqua MODIS Satellite Imagery. Bogor: Faculty of Fisheries and Marine Sciences, Bogor
Agricultural University.
Nelwan, Alfa, M. Fedi A, Daniel R. Monintja, Domu Simbolon. 2010. Analysis of Small Pelagic Fishing Efforts
in the Makassar Strait, West Coast Waters of South Sulawesi. Journal of Fisheries and Marine
Technology Vol. 10 (1): 1-13
Nikyuluw, LU 2005. Study of Seasonal Variations in Sea Surface Temperature and Chlorophyll in Relation to
Lemuru Catching in Southern Waters of Bali. Bogor: Postgraduate Program, IPB.
Nontji, Grace. 1984. Biomass and Phytoplankton Productivity in the Waters of Jakarta Bay and its
Relationship with Environmental Factors. Bogor: Research Report of the Faculty of Fisheries, IPB.
Nontji, Grace. 1993. Nusantara Sea. Second printing. Jakarta: Djambat.
Nontji, Grace. 2002. Laut Nusantara. Third Print. Jakarta: Djambat.
Nybakken, JW, 1992. Marine Biology An Ecological Approach. Jakarta: PT. Gramedia.
Prasetiahadi, K. 1994. Oceanographic Conditions of Makassar Strait Waters in July 1992 (East Season).
Bogor: Faculty of Fisheries. Bogor Agricultural Institute.
Purbayanto, A. 1989. Suitable Types of Capture Technology to be Developed in the East Coast of Donggala
Regency, Central Sulewesi. Department of Fisheries Resource Utilization, Bogor: Faculty of Fisheries
and Marine Sciences. Bogor Agricultural Institute. Page 6.
Purbowaseso, B. 1995. Applied Remote Sensing. Jakarta: University of Indonesia Press.
Putra E., Gaol JL, Siregar VP 2012. Relationship between Chlorophyll-A Concentration and Sea Surface
Temperature with Main Pelagic Fish Catches in Java Sea Waters from Modis Satellite Images. Journal
of Fisheries and Marine Technology 3 (1): 10.
Reynolds, CA, Yitayew, M. and Hutchinson., CF 2000. Estimating Crop Yields and Production by Integrating
the FAO Crop Specific Water Balance Model with Real-time Satellite Data and Ground Based Ancillary
Data. International Journal of Remote Sensing.
Saanin, H. 1984. Taxonomy and Fish Identification 2. Bogor: Binacipta.
Sugiyono. 2014. Quantitative Research Methods, Qualitative, and R & D. Bandung: Alfabeta Publisher.
Sukandar. 2005. Dictate on Fisheries Resource Mapping Subject. Malang: Faculty of Fisheries, Brawijaya
University.
Restinangsih, Y, H. and Amri, K. 2018. Biological aspects and dietary habits of skipjack tuna (Katsuwonus
Pelamis) in the Flores Sea and its surroundings. Capture Fisheries Research Widya (Bawal)
Valiela, I. 1984. Marine Ecological Process. New York: Springer-Verlag.
GSJ© 2021
www.globalscientificjournal.comGSJ: Volume 9, Issue 1, January 2021
ISSN 2320-9186 1186
Walpole, RE and Raymond, HM1995. Opportunities and Statistics for Engineers and Scientists. Bandung: ITB
Widodo, J. 1999. Application of Remote Sensing Technology for Fisheries in Indonesia. Proceedings of the
Seminar on Sensory Data Validation for the Fisheries Sector. Jakarta 14 April 1999. Jakarta: Agency
for the Assessment and Application of Technology. ISBN; 979-95760-1-6. (II-1-II-21).
Yusfiandayani, R. 2004. Study of the Mechanism of Collecting Demersal Fish and Fishery Development in
Pasauran Waters, Banten Province. Bogor: Graduate School, Bogor Agricultural University.
GSJ© 2021
www.globalscientificjournal.comYou can also read