The environmental costs of being - selfiesh - CORE Econ
←
→
Page content transcription
If your browser does not render page correctly, please read the page content below

The environmental
  costs of being
     selfiesh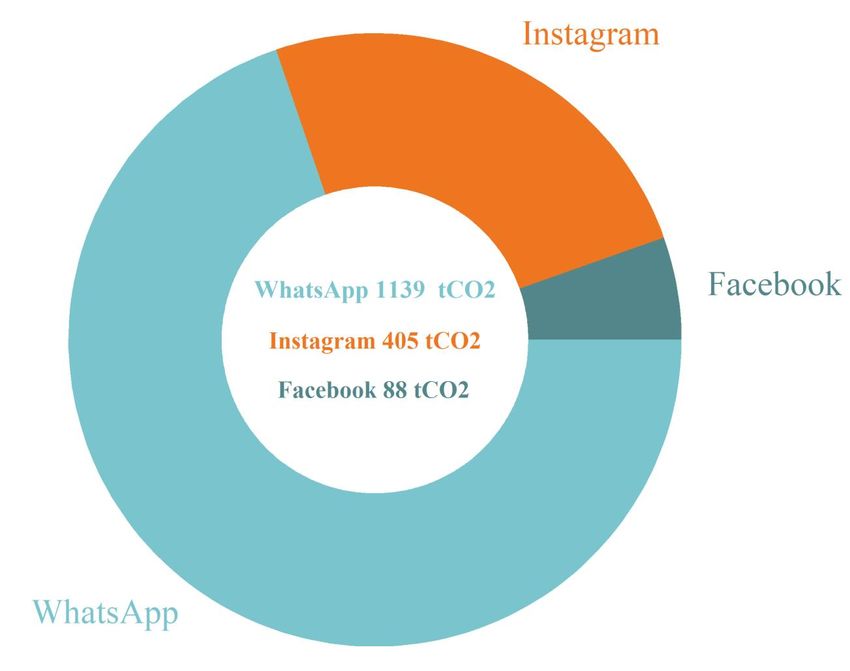
CORE Doing Economics
                                                                             Data Competition 2019

   1. Introduction
Climate change is one of the most important challenges in our century, and its correlation with CO2
(Carbon Dioxide) is extensively demonstrated in scientific research. Despite the rising attention on
this issue, many human-related activities have a hidden negative impact in terms of CO2 emissions,
and their social costs might not be internalized by a selfish or an unaware consumer.
In this report we focus on Internet-related activities, such as posting a selfie from a smartphone,
estimating their CO2 emission. For this reason, we introduce a converter, called Selfie Index, which
measures the pollution costs of online activities, and we suggest several examples to show the
alarming hidden contribution in terms of CO2 emissions for different social networks, services and
apps. We then describe some proposals to raise consumers’ awareness on the contributions they
make with their daily actions, as well as increasing communication reports and data transparency
of ICT (Information and Communication Technologies) businesses.

   2. Smartphones and Climate Change
The rapid increase of temperature on our planet and its relationship with anthropogenic CO2 is one
of the most discussed subjects in our century. It has been proven that the rise of temperature is
highly dependable on the CO2 released in the atmosphere, most of which is made by humans. In
Fig. 1, the increase in annual temperature anomalies is shown along with the increase of CO 2
emissions in the last 50 years.
In the last decades, many discussions and initiatives have been proposed to reduce our emissions
for the most polluting sectors. The most recent and ambitious example is the Paris Agreement
(United Nations, 2015), whose goal is to hold “the increase in the global average temperature to
well below 2 °C above pre-industrial levels and to pursue efforts to limit the temperature increase
to 1.5 °C”. The countries that signed the agreement will make an effort to reduce their GHG
(Greenhouse Gases) emissions, most notably CO2, and develop a production system that is
sustainable for the environment.

                                The environmental costs of being selfiesh                              2
CORE Doing Economics
                                                                                       Data Competition 2019

         Annual temperature anomalies and CO2 emissions

Fig. 1: Relationship between CO2 and increasing average annual temperature between 1960-2020, using the 1951-
1980 temperature average for comparison. Sources: Goddard Institute for Space Studies (2019), US National Oceanic
and Atmospheric Administration (2019)

Although many sectors are involved in CO2 emissions, we take particular interest in two elements:
smartphones and data centers. Smartphones are now everywhere, and their diffusion and
penetration are growing in every corner of the world, even considering different socio-economic
factors (Kakihara, 2014). It might be that you are reading this report on a smartphone.
In the life cycle of a smartphone, the production chain is the most relevant part on CO2 emissions.
However, most studies do not consider a “hidden” component: smartphones are basically useless
if they cannot connect to the Internet. Suckling & Lee (2015), for example, have shown how GHG
emissions, across the life cycle of a smartphone, heavily increase if servers are taken into account.
These emissions could increase exponentially along with the growth of people connected to the
Internet around the world. In Fig. 2, we can see how Internet users have grown in the last decade,
thanks also to the global diffusion of smartphones.

                                    The environmental costs of being selfiesh                                       3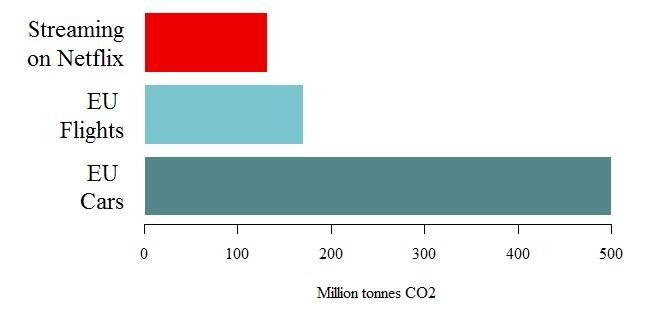
CORE Doing Economics
                                                                                      Data Competition 2019

Fig. 2: Number of Internet users in 2005-2018. Source: International Telecommunication Union (2018).

                                    The environmental costs of being selfiesh                                 4
CORE Doing Economics
Data Competition 2019
3. The Selfie Index
To express the impact of online smartphone usage in terms of CO2, we identified a unit of
measurement highly connected with it: a selfie.
A picture might not seem that much, but if we put it online, it goes through several networks and
data centers that require plenty of electricity to function; this process releases a lot of CO 2 in the
atmosphere. However, a picture uploaded in Brazil does not have the same impact as one uploaded
in India, because they have different levels of electricity efficiency in terms of CO2 emissions, as
shown in Fig 3.
Electricity efficiency in the world
Fig. 3: Amount of CO2 released for every kWh produced, for every country. Source: International Energy Agency
(2019).
We produce a converter to express any number of MB (Megabytes) into CO2 emissions, and use it
to calculate a single selfie in terms of CO2 emissions: this is our Selfie Index.1 For MB, we use as
benchmark the estimated weight of a selfie uploaded on Instagram, which is 2 MB.2 Then, we
express this value in terms of kWh required to process the picture through networks and data
centers. The value we choose to convert a selfie into kWh is the one proposed by Costenaro and
Duer (2012), which is 5.12 kWh/GB. We then convert a single selfie into CO2 emissions, using an
average global value for kgCO2/kWh.3
MB Electricity CO2
The environmental costs of being selfiesh 5CORE Doing Economics
Data Competition 2019
With the Selfie Index, the CO2 emissions of 10 selfies can be compared with 1 km travelled by an
average EU car (European Environment Agency, 2017). To show how high is the impact on the
environment of selfies, we consider the daily CO2 absorption of an average tree: even though it
cannot absorb all the emissions of a car, it can barely sustain 10 selfies a day.4
10 selfies vs 1 km of an EU car
Fig. 4: The amount of CO2 emitted by 10 selfies and by 1 km travelled by an average EU car. For further perspective,
we also considered the daily CO2 absorption of an average tree. Sources: European Environment Agency (2017),
McAliney (1993)
The Selfie Index can also be used to measure the huge environmental impact of the most common
social networks and apps. We consider Facebook, Instagram and WhatsApp, three popular social
networks and chat apps, all possessed by Facebook Inc.
Fig. 5 shows the total CO2 emissions of all pictures, uploaded or sent, in one year.5 Facebook,
Instagram and WhatsApp host 80 million, 350 million and 4.5 billion of pictures a day respectively,
an impressive amount of data with a significant impact in terms of CO2 emissions, growing year
by year.
The environmental costs of being selfiesh 6CORE Doing Economics
Data Competition 2019
CO2 emissions of major social network
Fig. 5: Average CO2 emissions in one year from Facebook, Instagram and WhatsApp. Note that a single picture
uploaded on Facebook and WhatsApp weights much less than one on Instagram. Sources: Facebook (n.d.), WhatsApp
(n.d.) and Instagram Press (2015).
The Selfie Index can be used for things other than selfies: since we are converting Megabytes into
CO2, we can use many other Internet-related things. In Fig. 6, over a year period, we choose to
compare the CO2 emissions of all hours watched on Netflix in the world with all cars in EU and all
flights departing from EU. Even though car emissions are by far the highest, the CO2 emissions of
Netflix and EU flights are remarkably close to each other.
The environmental costs of being selfiesh 7CORE Doing Economics
Data Competition 2019
Netflix vs EU flights and EU cars
Fig. 6: The amount of CO2 emitted by Netflix, all EU cars and all EU flights, in one year. Sources: Netflix Media
Center, European Environment Agency (2019), European Aviation Safety Agency (2016).
4. Policy proposals
The Selfie Index is a simple, powerful instrument to measure CO2 emissions of Megabytes that go
through networks and data centers, and it shows how ordinary, harmless actions have a huge impact
on climate change. However, the issues we highlighted are currently underestimated, and it should
be evident that they cannot be addressed without some regulations and transparency:
More information should be disclosed by ICT industries that operate with data centers.
Facebook, Google, Amazon, Netflix and other businesses already publish data, charts and
press releases to inform both investors and the general public of their activities. However,
we believe it is not enough to monitor their environmental impacts. Specifically, we
propose the introduction of an annual report in which businesses have to specify the electric
consumption of their data centers, the amount of renewable energy used to power them and
a global estimate of their CO2 emissions.
On the consumer side, we believe that everyone should be more aware of the impact of their
Internet activity on climate change. This could be achieved through the introduction of user-
friendly notifications, like pop-ups, captions or periodical e-mails from social networks,
where CO2 emissions of selfies posted, videos watched and data downloaded could be more
easily visualized.
The environmental costs of being selfiesh 8CORE Doing Economics
Data Competition 2019
5. Conclusions
In this report we mainly consider Internet-related activities of smartphones, social networks and
media services. However, these are just a small percentage of all Internet traffic: websites, forums,
bank transactions, e-mails, video and gaming platforms, clouds and many other online services also
need plenty of energy to function, which increases the environmental impact in terms of CO 2
emissions exponentially. At the same time, Internet of Things (IoT) has been changing our
relationship with objects in ways never imagined before, connecting previously offline devices and
generating an enormous flow of data, which silently contributes to climate change.
If our demand for online services keeps growing at this pace, it is likely that sustainability of
electric consumption will become a massive problem in the short future. Renewable energy is
essential to tackle this issue, although it could not be enough if all energy required to power the
Internet were not efficient, because the total demand for energy could exceed supply. For this
reason, further research is needed to estimate more precisely future trends in energy request,
production, renewability and efficiency.
The environmental costs of being selfiesh 9CORE Doing Economics
Data Competition 2019
Appendix
1: We assume that uploading and downloading a same sized file require the same amount
of energy, although uploading and downloading speed are usually different. Furthermore,
we are assuming that the re-scaling process, applied by many websites and apps to upload
a file, is mostly made by devices (smartphones, tablets etc.), and does not have an impact
on the overall energy used by data centers.
2: We considered Instagram because it is a social network strongly image-based and in
constant growth. We estimated the average weight of a picture uploaded on Instagram by
the resolution (1080x1080) above which Instagram downscales every picture.
To convert that resolution in MB, we considered the picture in JPEG and used this website:
https://toolstud.io/photo/megapixel.php?width=1920&height=1080&compare=video&cal
culate=compressed. This resulted in approximately 1.75 MB, that we rounded to 2MB.
3: The amount of energy estimated to upload 1 GB of data is influenced by many factors
and has several methodological problems. We considered the estimate 5.12 KWh/GB by
Costenaro and Duer (2012), despite being a study of 7 years ago, because it includes all the
subsystems required for uploading and processing Megabytes. Aslan et al. (2018) show that
several studies produced different numbers, with different infrastructure and networks
considered. We suppose that this value is valid for different data centers, regardless of their
electric efficiency and their location.
The conversion is as follows: 2 MB ≈ 0.002 GB. 0.002*5.12 ≈ 0.01 kWh. From this value,
we calculated the CO2 emissions for all our graphs by considering the global value, found
in the International Energy Agency (2019) dataset, which is 506.312 gCO2/kWh. For a
single selfie, the CO2 emission calculated is 0.01*506.312 ≈ 5.06 gCO2.
For a further discussion on methodological issues, see Coroama and Hilty (2014).
4: From this quote by McAliney (1993), we know that "A single mature tree can absorb
carbon dioxide at a rate of 48 lbs./year and release enough oxygen back into the atmosphere
to support 2 human beings." Converting 48 lbs/year into g/day, we obtain 59.65 gCO2/day.
(48 lbs/year = 21,7724kg/y = 0.05965 kg/day = 59.65 g/day).
5: As mentioned in Appendix 1, we considered 2 MB to be the average weight of a picture
posted on Instagram. For Facebook and WhatsApp, we considered 100 KB to be the average
weight, since Facebook downscales every picture above 100 KB, and we assume the same
limit is embedded on WhatsApp. Moreover, regarding the number of photos uploaded every
year, we found data for different periods: 2013 for Facebook, 2015 for Instagram and 2017
for WhatsApp. Given that all three apps are in constant growth, that they are all possessed
by Facebook Inc., and that they do not update these numbers very often, we considered
these data to be comparable.
The environmental costs of being selfiesh 10CORE Doing Economics
Data Competition 2019
Bibliography
1. Aslan, J., Mayers, K., Koomey, J. G., & France, C. (2018). Electricity intensity of Internet
data transmission: Untangling the estimates. Journal of Industrial Ecology, 22(4), 785-
798. Available at: https://onlinelibrary.wiley.com/doi/full/10.1111/jiec.12630 (last visited:
15/5/2019)
2. Coroama, V. C., & Hilty, L. M. (2014). Assessing Internet energy intensity: A review of
methods and results. Environmental impact assessment review, 45, 63-68. Available at:
https://www.sciencedirect.com/science/article/pii/S0195925513001121 (last visited:
15/5/2019)
3. Costenaro, D., & Duer, A. (2012). The megawatts behind your megabytes: going from
data-center to desktop. In ACEEE Summer Study on Energy Efficiency in Buildings.
Available at: https://aceee.org/files/proceedings/2012/data/papers/0193-000409.pdf (last
visited: 15/5/2019)
4. European Aviation Safety Agency [EASA] (2016). CO2 and NOX emissions. Available at:
https://www.easa.europa.eu/eaer/topics/overview-aviation-sector/emissions (last visited:
15/5/2019)
5. European Environment Agency [EEA] (2017). Monitoring of CO2 emissions from
passenger cars – Regulation (EC) No 443/2009. Available at:
https://www.eea.europa.eu/data-and-maps/data/co2-cars-emission-14 (last visited:
15/5/2019)
6. European Environment Agency [EEA] (2019). Monitoring CO2 emissions from new
passenger cars and vans in 2017. Available at:
https://www.eea.europa.eu/publications/monitoring-co2-emissions-from-new-2 (last
visited: 15/5/2019)
7. Facebook (n.d.). How can I make sure that my photos display in the highest possible
quality? Available at: https://www.facebook.com/help/266520536764594?helpref=related
(last visited: 15/5/2019)
8. Goddard Institute for Space Studies (2019). Global Mean Estimates Based on Land-
Surface Air Temperature Anomalies Only. Available at:
https://data.giss.nasa.gov/gistemp/tabledata_v3/GLB.Ts.csv (last visited: 15/5/2019)
The environmental costs of being selfiesh 11CORE Doing Economics
Data Competition 2019
9. Instagram Press (2015, September 22). Celebrating a Community of 400 Million.
Available at: https://instagram-press.com/blog/2015/09/22/celebrating-a-community-of-
400-million/ (last visited: 15/5/2019)
10. International Energy Agency [IEA] (2019). Emissions per kWh of electricity and heat
output. IEA CO2 Emissions from Fuel Combustion Statistics. Available at:
https://www.oecd-ilibrary.org/energy/data/iea-co2-emissions-from-fuel-combustion-
statistics/emissions-per-kwh-of-electricity-and-heat-output_data-00432-en (last visited:
15/5/2019)
11. International Telecommunication Union [ITU] (2018). ICT data for the world, by
geographic regions and by level of development. Available at:
https://www.itu.int/en/ITU-D/Statistics/Documents/statistics/2018/ITU_Key_2005-
2018_ICT_data_with%20LDCs_rev27Nov2018.xls (last visited: 15/5/2019)
12. Kakihara, M. (2014). Grasping a Global View of Smartphone Diffusion: An Analysis
from a Global Smartphone Study. ICMB. Available at:
https://aisel.aisnet.org/cgi/viewcontent.cgi?article=1011&context=icmb2014 (last visited:
15/5/2019)
13. McAliney, M. (1993). Arguments for land conservation: documentation and information
sources for land resources protection. Trust for Public Land, Sacramento, CA.
14. Miller, R. (2013, January 18). Facebook Builds Exabyte Data Centers for Cold Storage.
Data Center Knowledge. Available at:
https://www.datacenterknowledge.com/archives/2013/01/18/facebook-builds-new-data-
centers-for-cold-storage (last visited: 15/5/2019)
15. Netflix Media Center (2017, December 11). 2017 on Netflix – A Year in Bingeing.
Available at: https://media.netflix.com/en/press-releases/2017-on-netflix-a-year-in-
bingeing (last visited: 15/5/2019)
16. Suckling, J., & Lee, J. (2015). Redefining scope: the true environmental impact of
smartphones?. The International Journal of Life Cycle Assessment, 20(8), 1181-1196.
Available at: https://link.springer.com/content/pdf/10.1007%2Fs11367-015-0909-4.pdf
(last visited: 15/5/2019)
17. United Nations [UN] (2015). Paris Agreement. Available at:
https://unfccc.int/sites/default/files/english_paris_agreement.pdf (last visited: 15/5/2019)
The environmental costs of being selfiesh 12CORE Doing Economics
Data Competition 2019
18. United Nations [UN] (2017). Total Population - Both Sexes. De facto population in a
country, area or region as of 1 July of the year 2015. Available at:
https://population.un.org/wpp/Download/Standard/Population/ (last visited: 15/5/2019)
19. US National Oceanic and Atmospheric Administration (2019). CO2 data. Available at:
https://tinyco.re/3763425 (last visited: 15/5/2019)
20. WhatsApp (n.d.). Connecting One Billion Users Every Day. Available at:
https://blog.whatsapp.com/10000631/Connecting-One-Billion-Users-Every-Day?lang=it
(last visited: 15/5/2019)
The environmental costs of being selfiesh 13You can also read