To Generate an Ensemble Model for Women Thyroid Prediction Using Data Mining Techniques
←
→
Page content transcription
If your browser does not render page correctly, please read the page content below
DOI:10.31557/APJCP.2019.20.4.1275
                                 To Generate an Ensemble Model for Women Thyroid Prediction Using Data Mining Techniques

RESEARCH ARTICLE                                                Editorial Process: Submission:02/07/2019 Acceptance:04/07/2019

To Generate an Ensemble Model for Women Thyroid Prediction
Using Data Mining Techniques
Dhyan Chandra Yadav*, Saurabh Pal

Abstract
    Objective: The main objective of this paper is to easily identify thyroid symptom for treatment. Methods: In
this paper two main techniques are proposed for mining the hidden pattern in the dataset. Ensemble-I and Ensemble-
II both are machine learning techniques. Ensemble-I generated from decision tree, over fitting and neural network
and Ensemble-II generated from combinations of Bagging and Boosting techniques. Finally proposed experiment is
conducted by Ensemble-I vs. Ensemble-II. Results: In the entire experimental setup find an ensemble –II generated
model is the higher compare to other ensemble-I model. In each experiment observe and compare the value of all the
performance of ROC, MAE, RMSE, RAE and RRSE. Stacking (ensemble-I) ensemble model estimate the weights
for input with output model by thyroid dataset. After the measurement find out the results ROC=(98.80), MAE=
(0.89), 6RMSE=(0.21), RAE= (52.78), RRSE=(83.71)and in the ensemble-II observe thyroid dataset and measure all
performance of the model ROC=(98.79), MAE= (0.31), RMSE=(0.05) and RAE= (35.89) and RRSE=(52.67). Finally
concluded that (Bagging+ Boosting) ensemble-II model is the best compare to other.

Keywords: Meta classifier algorithms- boosting- bagging- ensemble-I, ensemble-II- ROC- MAE- RMSE- RAE- RRSE

Asian Pac J Cancer Prev, 20 (4), 1275-1281

Introduction                                                    technique in healthcare observed all the discovering
                                                                patterns between various collections of thyroid dataset
     It is very critical to observe and measure combination     for women (Farwell, 2019).
of hormonal disturbance in women. It is not detected only           Diagnosis of thyroid disease in which the thyroid
in ladies but also find in gens. The reason behind thyroid      gland produces hormones to maintain metabolism of
is flexuation of hormones over or low in the human. It is       the human body. The thyroid disorders are classified
very necessary for healthcare to balance hormonal over or       into three parts first is Hypothyroidism second is the
low variation of hormones’. Hormonal disturbance have           Hypothyroidism and third is Euthyroidism. In this paper
some risk factors so it is more required to continuous          author used machine learning methods linear discriminate
concern for the doctors and find the correct diagnosis at the   analysis, K-nearest neighbour and adaptive neuro-fuzzy
correct time. Some very importance questions in thyroid to      inference system. In the final analysis author find out
making decision as like what is most important technique        accuracy (98.5%), sensitivity (94.7%) and specificity of
to classify and identify thyroid symptoms? How treats in        this approach (Ahmad et al., 2018). A combine method of
this situation? How minimize the thyroid symptom? How           adaptive neuro-fuzzy inference system and information
take best decision to minimize death risk? In this paper        gain method. They decreased computation time and
focus their work and using different ensemble models            classification complexity. They find out classification
to identify the best algorithms for classification thyroid      accuracy (95.24%), specificity (91.7%) and sensitivity
disorders. Thyroid glands have the shape as like butterfly.     (96.17%) (Ahmad et al., 2018). A system by machine
Thyroid gland produces two different type hormones a like       learning method for thyroid disease and the effectiveness
T3 and T4. These hormones manage the effective function         of analyzed system measured in term of classification
of body as like body temperature, blood pressure, heart rate    accuracy (Ma et al.,2018). Classification tree and its
sexual system etc. In some happening if T3 and T4 are not       accuracy (98.89%) over the other classification techniques.
in proper way then some difference problems arise as like       They used k-nearest neighbours, support vector machine,
Hyperthyroidism and Hypothyroidism. If T3 is high and           decision tree and naïve bayes (Umar Sidiq et al., 2019).
T4 normal means thyroid gland produce much hormone                  Thyroid disease are analyzed by J48 graft and they
it will be Hyperthyroid and in other hand if T3 is less         take (7,200) thyroid dataset due to hypothyroidism and
and T4 is normal then it will be Hypothyroid. This paper        hyperthyroidism. They measure maximum classification
is organized in the two different sections. Data mining         accuracy (97.02%) and they suggested a model for thyroid

VBS Purvanchal University, Jaunpur, U.P., India. *For Correspondence: dc9532105114@gmail.com

                                                                   Asian Pacific Journal of Cancer Prevention, Vol 20    1275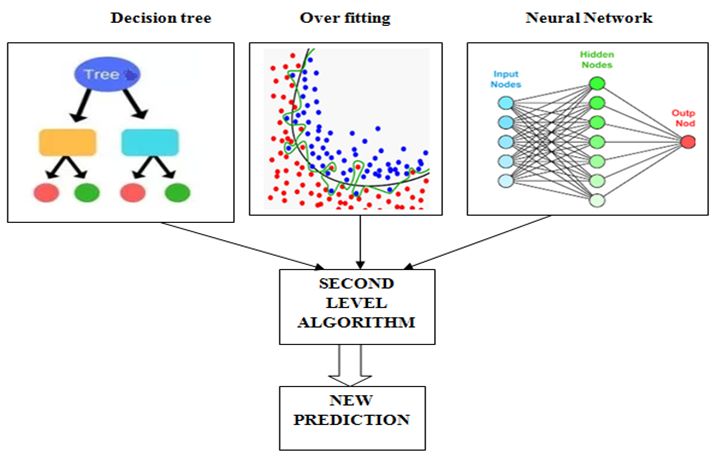
Dhyan Chandra Yadav and Saurabh Pal

disease (Hayashi, 2017). Thyroid prediction for women by       2015). Authors discussed about anti- thyroid peroxides
test hyperthyroidism and hypothyroidism. They supported        for classification. They used T3, T4 and TSH associative
as a mini expert for dysfunction. They provided best           increase risk of birth and miscarriage for defection
clinical result comparison to traditional clinical practices   hyperthyroidism and hypothyroidism (Loh et al., 2016).
(Kusić et al., 2009). Thyroid cancer by classification
technique are discussed to analyzed thyroid cancer by          Materials and Methods
digital image of the cell. They used template machine
technique and automated defect and improve the accuracy            All the dataset used for experimental and study
of classification with very short time (Jagdeeshkannan et      purpose. All the observation is dividing in following
al., 2014). The disease used classification, Data mining,      section: data description, algorithm description, result
Decision tree and thyroid diagnosis for the prediction of      discussion and then find conclusion.
thyroid disease. They performed and measure six metrics
Accuracy, roid MAE, PRE, REC, FME and Kappa statistic          Data Description
and finally they find out NB tree analyzed (75%) highest           All the dataset collect from some different source as
rate accuracy (Turanoglu-Bekar et al., 2016). Thyroid          like Rahul pathology, Chandan pathology and some data
disease by machine learning algorithms and they used           collect from website. All the dataset divide into three parts:
machine learning, thyroid disease CRT decision tree and        First is 5,000 thyroid dataset instances second is 10,000
python for best knowledge in medical science. Finally          and third is 12,000 instances. The dataset categories some
they find out machine learning tool for thyroid disease        negative and some positive category. The target variable
diagnosis with 99.7% accuracy (Al-muwaffaq and Bozkus,         class level divide into three parts (1) Hyperthyroid, (2)
2016). Authors discussed about thyroid disease four            Hypothyroidism and (3) Euthyroidism but finally observe
classification model of data mining. They used data mining     and predict hypothyroidism class (Farwell, 2019). All the
classification model, thyroid disease, neural network,         related details of thyroid dataset are presented in table -1.
decision tree and naïve bayes for dysfunctions among the           In this paper observe the prediction in by the low, high
population and detect more effect of thyroid on women.         and normal dependable variable. Low high and normal
They also find out all the performance of decision tree,       dependable variable have his class level state mention in
clustering and all selected algorithms performance high        above table -1.
accuracy and efficiency (Priyal and Anitha, 2017).                 Some other in-dependable Variables: Fatigue (tired),
     Thyroid organ and hormones productions are                Cold Intolerance, Skin, Weight, Face Swelling, Menstrual
discussed and they used hormones, hypothyroidism and           Cycles, Hair, Memory Concentrating, Heart Rate, Bowel
risk prediction for controlling the body digestion. They       Movements, Hand Tremors, and Blood Pressure. All
find out in the thyroid prediction system. Naïve bayes         In-dependable variables have his definition and concept
predict with hypothyroid and find out the best outcomes        mention in the above Table 1.
for accuracy and least execution time (Vijaylakshmi et
al., 2018). Paper discusses about thyroid challenging          Algorithms Description
factors. They used thyroid disease, decision tree, naïve           The propose model is not a doctor but it is assist the
bayes, SVM and Backpropogation. They find out various          doctor. Analyst takes support by ensemble model after the
results on speed, accuracy, performance and cost in            collection of all symptoms of thyroid data. In this paper
prediction of thyroid dataset. These techniques minimize       select three Meta classifier algorithms: Bagging, Boosting
the noisy data of the thyroid patient data (Rajam et al.,      and Stacking. We discuss about these algorithms as below:
2016). Role of machine learning in medical science by the          Bagging: Data mining classifier has Meta classifier
help of Meta classifier. They used data mining decision        for prediction. In this research paper bagging algorithm
tree and regression tree in multiple ways. They find 93%       decrease the variance of prediction by formulating thyroid
classification accuracy and suggested to boost algorithm       dataset. In the example select previous work training data
for prediction (Chaurasia et al., 2018). Machine learning      and then select these data resample S1, S2..Sn. After that
used data quality, data repairing, data inconsistency and      formatted as in different models M1, M2...Mn. Finally
data cleaning for quality of data. They conducted the          find the function H from all different modelled functions
study for effectiveness comparison of existing miner           of h1, h2 …hn (Brownlee, 2019 ).
techniques. They observed the response time, storage               Boosting: Boosting is machine learning algorithm.
space and database scability (Salem and Abdo, 2016).           Boosting algorithm produce a series of average performing
Authors discussed about efficient and effective method         model by subset of original data.Boosting behaves as like
for feature subset selection. They used classification,        a tracker for the data sample with heavier weights. In
evolutionary computation techniques, decision tree and         this paper use M1, W1 and D1 for data model, weights
nearest neighbour for higher classification accuracy. They     of data model and data sample for training respectively
observed both generic algorithms, RST based algorithm          (Brownlee, 2019).
and increased accuracy of the classification (Surekha
and Suma, 2016). This paper discussed breast treatment         Stacking as Ensemble Model
of cancer for women. They used Breast, Data Mining,                 Stacking is a machine learning algorithm. In this paper
Naïve Bayes and RBF Network. They predicted the breast         stacking use as a ensemble model by decision tree, over
cancer by many classifier algorithms and Naïve Bayes           fitting and neural network. The ensemble model estimates
give the highest accuracy (97.36%) (Chaurasia et al.,          the weights for input with output model. The second layer
1276   Asian Pacific Journal of Cancer Prevention, Vol 20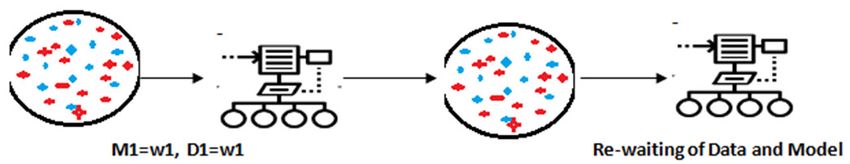
DOI:10.31557/APJCP.2019.20.4.1275
                                To Generate an Ensemble Model for Women Thyroid Prediction Using Data Mining Techniques
is train and consist all over three algorithms predictions       thyroid dataset and measure all the performance of ROC,
and also generate new trend for predictions (Brownlee,           MAE, RMSE, RAE and RRSE. After the measurement
2019).                                                           find the results ROC=98.52, MAE= 0.85, RMSE=0.06 and
                                                                 RAE=23.34 and RRSE=40.61. AdaBoostM1 algorithm
Proposed model                                                   produces a series of average performing model by subset
    In this paper propose ensemble generate in three             of original data by thyroid dataset and measure all the
stages. In the first stage model-I generate from decision        performance of ROC, MAE, RMSE, RAE and RRSE.
tree, over fitting and neural network. These three different     After the measurement find the results ROC=95.39,
algorithms easily evaluate all the features of the thyroid       MAE= 0.91, RMSE=0.08 37.65 and RAE= 37.65 and
dataset of women in maximum relative direction. I n the          RRSE=52.29.
second stage generates ensemble model-II from bagging                Stacking(ensemble-I) algorithm The ensemble model
and boosting algorithms. These two different algorithms          estimate the weights for input with output model by
generate a model for thyroid dataset of women with all           thyroid dataset and measure all the performance of ROC,
relative features of algorithms. In the stage-III easily         MAE,RMSE,RAE and RRSE. After the measurement find
compare the performance of ensemble-I and ensemble-II            the results ROC=96.89, MAE= 0.79, 6RMSE=0.05 and
and finally evaluate ROC, MAE, RMSE, RAE and RRSE.               RAE= 29.52 and RRSE=39.64.
    Analyse thyroid dataset of women in various way                  By ensemble-II observe thyroid dataset and measure
by machine learning. Both ensemble models generate               all the performance of ROC, MAE, RMSE, RAE and
different values in the experiment. In this paper measure        RRSE.
ROC, MAE, RMSE, RAE and RRSE.                                        After the measurement find the results ROC=98.35,
                                                                 MAE= 0.81, RMSE=0.03 and RAE= 19.75 and
   All the experiment divides in three stages:                   RRSE=32.74.

Results                                                          Experiment-II
                                                                     In the second experiment used 10 fold cross validation
    After the various experimental setups we find the            with (60%) percentage supply. Firstly observe Bagging
result in various ways to describe the classification ROC,       algorithm and decrease the variance of prediction by
MAE, RMSE, RAE and RRSE measure as describe                      thyroid dataset and measure all the performance of ROC,
below-                                                           MAE, RMSE, RAE and RRSE. After the measurement
                                                                 find the results ROC=97.78, MAE= 0.72, RMSE=0.12
Experiment-I                                                     and RAE=46.67 and RRSE=71.64.
   In the first experiment used 10 fold cross validation             AdaBoostM1 algorithm produce a series of average
with (60%) percentage supply. Firstly observe Bagging            performing model by subset of original data by thyroid
algorithm and decrease the variance of prediction by             dataset and measure all the performance of ROC, MAE,

Table 1. Computational Table for Thyroid Dataset Variables
 Source                             Chandan Diagonosis Center, Rahul pathology and Rahul thyroid diagnosis center,
                                    https://github.com/mikeizbicki/datasets/blob/master/csv/uci/new-thyroid.names
 Sample Size                        Total:12,000, Hypothyroidism: 5,628, Hyperthyroidism: 5,522, Euthyroid State:0850
 Dependable Variables
    Observation (Low)               Hypothyroidism in which a person’s hormone production is below normal.
    Observation (High)              Hyperthyroidism in which a person’s thyroid over produces hormones.
    Observation (Normal)            Euthyroid State is a normal thyroid gland function.
 Independable Variables
    Fatigue (tired)                 1= H, 0= L and 2= Ir.
    Cold Intolerance                1= R, 0= N and 2= Ir.
    Skin                            0= LessDry , 1= Dry and 2=Normal.
    Weight                          0=Loss, 1= Gain.
    Face Swelling                   1= Detect,2 = Normal.
    Menstrual Cycles                 0=Infrequent& Less Bleeding, 1= Early & High Bleeding, 2=Normal
    Hair                            1=Loss, 2=Normal.
    Memory Concentrating            1=Weak and 2=Normal.
    Heart Rate                      1=High, 2= Normal and 0=Slow.
    Bowel Movements                 2=Normal, 1=Frequent and 0=No Frequent.
    Hand Tremors                    1=Stronger, 2=Normal and 0= Weak.
    Blood Pressure                  1=High, 0=Low and 2=Normal.

                                                                    Asian Pacific Journal of Cancer Prevention, Vol 20   1277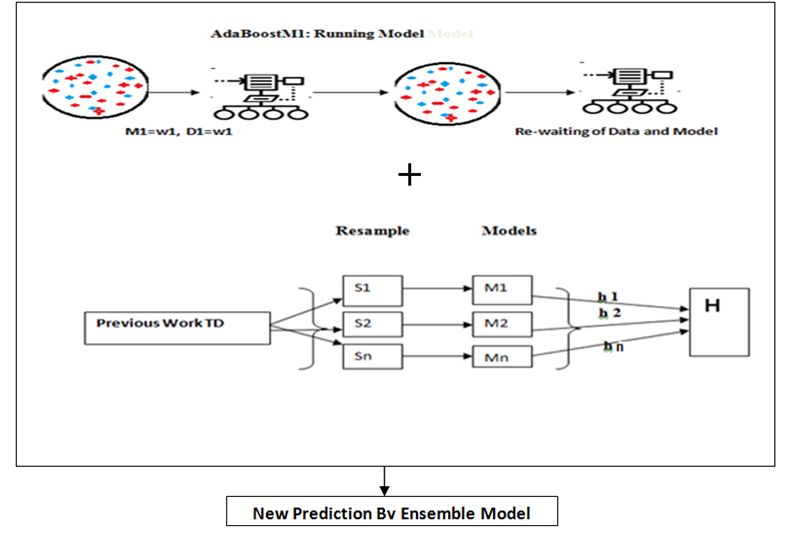
Dhyan Chandra Yadav and Saurabh Pal

Figure 1. Uniform Re-Sample Modelling of Thyroid dataset in Parallel Style by Bagging Algorithm

Figure 2. Reweighting with Non-Sequential Modelling of Thyroid Dataset by Boosting Algorithm

RMSE, RAE and RRSE. After the measurement find the               RRSE.
results ROC=98.92, MAE= 0.53, RMSE=0.09 and RAE=                   After the measurement find the results ROC=98.45,
39.42 and RRSE=53.69.                                            MAE= 0.49, RMSE=0.07 and RAE= 37.83 and
    Stacking(ensemble-I) algorithm The ensemble model            RRSE=51.93.
estimate the weights for input with output model by
thyroid dataset and measure all the performance of ROC,          Experiment-III
MAE,RMSE,RAE and RRSE. After the measurement find                   In the Third experiment used 10 fold cross validation
the results ROC=98.80, MAE= 0.89, 6RMSE=0.21 and                 with (60%) percentage supply. Firstly observe Bagging
RAE= 52.78 and RRSE=83.71.                                       algorithm and decrease the variance of prediction by
    By ensemble-II observe thyroid dataset and measure           thyroid dataset and measure all the performance of ROC,
all the performance of ROC, MAE,RMSE,RAE and                     MAE, RMSE, RAE and RRSE. After the measurement

Figure 3. Observation of Thyroid Dataset by Stacking Algorithm

Table 2. Computational Table of 5,000 Instances for Thyroid Dataset
 Algorithms                          ROC         Mean          Root mean        Relative              Root           No. of
                                             absolute error   squared error   absolute error relative squared error Instances
 Bagging                             98.52        0.85            0.06           23.34              40.61
 AdaBoostinhM1                       95.39        0.91            0.08           37.65              52.29
 Ensemble-I (Stacking)               96.89        0.79            0.05           29.52              39.64             5000
 Ensemble-II (Bagging+ Boosting)     98.35        0.81            0.03           19.75              32.74

1278   Asian Pacific Journal of Cancer Prevention, Vol 20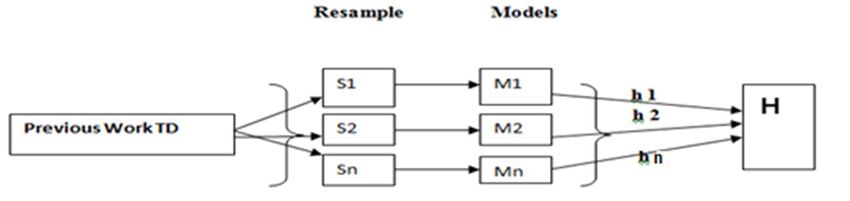
DOI:10.31557/APJCP.2019.20.4.1275
To Generate an Ensemble Model for Women Thyroid Prediction Using Data Mining Techniques
Figure 4. Propose Ensemble Model for Prediction of Thyroid Dataset
Table 3. Computational Table of 10,000 Instances for Thyroid Dataset
Algorithms ROC Mean Root mean Relative Root relative No. of
absolute error squared error absolute error squared error Instances
Bagging 97.78 0.72 0.12 46.67 71.64 10000
AdaBoostinhM1 98.92 0.53 0.09 39.42 53.69
Ensemble-I(Stacking) 96.8 0.89 0.21 52.78 83.71
Ensemble-II (Bagging+ Boosting) 98.45 0.49 0.07 37.83 51.93
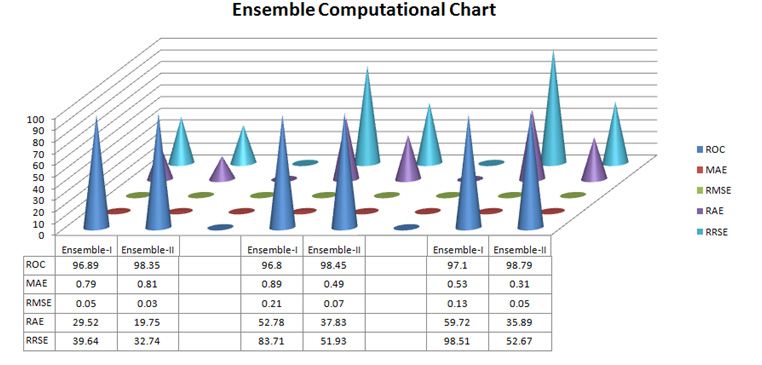
Figure 5. Computational Figure for Ensemble-I vs. Ensemble-II of Thyroid Dataset
Table 4. Computational Table of 12,000 Instances for Thyroid Dataset
Algorithms ROC Mean Root mean Relative Root relative No. of
absolute error squared error absolute error squared error Instances
Bagging 95.98 0.79 0.23 72.31 98.47 12,000
AdaBoostinhM1 96.39 0.67 0.19 69.72 95.38
Ensemble-I (Stacking) 97.1 0.53 0.13 59.72 98.51
Ensemble-II (Bagging+ Boosting) 98.79 0.31 0.05 35.89 52.67
Asian Pacific Journal of Cancer Prevention, Vol 20 1279Dhyan Chandra Yadav and Saurabh Pal
find the results ROC=95.98, MAE= 0.79, RMSE=0.23 Boosting) ensemble-II model is the best compare to other.
and RAE=72.31 and RRSE=98.47. For future research some ensemble model with different
AdaBoostM1 algorithm produce a series of average computational technique and decision tree can be used for
performing model by subset of original data by thyroid clustering and association of the thyroid disease.
dataset and measure all the performance of ROC, MAE,
RMSE, RAE and RRSE. After the measurement find Statement conflict of Interest
the results ROC=96.39, MAE= 0.67, RMSE=0.19 and The authors declare no conflict of interest.
RAE= 69.72 and RRSE=95.38.
Stacking (ensemble-I) algorithm The ensemble model Acknowledgements
estimate the weights for input with output model by
thyroid dataset and measure all the performance of ROC, The author is grateful to Veer Bahadur Singh
MAE,RMSE,RAE and RRSE. After the measurement find Purvanchal University Jaunpur, Uttar Pradesh, for
the results ROC=97.10, MAE= 0.53, 6RMSE=0.13 and providing financial support to work as Post Doctoral
RAE= 59.72 and RRSE=98.51. Research Fellowship.
By ensemble-II observe thyroid dataset and measure
all the performance of ROC, MAE,RMSE,RAE and References
RRSE.
After the measurement find the results ROC=98.79, Ahmad W, Ahmad A, Iqbal A, et al (2018). Intelligent hepatitis
MAE= 0.31, RMSE=0.05 and RAE= 35.89 and diagnosis using adaptive neuro-fuzzy inference system and
RRSE=52.67. information gain method. Soft Comput, 1-8.
Ahmad W, Ahmad A, Lu C, Khoso BA, Huang L (2018). A
Finally find out in all the observation Ensemble-II
novel hybrid decision support system for thyroid disease
generate model give high ROC compare to other forecasting. Soft Comput, 22, 5377-83.
ensemble-I algorithm set model and give less error values Al-muwaffaq I, Bozkus Z (2016). MLTDD: use of machine
compare to all other error MAE,RMSE,RAE and RRSE. learning techniques for diagnosis of thyroid gland disorder.
In conclusion, in all the experiment used 10 fold cross Comput Sci Inf Technol, 67-3.
validation with (60%) percentage supply. Experiment-I Brownlee J (2019). Welcome to Machine Learning Mastery!.
observe thyroid dataset for 5,000 instances and measure http://machinelearningmastery.com.
all the performance of ROC, MAE,RMSE,RAE and Chaurasia V, Pal S, Tiwari BB (2018). Chronic Kidney Disease:
RRSE. After the measurement find the results ROC=98.35, A Predictive model using Decision Tree. Int J Eng Res
Technol, 11, 1781-94.
MAE= 0.81, RMSE=0.03 and RAE= 19.75 and
Chaurasia V, Pal S, Tiwari BB (2018). Prediction of benign and
RRSE=32.74 .The performance of Ensemble-II is higher malignant breast cancer using data mining techniques. J Algo
compare to Bagging, AdaboostM1 and Ensemble-I. Comput Technol, 12, 119-26.
Experiment-II observe thyroid dataset for 10,000 Farwell AP (2019). http://www.healthywomen.org/ condition/
instances and measure all the performance of ROC, thyroid-disorders.
MAE,RMSE,RAE and RRSE. After the measurement Hayashi Y (2017). Synergy effects between grafting and
find the results ROC=98.45, MAE= 0.49, RMSE=0.07 subdivision in Re-RX with J48graft for the diagnosis of
and RAE= 37.83 and RRSE=51.93. The performance of thyroid disease. Knowl Based Syst, 131, 170-82.
Ensemble-II is higher compare to Bagging, AdaboostM1 Jagdeeshkannan R, Aarthi G, Akshaya L, Ravy K (2014). An
Approach for Automated Detection and Classification of
and Ensemble-I.
Thyroid Cancer Cells. InICT and Critical Infrastructure,
Experiment-II observe thyroid dataset for 12,000 Proceedings of the 48th Annual Convention of Computer
instances and measure all the performance of ROC, Society of India, 2, pp 379-89.
MAE,RMSE,RAE and RRSE. After the measurement Kusić Z, Jukić T, Franceschi M, et al (2009). Croatian Thyroid
find the results ROC=98.79, MAE= 0.31, RMSE=0.05 Society guidelines for rational detection of thyroid
and RAE= 35.89 and RRSE=52.67. The performance of dysfunction. Lijecnicki vjesnik, 131, 328-38.
Ensemble-II is higher compare to Bagging, AdaboostM1 Loh TP, Tee JC, Tee NW, et al (2016). Association between
and Ensemble-I. thyroid function tests and anti-thyroid peroxidase (TPO)
antibodies in pregnancy. Endocrine, 53, 865-7.
Ma C, Guan J, Zhao W, Wang C (2018). An efficient diagnosis
Discussion system for Thyroid disease based on enhanced Kernelized
Extreme Learning Machine Approach. Cognitive Computing,
In all the experimental setup find an ensemble –II 86-101.
generated model is the higher compare to other ensemble-I Priyal SS, Anitha D (2017). Survey on Thyroid diagnosis using
model. In each experiment observe and compare the value Data Mining Techniques. Int J Adv Res Comput Commun
of all the performance of ROC, MAE, RMSE, RAE and Eng, 6, 161-4.
RRSE. Stacking (ensemble-I) algorithm The ensemble Rajam K, Jemin R, Priyadarsini (2016). Survey on diagnosis of
model estimate the weights for input with output model Thyroid disease using Data Mining Techniques. Int J Comput
by thyroid dataset . After the measurement find out the Sci Mobile Comput, 5, 354-8.
Salem R, Abdo A (2016). Fixing rules for data cleaning based
results ROC=98.80, MAE= 0.89, 6RMSE=0.21, RAE=
on conditional functional dependency. Future Comput Inf J,
52.78, RRSE=83.71and in the ensemble-II observe 1, 10-26.
thyroid dataset and measure all performance of the model Surekha S, Suma GJ (2015). Comparison of feature selection
ROC=98.79, MAE= 0.31, RMSE=0.05 and RAE= 35.89 techniques for Thyroid disease. InICICMT’2015, AbuDhabi
and RRSE=52.67. Finally concluded that (Bagging+ (UAE), pp 20-6.
1280 Asian Pacific Journal of Cancer Prevention, Vol 20DOI:10.31557/APJCP.2019.20.4.1275
To Generate an Ensemble Model for Women Thyroid Prediction Using Data Mining Techniques
Turanoglu-Bekar E, Ulutagay G, Kantarcı-Savas S (2016).
Classification of thyroid disease by using data mining
models: a comparison of decision tree algorithms. Oxf J
Intel Decis Data Sci, 2, 13-28.
Umar Sidiq D, Aaqib SM, Khan RA (2019). Diagnosis of
various Thyroid Ailments using Data Mining Classification
Techniques. Int J Sci Res Coput Sci Inf Technol, 5, 131-6.
Vijayalakshmi K, Dheeraj S, Deepthi BSS (2018). Intelligent
Thyroid prediction system using Big data. Int J Comput Sci
Eng, 6, 326-1.
This work is licensed under a Creative Commons Attribution-
Non Commercial 4.0 International License.
Asian Pacific Journal of Cancer Prevention, Vol 20 1281You can also read