Customer Segmentation of Credit Card Default by Self Organizing Map
←
→
Page content transcription
If your browser does not render page correctly, please read the page content below
American Journal of Computational Mathematics, 2018, 8, 197-202
                                                                                                http://www.scirp.org/journal/ajcm
                                                                                                          ISSN Online: 2161-1211
                                                                                                            ISSN Print: 2161-1203

Customer Segmentation of Credit Card Default
by Self Organizing Map

Hui Wu1, Chang-Chun Wang2

Department of Mathematics, Clark Atlanta University, Atlanta, GA, USA
1

International Monetary Fund, Washington DC, USA
2

How to cite this paper: Wu, H. and Wang,        Abstract
C.-C. (2018) Customer Segmentation of
Credit Card Default by Self Organizing          In this paper we applied the technique of Self Organizing Map (SOM) to seg-
Map. American Journal of Computational          ment individuals based on their credit information. SOM is an unsupervised
Mathematics, 8, 197-202.                        machine learning method that reduces data complexity and dimensionality
https://doi.org/10.4236/ajcm.2018.83015
                                                while keeping sits original topology, which is superior to other dimension re-
Received: April 25, 2018                        duction methods especially when features in data have unclear nonlinear rela-
Accepted: August 31, 2018                       tions. Through this method we provide more clear and intuitive segmentation
Published: September 3, 2018
                                                that other traditional methods cannot achieve.
Copyright © 2018 by authors and
Scientific Research Publishing Inc.             Keywords
This work is licensed under the Creative
                                                Self Organizing Map, Clustering, Machine Learning, Credit Default
Commons Attribution International
License (CC BY 4.0).
http://creativecommons.org/licenses/by/4.0/
               Open Access
                                              1. Introduction
                                              SOM is an unsupervised machine learning method using artificial neuro net-
                                              work to reduce data complexity and dimensionality. Designed and proposed by
                                              [1], C. von der Marlsburg (1973), developed and refined by [2], T. Kohnen (Fin-
                                              land, 1982), it is based on the same principle of biological neuro network. Like in
                                              human brain, when a nerve cell gets excitement, it will restrain other nerve cells
                                              surrounding it. The effect will trigger competition among nerve cells, and in the
                                              end, only some winning cells are excited. SOM simulates the above biological
                                              procedure and hence has the similar topology reserving properties as of human
                                              brain, which makes it superior than other dimension reduction methods espe-
                                              cially when features in data have unclear nonlinear relations.
                                                 Credit card default prediction is a long-standing problem that many financial
                                              institutes and banks are interested in. With the rising capability of acquiring and
                                              processing big data, people naturally think whether there are better forecasting
                                              models for credit card default prediction for taking advantage of the new availa-

DOI: 10.4236/ajcm.2018.83015 Sep. 3, 2018                          197             American Journal of Computational Mathematics
H. Wu, C.-C. Wang

                               ble data. Directly using the whole raw data to build model could not only hurt
                               the accuracy but also limit the explanation power of the models. Through cus-
                               tomer segmentation, we can separate current data into several clusters, and build
                               models corresponding to each cluster. Due to similar characteristics of data in
                               the same cluster, the accuracy of the built model will be increased. In this paper,
                               we propose SOM to do a customer segmentation of credit card. After segmenta-
                               tion, the data become much clearer for interpreting and forecasting models.
                                  This paper is organized as follows: In the second section, we introduced the
                               SOM algorithm and its background. In the third section, we explain the credit
                               card data. In the fourth section we provide the result and analysis. Final conclu-
                               sion is given in the fifth section.

                               2. Algorithm of Self Organizing Map
                               In this algorithm, SOM simulates the excitability, coordination and suppression
                               of biological neurons, and by using dynamics of competition for information
                               processing and to guide the learning and work of the network, unlike the mul-
                               ti-layer neural network (MLP) using the network error as a criterion for the al-
                               gorithm. The basic idea of the composition of competitive neural networks is
                               that the competing layers of the network compete for the input mode to respond
                               to the opportunity, and finally only one neuron becomes the winner of the
                               competition. This winning neuron represents the classification of the input pat-
                               tern.
                                  In an artificial neural network, a neuron processing unit can represent differ-
                               ent objects, such as features, letters, concepts, or some meaningful abstraction
                               pattern. The type of processing unit in the network is divided into three catego-
                               ries: input unit, output unit and hidden unit. The typical SOM network consists
                               of two layers (input layer and output layer).
                                  The input unit accepts signals and data from the outside world. The output
                               makes responses to the information and output the processing result. The hid-
                               den unit is a unit that cannot be observed by the outsider of the system between
                               the input and output units. Connection weights between neurons reflect the
                               connection strength between cells. The representation and processing of infor-
                               mation are reflected in the connection relationship of the network processing
                               unit.
                                  Each neuron on the grid is an output neuron which has maintained topologi-
                               cal properties within training set. SOM usually Operates as following process:
                               the make of a two-dimensional array/map and the randomization of the initial
                               data. Then it gives training data to the network and let the cells on the network
                               compete to win which, stimulates winner and some friends in the “neighbor-
                               hood”, meanwhile updating neurons, repeating this process again and again,
                               forming the result of a 2-dimensional network.
                                  SOM is divided into training paces and testing procedure. In the training
                               process, the weight vector is trained as the clustering center of the input sample
                               space. In the testing process, when the input vector and a competitive layer of

DOI: 10.4236/ajcm.2018.83015                         198             American Journal of Computational Mathematics
H. Wu, C.-C. Wang
the inner star weights are similar, it will be assigned to the corresponding clus-
ters.
A typical structure of a self-organizing neural network: it consists of the input
layer and the competitive layer. Mainly for the completion of the basic tasks or
“classification” and “clustering”, the former has supervision, the latter performs
without supervision. Clustering can also be known as sorting the target sample,
but there is no prior information, the purpose is to put similar samples together,
and to separate not similar samples.
The implementation of SOM algorithms to deal with complicated data has at-
tracted considerable attention from many researchers [3]-[9]. [10] [11] intro-
duced concept of SOM, followed by [11] make development and applications.
[12] [13] make applications to Robtics, [14] [15] give examples in
Geo-Self-Organizing Map (GEO-SOM). In [16], constructive SOM are called
SAM-SOM family. SOM can be used for exploring the clustering of genes in the
medical field [17].
3. Data and Methodology
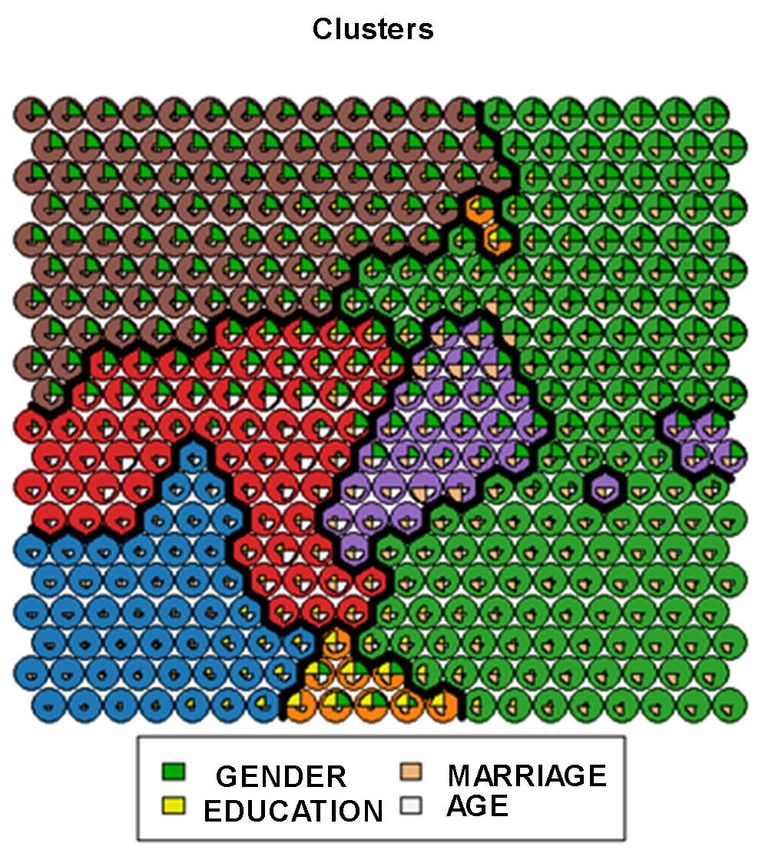
We are using default of credit card individual default data set. We used 4 va-
riables: Age, Gender, Marriage and Education of the data set to conduct numer-
ical training through SOM. In Figure 1, it plots the distribution of data by age;
In Figure 2, it plots the distribution of data by gender; In Figure 3, it plots the
distribution of data by marriage; In Figure 4, it plots the distribution of data by
education. The data is of high-dimensional (greater than 3), and hard for human
to interpret. By applying SOM segmentation, the data can be reduced to lower
dimension, while keeping its original topology property.
4. Numerical Results
Figure 5 gives the result of clusters through SOM. The cluster result has well
preserved the topological properties of the original data, i.e. the clusters are well
Figure 1. Data distribution by age.
DOI: 10.4236/ajcm.2018.83015 199 American Journal of Computational Mathematics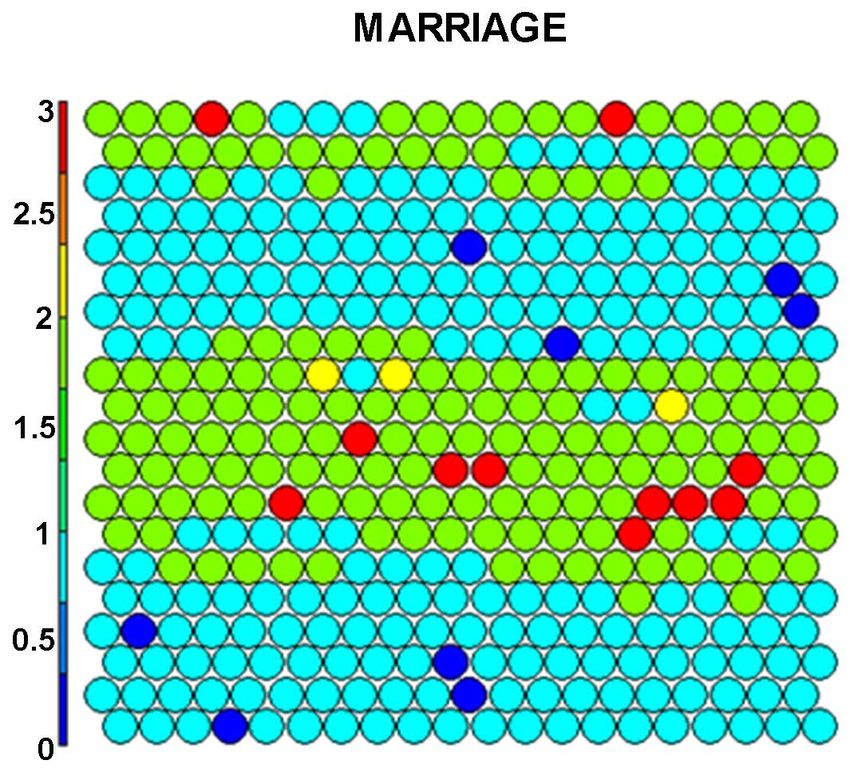
H. Wu, C.-C. Wang

                               Figure 2. Data distribution by gender.

                               Figure 3. Data distribution by marriage.

                               Figure 4. Data distribution by education.

DOI: 10.4236/ajcm.2018.83015      200               American Journal of Computational Mathematics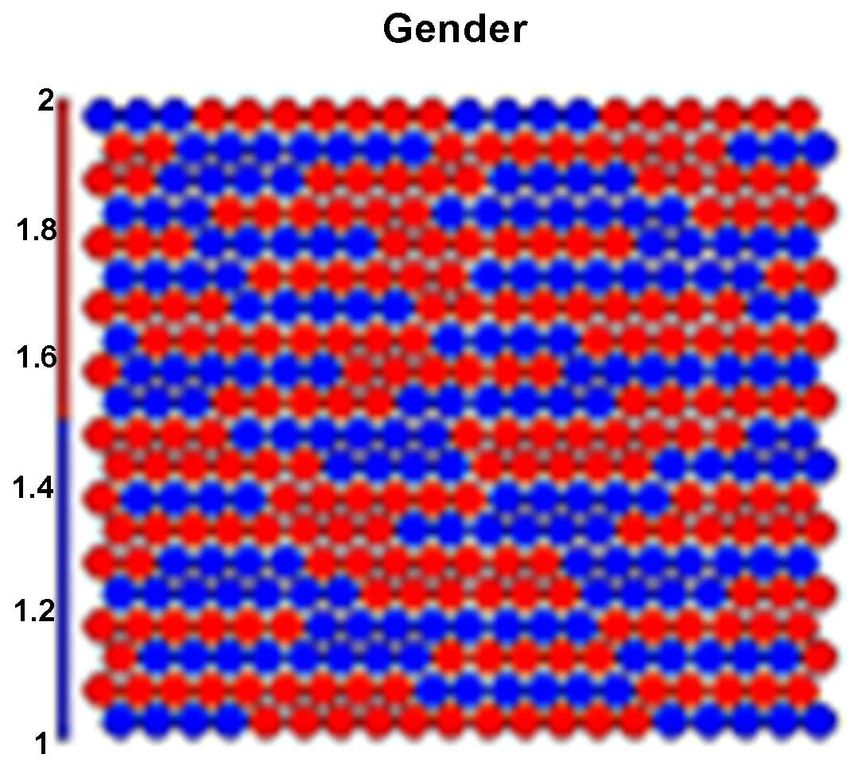
H. Wu, C.-C. Wang

                                                  Figure 5. Cluster by SOM.

                               separated. This is a much-desired property for multivariate clustering. Normally
                               multivariate clustering will separate data in a higher dimensional space, its
                               2-dimensional projection could be chaos.
                                  However, in the result of SOM, Figure 5, it is clear the 2-dimenisonal projec-
                               tion of data still possesses clear boundary, and hence the data maintained its to-
                               pological property.

                               5. Conclusion
                               The SOM method has advantages of data compression. That is, high-dimensional
                               space samples data are mapped into low-dimensional space while keeping the
                               topology unchanged. SOM has clear advantages in this aspect, which other wild-
                               ly used methods such as PCA or LDA do not have. Regardless of how many spa-
                               tial dimensions the input sample data have, it can be mapped in one area of the
                               SOM output layer. The SOM method extracts, grasps and retains features. After
                               simulating process, the vectors in high-dimensional space can be more clearly
                               expressed in the low-dimensional feature space. Therefore, the mapping is not
                               only a simple data compression, but also a discovery of the law.

                               Acknowledgements
                               We thank UCI Machine Learning Repository
                               (https://archive.ics.uci.edu/ml/datasets/default+of+credit+card+clients) for pro-
                               viding the data.

                               References
                               [1]   Von der Malsburg, C (1973) Self-Organization of Orientation Sensitive Cells in the
                                     Striate Cortex. Kybernetik, 14, 85-100. https://doi.org/10.1007/BF00288907
                               [2]   Kohonen, T. (1982) Self-Organized Formation of Topologically Correct Feature

DOI: 10.4236/ajcm.2018.83015                         201               American Journal of Computational Mathematics
H. Wu, C.-C. Wang
Maps. Biological Cybernetics, 43, 59-69. https://doi.org/10.1007/BF00337288
[3] Openshaw, S., Blake, M., Wymer, C., et al. (1995) Using Neurocomputing Methods
to Classify Britain’s Residential Areas. In: Fisher, P., Ed., Innovations in GIS, Vol. 2,
Taylor and Francis, 97-111.
[4] Openshaw, S. and Openshaw, C. (1997) Artificial Intelligence in Geography. John
Wiley & Sons, New York.
[5] Openshaw, S. (1998) Building Automated Geographical Analysis and Exploration
Machines. In: Longley, P.A., Brooks, S.M. and Mcdonnell, B., Eds., Geocomputa-
tion: A Primer, Macmillan Wiley, Chichester, 95-115.
[6] Guo, D., Peuquet, D. and Gahegan, M. (2003) ICEAGE: Interactive Clustering and
Exploration of Large and High-Dimensional Geodata. GeoInformatica, 7, 229-253.
https://doi.org/10.1023/A:1025101015202
[7] Skupin, A. and Fabrikant, S. (2003) Spatialization Methods: A Cartographic Re-
search Agenda for Non-Geographic Information Visualization. Cartography and
Geographic Information Science, 30, 99-119.
https://doi.org/10.1559/152304003100011081
[8] Ji, C.Y. (2000) Land-Use Classification of Remotely Sensed Data Using Kohonen
Self-Organizing Feature Map Neural Networks. Photogrammetric Engineering and
Remote Sensing, 66, 1451-1460.
[9] Jianwen, M. and Bagan, H. (2005) Land-Use Classification Using ASTER Data and
Self-Organized Neutral Networks. International Journal of Applied Earth Observa-
tion and Geoinformation, 7, 183-188. https://doi.org/10.1016/j.jag.2005.01.003
[10] Kohonen, T. (2001) Self-Organizing Maps. 3rd Edition, Springer Press, Berlin.
https://doi.org/10.1007/978-3-642-56927-2
[11] Cuadros-Vargas, E. and Romero, R. (2002) A SAM-SOM Family: Incorporating
Spatial Access Methods into Constructive Self-Organizing Maps. Proceedings of the
International Joint Conference on Neural Networks, Honolulu, 12-17 May 2002,
1172-1177. https://doi.org/10.1109/IJCNN.2002.1007660
[12] Sayers, C. (1991) Self Organizing Feature Maps and Their Applications to Robotics.
[13] De Barreto, G.A., Araújo, A.F.R. and Ritter, H.J. (2003) Self-Organizing Feature
Maps for Modeling and Control of Robotic Manipulators. Journal of Intelligent and
Robotic Systems, 36, 407-450. https://doi.org/10.1023/A:1023641801514
[14] Bação, F., Lobo, V. and Painho, M. (2004) Geo-Self-Organizing Map (Geo-SOM)
for Building and Exploring Homogenous Regions. In: Egenhofer, M.J., Freksa, C.
and Miller, H.J., Eds., Geographical Information Science, Lecture Notes in Com-
puter Science, Vol. 3234, Springer, Berlin, 22-37.
[15] Bação, F., Lobo, V. and Painho, M. (2005) The Self-Organizing Map, the Geo-SOM,
and Relevant Variants for Geosciences. Computers and Geosciences, 31, 155-163.
https://doi.org/10.1016/j.cageo.2004.06.013
[16] Cuadros-Vargas, E. and Romero, R.A.F. (2005) Introduction to the SAM-SOM and
MAM-S SOM Families. Proceedings of the International Joint Conference on Neur-
al Networks, August 2005, 2966-2970.
[17] Mwasiagi, J.I. (2011) Self-Organizing Maps-Applications and Novel Algorithm De-
sign. InTech, London, 714 p.
DOI: 10.4236/ajcm.2018.83015 202 American Journal of Computational MathematicsYou can also read