Method for assessing the energy efficiency of a vehicle taking into account the load under operating conditions
←
→
Page content transcription
If your browser does not render page correctly, please read the page content below
E3S Web of Conferences 264, 05033 (2021) https://doi.org/10.1051/e3sconf/202126405033
CONMECHYDRO - 2021

 Method for assessing the energy efficiency of a
 vehicle taking into account the load under
 operating conditions
 Umidulla Abdurazzokov*, Bakhramjan Sattivaldiev, Ravshan Khikmatov, and Shakhnoza
 Ziyaeva
 Tashkent State Transport University, Tashkent, Uzbekistan

 Abstract. In operation conditions, the transport work of a vehicle is
 estimated by the increment in the mass of the freight over the distance
 traveled. This criterion does not characterize the mechanical work of the
 vehicle in the transport process. Without analyzing the energy costs of
 performing mechanical work, it is impossible to assess the energy
 efficiency of a vehicle.
 The energy efficiency of a vehicle is defined as the ratio of the
 mechanical work performed by the vehicle to the potential energy of the
 source. In this paper, it is proposed to determine the engine torque by
 fuel consumption. The engine torque value depends on the energy
 required for driving the vehicle.
 Based on the analysis of the results of computational and experimental
 studies, a method for assessing the energy efficiency of a vehicle with an
 internal combustion engine is proposed. The reliability of the results
 obtained is substantiated by the test results and the available information
 in practice.

 1 Introduction
 In the world, research has been carried out aimed at solving the problems of reducing
 transport costs [1, 4, 8, 17], efficient use of vehicle resources and operating materials [11,
 12, 15], ensuring environmental and road traffic safety [2, 3], operational control of the
 established normative indicators [7, 14, 16], the energy efficiency of vehicle [5, 6, 9, 10,
 13]. The criteria and methods proposed in these studies for assessing the energy
 efficiency of vehicles do not fully take into account road loads and driving modes under
 operating conditions, which leads to low use of the structurally built potential of the
 structure and operating materials. Consequently, a study to improve the efficiency of
 using operational materials with the introduction of modern intelligent systems in
 determining the parameters of the movement of vehicles, to improve the criterion for
 assessing the energy efficiency of vehicles taking into account the load under operating
 conditions is relevant.
 Purpose of the study: improvement of the method for assessing the energy efficiency

 *
 Corresponding author: abdurazzoqovumid@gmail.com

© The Authors, published by EDP Sciences. This is an open access article distributed under the terms of the Creative Commons
Attribution License 4.0 (http://creativecommons.org/licenses/by/4.0/).
E3S Web of Conferences 264, 05033 (2021) https://doi.org/10.1051/e3sconf/202126405033
CONMECHYDRO - 2021

 of a vehicle, taking into account the load under operating conditions.
 Research objectives: to analyze the existing methods for assessing the energy
 efficiency of vehicles; to develop a criterion for assessing the energy efficiency of
 vehicles; to improve the method for assessing the energy efficiency of a vehicle taking
 into account the load under operating conditions

 2 Methods
 Based on the analysis of the studies, it was revealed that the current indicators of transport
 work, such as t∙km, km, do not fully take into account the load under operating conditions.
 In this regard, it is proposed to consider the mechanical energy of the vehicle, determined
 by the energy index E [J], necessary to overcome the forces of resistance to movement
 during transportation and to assess the compliance with the parameters of real operating
 conditions.
 When transported on a route, the vehicle operates in traction mode and
 deceleration/braking mode. The rest of the modes that characterize the typical mode of
 movement of the vehicle on the route are considered non-production. Based on this, the
 load on the structure is determined by the mechanical energy on the driving wheels of the
 vehicle and is described by the following formula:

 = + (1)

 where EA, EAd is mechanical energy, respectively, in traction mode and
 deceleration/braking mode, J.
 Based on the provisions of the vehicle theory, the mechanical energy required to
 overcome the forces of resistance to the movement of the vehicle in traction mode can be
 described by the following formula

 = ∫ ( + + ) = ∫ (2)

 where Pi, Pψ, Pa are respectively, the resistance forces of inertia, road, and air, N; Sk, Si are
 respectively, the final and initial distance traveled, m; tf, ti are respectively, the final and
 initial time of movement, s.
 Power delivered to the driving wheels of the vehicle

 = = ( + + ) (2)

 Similarly, to determine the power realized on the driving wheels of a vehicle, it is
 required to determine the kinematic and dynamic parameters of the dependence Nk=f(Mk,
 ωk).
 The angular velocity on the driving wheels of the vehicle is determined by the well-
 known formula

 = (3)

 where Vv is vehicle speed, m/s; rk is rolling radius of driving wheels, m.
 Using transmission ratios Utr, a given vehicle, engine crankshaft angular velocity ωk is
 determined by the following relationship

 = тр = (4)

 2
E3S Web of Conferences 264, 05033 (2021) https://doi.org/10.1051/e3sconf/202126405033
CONMECHYDRO - 2021

 To date, the torque on the driving wheels of the car Mk determined by an experimental
 method on a bench or using a dynamometer in road conditions [18].
 The main parameter in ensuring the energy and environmental performance of
 automobile engines is the excess air ratio λ, and the range of ensuring reliable ignition of
 the fuel is 0.7-1.3. The motor's high thermodynamic efficiency is achieved at λ = [1 –
 1.1]; therefore, a high specific fuel consumption ge is achieved in this range. To ensure
 efficient operation of the catalytic converter on modern engines with a homogeneous
 mixture, λ = 1. In diesel engines λ = 1 is provided only near the torch, and the total
 volume can reach up to 1.7. The remaining volume of the cylinder is filled with exhaust
 gases using a recirculation system, which increases the environmental friendliness of the
 engine. Based on this, it can be established that the torque of diesel engines does not
 depend on the amount of air but directly depends on fuel consumption. Under vehicle
 operating conditions, it is difficult to measure engine torque but can be indirectly
 determined through fuel consumption Me=f(Qs).
 According to the vehicle theory, the fuel consumption is determined by the formula

 = = , (5)
 36 36

 where Me is effective engine torque, Nm; geN is specific fuel consumption of the
 engine at maximum power, g/kWh; Kω is coefficient taking into account the change in
 specific fuel consumption ge depending on the angular speed of the engine crankshaft ωe;
 KI is coefficient taking into account the change in specific fuel consumption ge depending
 on the degree of use of engine power I; Utr is transmission ratio; ρТ is fuel density, kg/l.
 Since at a constant angular speed of the crankshaft, the torque value remains constant
 depending on the external load, this value remains at one rotation of the crankshaft.
 Therefore, it will be expedient to determine the directional fuel consumption per rotation
 of the engine crankshaft in a given mode. To do this, you need to use the hourly fuel
 consumption
 = , (6)

 hence the value of the hourly fuel consumption is determined for one rotation of the
 crankshaft as follows

 = , (7)
 1800

 Based on the provisions of the vehicle theory, arbitrarily setting the parameters of the
 driving conditions and load Vv, mv, jv, ψ the following equations determine the forces of
 resistance to motion

 = ; = ; = 2 (8)

 where mv is vehicle weight with cargo, kg; ja is vehicle acceleration, m/s2; δ is
 coefficient of accounting for rotating masses; g is free fall acceleration, m/s2; ψ is road
 drag coefficient; ce is body streamline factor, Hs2/m2.
 From the theory of the vehicle, it is known that the sum of the resistance forces is
 equal to the tractive force on the driving wheels, which is described by the following
 formula

 3
E3S Web of Conferences 264, 05033 (2021) https://doi.org/10.1051/e3sconf/202126405033
CONMECHYDRO - 2021

 = + + = (9)

 respectively through the gear ratio Utr and transmission efficiency ηtr a given vehicle,
 the engine torque is determined Ме

 ( ( + ) + 2 )
 = = (10)

 Based on the data obtained, matrix arrays of fuel consumption and engine torque
 values corresponding to one rotation of the engine crankshaft are formed.
 With an arbitrary choice of the values of the parameters of the driving conditions, it is
 necessary to take into account the operating range of the engine, with the boundary
 conditions for the angular speed of the crankshaft ωmax and ωmin, as well as maximum
 engine torque Memax. It is advisable to set such load parameters that would cover a large
 part of the engine's operating range.
 Tables 1 - 4 show the fuel consumption values Gn and engine torque Me on the
 example of trucks ISUZU NQR71 and MAN TGS 26.400.

 3 Results and Discussion
 Analysis of tables – 1-4 shows that with an increase in kinematic and dynamic loads, fuel
 consumption Gn and engine torque Me increase proportionally. The results in tables – 1-4
 characterize the partial modes of engine operation depending on external loads.
 Table.1. Matrix array of fuel consumption values Gn at different load modes of operation ISUZU
 NQR71
 ̅̅̅̅
 ̅̅̅̅
 – relative change in gross vehicle weight
 0,364 0,523 0,682 0,841 1,000
 0.19 0.019 0.024 0.029 0.033 0.082
 0.27 0.020 0.025 0.029 0.033 0.080
 0.35 0.021 0.026 0.031 0.034 0.080
 0.43 0.023 0.028 0.032 0.036 0.082
 0.51 0.026 0.030 0.034 0.037 0.086
 0.59 0.029 0.033 0.036 0.040 0.092
 0.68 0.032 0.035 0.039 0.042 0.096
 0.76 0.035 0.038 0.042 0.045 0.090
 0.84 0.038 0.042 0.045 0.049 0.093
 0.92 0.042 0.046 0.050 0.054 0.060
 1.00 0.046 0.051 0.056 0.063 0.071

 Note:
 ̅̅̅ ̅ is crankshaft relative angular velocity.

 4
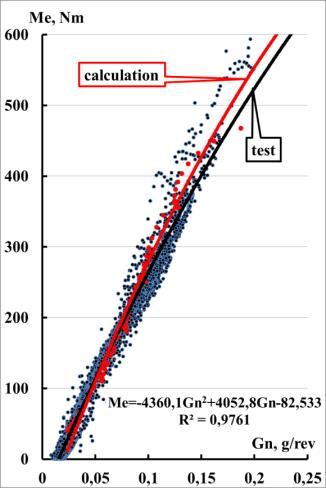
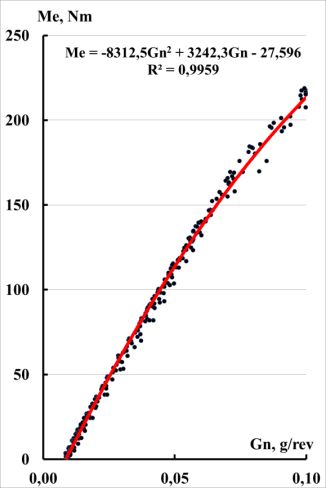
E3S Web of Conferences 264, 05033 (2021) https://doi.org/10.1051/e3sconf/202126405033
CONMECHYDRO - 2021

 Tabl.2. Matrix array of fuel consumption values Gn at different load modes of operation MAN TGS
 26.400
 ̅̅̅̅
 ̅̅̅̅
 – relative change in gross vehicle weight
 0.175 0.412 0.619 0.825 1.000
 0.19 0.137 0.155 0.198 0.259 0.275
 0.27 0.158 0.168 0.211 0.259 0.380
 0.35 0.181 0.181 0.224 0.268 0.507
 0.43 0.204 0.192 0.236 0.279 0.468
 0.51 0.228 0.204 0.249 0.292 0.452
 0.59 0.253 0.216 0.261 0.305 0.447
 0.68 0.279 0.228 0.273 0.319 0.613
 0.76 0.308 0.240 0.285 0.336 0.461
 0.84 0.347 0.251 0.299 0.359 0.481
 0.92 0.416 0.262 0.317 0.396 0.519
 1.00 0.569 0.275 0.350 0.469 0.398
 Table.3. Matrix array of engine torque values Me at different load modes of operation ISUZU
 NQR71
 ̅̅̅̅
 ̅̅̅̅
 – relative change in gross vehicle weight
 0.364 0.523 0.682 0.841 1.000
 0.19 39.77 55.52 71.27 87.03 255.04
 0.27 44.06 59.95 75.84 91.73 259.88
 0.35 49.88 65.96 82.03 98.11 266.45
 0.43 57.22 73.54 89.85 106.17 274.75
 0.51 66.09 82.70 99.30 115.91 284.77
 0.59 76.49 93.43 110.38 127.32 296.52
 0.68 88.42 105.75 123.08 140.40 300.48
 0.76 101.87 119.64 137.40 155.17 287.14
 0.84 116.86 135.11 153.36 171.60 285.03
 0.92 133.37 152.15 170.94 189.72 208.50
 1.00 151.40 170.77 190.14 209.51 228.88

 Table.4. Matrix array of engine torque values Me at different load modes of operation MAN TGS
 26.400
 ̅̅̅̅
 ̅̅̅̅
 – relative change in gross vehicle weight
 0.175 0.412 0.619 0.825 1.000
 0.19 389.48 475.57 692.69 909.82 953.46
 0.27 451.95 498.98 717.88 936.79 1267.83
 0.35 526.63 526.97 748.00 969.03 1581.98
 0.43 613.53 559.53 783.04 1006.54 1583.19
 0.51 712.63 596.67 823.00 1049.33 1584.58
 0.59 823.95 638.39 867.89 1097.39 1586.13
 0.68 947.48 684.68 917.70 1150.72 1900.48
 0.76 1083.23 735.55 972.44 1209.33 1589.75
 0.84 1231.18 791.00 1032.10 1273.21 1591.82
 0.92 1391.35 851.02 1096.69 1342.36 1594.05
 1.00 1563.73 915.62 1166.20 1416.78 1283.35

 Based on the data of the matrix arrays using the least squares method, the regression
 equations are determined Me=f(Gn) (Figure - 1). The resulting regression equations
 Me=f(Gn) show the correlation dependence of the engine torque Me on the fuel
 consumption Gn.

 5
E3S Web of Conferences 264, 05033 (2021) https://doi.org/10.1051/e3sconf/202126405033
CONMECHYDRO - 2021

 a b
 Fig.1. Regression equations Me=f(Gn) on the example of trucks:
 a) ISUZU NQR71; b) MAN TGS 26.400
 Correlation analysis of the obtained regression equations shows a high degree of
 dependence, the coefficient of determination R2 makes up for ISUZU NQR71 – 0,9956
 and MAN TGS 26.400 – 0.979. In the course of the correlation analysis, linear and
 polynomial data approximations were considered. Linear correlation showed a high
 degree of dependence Me=f(Gn) (ISUZU NQR71 – 0,973, MAN TGS 26.400 – 0,959).
 However, as the fuel consumption tends to infinity, the value of the regression equation
 also tends to infinity, which does not take into account the design features of the engine in
 terms of the maximum torque value.
 The polynomial correlation dependence is determined by solving the system of
 equations, as a result of which the coefficients of the regression equation are revealed
 Me(Gn)=aGn2+bGn+c.
 Regression equation coefficients:
 for truck ISUZU NQR71: a=-18831; b=5643,2; c=-68,446.
 for truck MAN TGS 26.400: a=-3997,4; b=6047,2; c=-418,52.
 The difference between regression equations of a quadratic, cubic, or more character
 does not exceed 1 %.
 To assess the reliability of the regression equations Me=f(Gn), the experimental data of
 the American laboratory «National Vehicle and Fuel Emissions Laboratory» and
 «National Center for Advanced Technology» (Figure 2) [19, 20] were used.

 6
E3S Web of Conferences 264, 05033 (2021) https://doi.org/10.1051/e3sconf/202126405033
CONMECHYDRO - 2021

 a b
 Fig. 2. Approbation of the results of the regression equation Me=f(Gn) with experimental data on the
 example of cars:
 a) FORD 1.6 L EcoBoost; b) Mercedes E350 BlueTEC.
 The vehicles are equipped with the Common Rail system. According to the US
 standard, the Mercedes E350 BlueTEC was tested on a US06 driving cycle, which
 indicates the functionality of the regression equation in vehicle acceleration modes, and
 the FORD 1.6L EcoBoost was tested on steady-state engine operating conditions. The
 calculated results of the regression equation and tests of the Mercedes E350 BlueTEC
 differ by almost 10% at high engine loads.
 Based on the foregoing, it can be established that to determine the mechanical energy
 required to overcome the forces of resistance to movement in the traction mode; the main
 input data are GT, ma, Va, ωe, rk – respectively, the hourly fuel consumption, the mass of
 the vehicle, the vehicle speed, the angular velocity of the crankshaft, the rolling radius of
 the driving wheels and the main technical characteristics of the given vehicle.
 According to formula (7), GT is converted into a fuel consumption corresponding to
 one revolution of the crankshaft Gn and using the regression equation Me=f(Gn), the
 engine torque is determined. However, to bring the torque Me to the driving wheels, to
 further determine Mk, it is required to determine the gear ratio of the transmission Utr.
 The transmission ratio is determined as follows

 = (11)

 according to this, the torque applied to the driving wheels

 = тр тр = тр тр ( 2 + + ) (12

 where a, b, c are regression equation coefficients, Me=f(Gn) displayed separately for each
 car model.
 Based on the derived formulas, the mechanical energy of the vehicle in traction mode
 is determined by the following formula

 = ∫ = ∫ тр ( 2 + + ) (13)

 7
E3S Web of Conferences 264, 05033 (2021) https://doi.org/10.1051/e3sconf/202126405033
CONMECHYDRO - 2021

 The revealed equation of the mechanical energy of the car is measured by the energy
 index - J.

 4 Conclusion
 The reliability of the results of the regression equation of the dependence of the engine
 torque on the fuel consumption Me= f(Gn) is 95-97%, depending on the type and model of
 the car.
 It was found that mechanical energy, in contrast to the current indicator of transport
 work [t∙km], varies in a wide range and has a hyperbolic character concerning the speed of
 movement and concerning the mass of the load and the coefficient of resistance of the
 road, it has linear patterns of change.
 The proposed formula (13) takes into account the traction modes of the vehicle on the
 route, the resistance of the road, the aerodynamic parameters of the body and the mass of
 the vehicle together with the load, which together determine the real load on the structure
 in the transport mode under operating conditions.
 The practical application of the research results will increase the efficiency of vehicle
 operation. By improving the monitoring system for the energy efficiency of a vehicle
 using on-board electronic systems, it will reduce the costs of technical operation and
 emissions on the environment and save energy resources.

 References
 1. Amir Izadi, Mohammad Nabipour & Omid Titidezh, Cost Models and Cost Factors
 of Road Freight Transportation: A Literature Review and Model Structure, Fuzzy
 Information and Engineering, DOI: 10.1080/16168658.2019.1688956. (2020).
 2. Bishop, J. D. K., Martin, N. P. D. and Boies, A. M. Quantifying the role of vehicle
 size, powertrain technology, activity and consumer behaviour on new uk passenger
 vehicle fleet energy use and emissions under different policy objectives. Applied
 Energy, 180, pp 196–212. (2016).
 3. Carlan V, Sys C, Vanelslander T. Innovation in road freight transport: quantifying
 the environmental performance of operational cost-reducing practices.
 Sustainability, 11 (8). 2212. (2019).
 4. Duan L, Tavasszy LA, Rezaei J. Freight service network design with heterogeneous
 preferences for transport time and reliability. Transp Res E Logist Transp Rev.
 (124), pp 1–12.(2019).
 5. Gao, Y. and Checkel, M. D. Experimental measurement of on-road CO2 emission
 and fuel consumption functions. SAE Paper No. 2007-01-1610. (2007).
 6. Guzzella, L.; Sciarretta, A. Vehicle Propulsion Systems. Introduction to Modeling
 and Optimization, Springer Verlag: Berlin, Germany, p 418. (2013).
 7. Hong, M., Ouyang, M. and Shen, T. Torque-based optimal vehicle speed control.
 Int. J. Automotive Technology 12,(1), pp 45–49. (2011).
 8. IEA, Policy Pathways: Improving the Fuel Economy of Road Vehicles–A Policy
 Package. International Energy Agency. (2012).
 9. Kim, D.W., Yoon, J.W., Park, S. et al. Fuel consumption parameters for realizing
 and verifying fuel consumption prospect algorithm of vehicle driving route
 information system. Int.J Automot. Technol. (14), pp 955–964,
 https://doi.org/10.1007/s12239-013-0105-0. (2013).
 10. Kropiwnicki, J., Kneba, Z. & Ziółkowski, M. Test for assessing the energy
 efficiency of vehicles with internal combustion engines. Int.J Automot. Technol.

 8
E3S Web of Conferences 264, 05033 (2021) https://doi.org/10.1051/e3sconf/202126405033
CONMECHYDRO - 2021

 (14), pp 479–487 https://doi.org/10.1007/s12239-013-0052-9. (2013).
 11. Kropiwnicki, J. Identification of real vehicle operating conditions. FISITA 2010,
 World Automotive Cong., Budapest, F2010-G-004. (2010).
 12. Liang, Z., Chen, L., Alam, M. S., Rezaei, S. Z., Stark, C., Xu, H. and Harrison, R.
 M. Comprehensive chemical characterization of lubricating oils used in modern
 vehicular engines utilizing GCxGC-TOFMS. Fuel, (220), pp 792–799. (2018).
 13. Leung, D., Williams, D. Modelling of Motor Vehicle Fuel Consumption and
 Emissions Using a Power-Based Model. Environ Monit Assess (65), pp 21–29.
 https://doi.org/10.1023/A:1006498328936. (2000).
 14. Mansour, C., Clodic, D. Optimized energy management control for the Toyota
 Hybrid System using dynamic programming on a predicted route with short
 computation time. Int.J Automot. Technol. (13), pp 309–324
 https://doi.org/10.1007/s12239-012-0029-0. (2012).
 15. Ping, Y., Long, W., Feng, L., Chen, L., Cui, J. and Gong, W. Investigation of
 evaporation and autoignition of isolated lubricating oil droplets in natural gas
 engine in-cylinder conditions. Fuel (235), pp 1172–1183. (2019).
 16. Saboohi, Y. and Farzaneh, H. Model for developing an eco-driving strategy of a
 passenger vehicle based on the least fuel consumption. Applied Energy, (86), pp
 1925–1938. (2009).
 17. Sergio Camisón-Haba & Jose A. Clemente-Almendros A global model for the
 estimation of transport costs, Economic Research-Ekonomska Istraživanja, 33 (1),
 pp 2075-2100, DOI: 10.1080/1331677X.2019.1584044. (2020)
 18. Vanyeyev, S. M., Miroshnichenko, D. V., Rodymchenko, T. S., Protsenko, M.,
 Smolenko, D. V. Data measuring system for torque measurement on running shafts
 based on a non-contact torsional dynamometer. Journal of Engineering Sciences,
 Vol. 6 (2), pp. 15-23, doi: 10.21272/jes.2019.6(2).e3. (2019).
 19. 2013 Mercedes E350 BlueTEC Vehicle Diesel Fuel – Test Data Package. Version
 2018-09. Ann Arbor, MI: US EPA, National Vehicle and Fuel Emissions
 Laboratory, National Center for Advanced Technology, (2018).
 20. 2013 Ford 1.6L EcoBoost Engine Tier 2 Fuel - Test Data Package. Version 2018-
 10. Ann Arbor, MI: US EPA, National Vehicle and Fuel Emissions Laboratory,
 National Center for Advanced Technology, (2018).

 9
You can also read