Trends in Retail - Issue 18, Spring 2020 - Open Government ...
←
→
Page content transcription
If your browser does not render page correctly, please read the page content below
Trends
in Retail

Issue 18, Spring 2020
Trends in Retail
Issue 18, Spring 2020
Content online. In terms of food service facilities, only 26
COVID-19 and emerging retail trends percent of survey respondents stated that they were
o Decreasing demand at restaurants concerned about going to a restaurant since the
start of the outbreak. Of those who stated they were
o Increasing demand at grocery stores
concerned, 22 percent stated they were avoiding
Changing retail landscape restaurants and four percent are opting to use food
o New delivery methods: grocery stores delivery apps.
o New delivery methods: restaurants
Data highlights Decreasing demand at
restaurants
COVID-19 and emerging retail Statistics have started to show that the restaurant
trends industry has been experiencing decreasing sales –
In early March 2020, Alberta recorded its first case despite changes to business structure. Restaurants
of the novel coronavirus or COVID-19. Since then, Canada’s Restaurant Outlook Survey revealed that
physical distancing measures have come to a large percentage of restaurants have experienced
substantially impact the way that food service a decrease in sales volume.2 Figure 1 displays the
industries and grocery stores operate. This issue of results of this survey.
Trends in Retail will examine particular trends that
have emerged due to COVID-19. Consumer Figure 1. Was your total volume (on same-store
demands have changed and COVID-19 has driven a basis), higher, lower, or about the same as it was
during the same period in 2019?
digital transformation within grocery stores and the
96%
food service industry. 100%
78%
80%
A recent survey asked respondents if they were 60% 46%
concerned about potential health risks when they go 34%
40%
to the grocery store.1 The survey concluded that 65 21%
20% 14%
percent of Canadians are concerned about the risks 4% 1% 3%
at grocery stores. Of those who were concerned, 57 0%
percent of surveyed Canadians are still buying First two weeks First two weeks First two weeks
of February of March of April
groceries for themselves, five percent have asked
others to go to the grocery store for them and three Higher About the Same Lower
percent have opted to purchase their groceries Source: Restaurants Canada
1 https://cdn.dal.ca/content/dam/dalhousie/pdf/sites/agri- 2https://www.restaurantscanada.org/resources/impact-of-covid-19-
food/Agri_food%20Analytics%20Lab%20-%20COVID-19.pdf devastates-restaurant-industry/
Economics and Competitiveness Branch, Alberta Agriculture and Forestry
©2020 Government of Alberta | Published: June 2020Increasing demand at grocery
stores
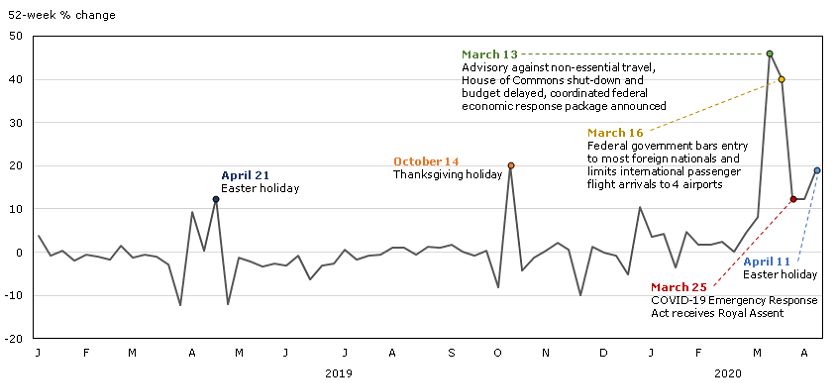
Statistics Canada reports that grocery store sales upward with a 19 percent increase in year over year
experienced an upward trend in sales as consumers sales for the week ending in April 11. Figure 2
re-stocked their households with essential items. provides a more in-depth look at the 52-week
During the week ending March 21, retail grocery changes in weekly sales. As a result, many grocery
sales increased by 40 percent when compared to stores have had to make changes in response to
the same week in 2019.3 Since the March spike in changing consumer demands.
sales, grocery store sales have continued to trend
Figure 2. 52-week change in weekly sales for select grocery retailers
Source: Statistics Canada, Consumer Prices program, special tabulation
Walmart Canada reported Q1 2020 net sales growth
of 1.3 percent and stated that “[c]omp sales growth “Late in the quarter Loblaw experienced
benefited from strength in grocery and fresh, unprecedented consumer demand and
partially offset by softer sales in general stockpiling relating to COVID-19, with sales
surging in the final two weeks of March. The
merchandise and apparel.”4 In addition other result was both a sharp increase in revenue
Canadian food retailers exhibited Q1 2020 growth. and profit followed by ramp up in spending
Figure 3 shows that Loblaw Companies Ltd. Q1 to protect and benefit colleagues and
2020 retail segment sales were up 10.7 percent and customers.”5
food retail same-store growth was up 9.6 percent
from Q1 2019 sales. The company stated that:
3 5
https://www150.statcan.gc.ca/n1/daily-quotidien/200511/dq200511a- https://s1.q4cdn.com/326961052/files/doc_financials/2020/q1/EN_LC
eng.htm?HPA=1 L_Q1-2020_RTS.pdf
4 https://corporate.walmart.com/media-library/document/q1-fy20-
earnings-presentation/_proxyDocument?id=0000016a-be96-ddec-
affe-fedf790b0001
Economics and Competitiveness Branch, Alberta Agriculture and Forestry
©2020 Government of Alberta | Published: June 2020Figure 3. Loblaw Companies Ltd., Q1 2020
12.0% 10.7%
9.6%
10.0%
8.0%
6.0% 2019
2020
4.0% 3.1%
2.0%
2.0%
0.0%
Consolidated: Revenue Growth Food retail same-store sales growth
Source: Loblaw Companies Ltd.
Changing retail landscape Click-and-Collect services
Undoubtedly, retailers have been impacted by A seemingly overnight change in business structure
COVID-19. Social distancing directives have has changed the way consumers purchase their
drastically changed how consumers purchase food groceries. Studies have indicated that nine percent
products and retailers have had to respond of Canadians have started to grocery shop online for
accordingly. Grocery stores and food service the first time. A survey commissioned by PayPal
providers have had to provide alternative delivery indicated that in early April, 30 percent of Canadians
methods and an increase in digital touchpoints. were shopping online for groceries. This is a 58
percent increase from a comparable survey
Many grocery stores have made changes to how conducted four weeks earlier.7 More recently, a
they operate. Business hours have been reduced, survey indicated that 17 percent of surveyed
while hygiene standards have increased. Numerous Canadians stated that they tried curbside pickup for
grocery stores have implemented certain hours for the first time during the pandemic, whereas 10
elderly and vulnerable customers. Plastic panels and percent tried grocery delivery for the first time.8
two-metre social distancing rules are now the norm
at the checkout. In addition, grocery stores have Loblaw’s PC Express service has been experiencing
attempted to minimize the spread of the virus by an increase. The company states that order volumes
limiting the number of customers allowed in-store, are three times higher than normal – a growth that
asking customers to pay through contactless was not expected by the company for years. As a
methods and closure of bulk counters, self-serve result, click-and-collect services had to be scaled up
bars and bread slicing stations.6 rapidly in order to respond to an increased demand
and the company states that have taken steps to
New delivery methods: expand PC Express e-commerce services and
grocery stores eliminate fees and reduce prices associated with PC
Express services.
Grocery stores have adapted their services in
response to COVID-19. This section examines click-
and-collect services and grocery delivery platforms.
6https://corpo.metro.ca/en/coronavirus.html 8https://www.mckinsey.com/business-functions/marketing-and-
7https://www.newswire.ca/news-releases/paypal-now-available-on- sales/our-insights/survey-canadian-consumer-sentiment-during-the-
walmart-ca-831429705.html coronavirus-crisis
Economics and Competitiveness Branch, Alberta Agriculture and Forestry
©2020 Government of Alberta | Published: June 2020Recently, foodservice distribution companies, like
New delivery methods:
Gordon Food Services and Sysco Canada, have
adjusted their business structure to include online restaurants
grocery stores with click-and-collect services.9,10 Restaurants, much like grocery stores, have been
This marks a large change in their business impacted by COVID-19. This section examines food
structures as these companies typically only sell delivery services and a trend of restaurants offering
food and non-food products to larger institutions like online grocery store services.
restaurants, healthcare facilities and educational
facilities. Furthermore, this may indicate that there A report by Restaurants Canada states that of those
has been a decrease in the demands of large restaurants still providing takeout and/or delivery
institutions and food distribution companies had to services, nine out of ten have had to add additional
expand their business portfolio. revenue streams (i.e., adding alcohol) and change
how they interact with their guests (i.e.,
Grocery delivery services contactless).11 Table 1 describes the changes that
In addition, grocery delivery apps, like Instacart, restaurants have reported making.
have witnessed an increase in demand. Instacart
has announced plans to increase their number of Table 1. Changes made by restaurants beginning
shoppers across North America by 300,000 in order March 2020
to meet increased consumer demand. In the last few Percent of Restaurants
Most Common Changes Reporting Making that
weeks, Instacart’s volume has increased by 150
Change
percent and the average consumer’s basket size Simplifying/ reducing their
64%
has increased by 15 percent. number of menu offerings
Offering contactless pick- 62%
up/curbside pick-up
Popular grocery delivery apps in Canada include:
Adding alcohol to takeout
Instacart: available across Canada and the and/or delivery menu
54%
U.S., assigns grocery stores based upon Offering contactless delivery 48%
postal code Selling grocery kits 21%
Selling meal kits 20%
Cornershop: originally popular in Latin
Adding comfort foods to the
America with recent expansion into Canada 19%
menu
with service in the Toronto area Source: Restaurants Canada’s Restaurant Outlook Survey
Inabuggy: available in select cities across
Canada including Calgary and Edmonton, Furthermore, research by Restaurants Canada
allows for purchase of groceries and alcohol revealed that the survival of a restaurant business
Spud: available in select cities including was dependent upon independent restaurants. On
Edmonton and Calgary, specializes in average, single unit operators experienced a same-
accessing organic and sustainable groceries store sales decrease of 81.3 percent in the first two
from local farmers and producers weeks of April.12 This decrease includes locations
GOcery: currently only available in Toronto, that were closed down temporarily; therefore,
partner stores include Asian supermarkets experiencing 100 percent decline in sales. On the
other hand, multi-unit locations reported that they
experienced a 73.4 percent decrease over the same
period.
9 https://www.syscoathome.com/ 12 https://www.restaurantscanada.org/resources/one-in-two-
10 https://gordonexpress.ca/ independent-restaurants-at-risk-to-permanently-close-in-the-next-
11 https://www.restaurantscanada.org/resources/down-but-not-out- three-months/
how-restaurants-are-adapting-to-the-covid19-pandemic/
Economics and Competitiveness Branch, Alberta Agriculture and Forestry
©2020 Government of Alberta | Published: June 2020Food delivery services more traditional takeout items, many restaurants,
Furthermore, food delivery services have had to like Earls, are offering meal kits and grocery items.
adapt their service with COVID-19. Many food This is a new business model that has helped some
delivery services are providing contactless delivery restaurants adjust to a change in operational
options, while others, like SkipTheDishes, are structure. However, there is evidence that this trend
requiring contactless delivery be mandatory. Other may not be here to stay. Restaurants Canada
food delivery services, like Uber Eats, have opted to reports that only one in ten restaurants state they
waive delivery fees for independent restaurants in will continue to sell grocery items once emergency
Canada and the U.S. measures are eased.11
In mid-February, reports indicated that 39 percent of
all Canadians had tried a food delivery app at least
once.13 With COVID-19, the number of Canadians
using food delivery apps is expected to have
increased. In 2019, Canadians ordered $4.7 billion
in meals with close to $1.5 billion coming from the
use of food delivery apps. Due to COVID-19,
research suggests that food delivery apps could
generate $2.5 billion by the end of 2020.
Although there are indications that use of food
delivery services is higher than pre-virus levels,
consumers have begun to order through a
restaurant’s app or website. Figure 4 describes
trends in the use of third-party delivery and
restaurant’s websites and apps.
Figure 4. How consumers order food online
22%
36%
Third-party delivery 39%
35%
29%
78%
64%
Restaurant website and app 61%
65%
71%
February 17 to March 8 Week beginning March 16
Week beginning March 23 Week beginning March 30
Week beginning April 6
Source: Technomic
Restaurant to online grocery store
More recently, many restaurants have begun to sell
in-demand grocery items. In addition to offering
13https://cdn.dal.ca/content/dam/dalhousie/pdf/sites/agri-
food/Food%20Apps%20Report%20EN.pdf
Economics and Competitiveness Branch, Alberta Agriculture and Forestry
©2020 Government of Alberta | Published: June 2020consumers headed to grocery stores, specialty food
Data highlights
stores and beer, wine and liquor stores in order to
This section provides an update on retail and food restock their fridges and pantries.
service sales trend data in Alberta. Table 1 provides
data for retail food and beverage sales in Alberta. Furthermore, food service and drinking places sales
Table 2 provides data for food service and drinking experienced annual decreased sales of 9.4 percent
places sales in Alberta. between Q1-2019 and Q1-2020. When examining
Q1 annuals sales at a sub-category level, specialty
Annual analysis food service sales decreased by 4.2 percent,
This issue of Trends in Retail provides a comparison drinking places sales decreased by 28.9 percent,
of Q1-2019 and Q1-2020. In regards to retail food full-service restaurants sales decreased by 15.1
and beverage sales, total food and beverage stores percent and limited-service eating places sales
experienced an increase in sales by 10.4 percent decreased by 3.0 percent.
between Q1-2019 and Q1-2020. At a sub-category
level, annual Q1 sales increased for grocery stores A decrease in Q1 food service and drinking places
by 10.8 percent, specialty foods stores sales sales between 2019 and 2020 is not surprising,
increased by 15.3 percent and beer, wine and liquor especially as many food service businesses had to
stores sales increased by 6.8 percent. close their doors due to COVID-19. Figure 5 displays
monthly sales for food service and drinking places in
An annual Q1 increase in total food and beverage Alberta. Between February 2020 and March 2020,
stores may be directly attributed to COVID-19 food service and drinking places sales declined by
motivated sales. Across Canada, including Alberta, over $200 million.
Figure 5. Alberta monthly food service and drinking places sales (in thousands of dollars), January 2019 to March
2020
900,000
850,000
800,000
750,000
700,000
March 2020 food
650,000 service and drinking
600,000 places sales were
550,000 $204.4 million less than
in February 2020
500,000
450,000
400,000
Source: Statistics Canada
Economics and Competitiveness Branch, Alberta Agriculture and Forestry
©2020 Government of Alberta | Published: June 2020Quarterly analysis
In addition, this issue of Trends in Retail provides a Furthermore, food service and drinking places sales
comparison of Q4-2019 and Q1-2020 sales data. experienced decreased sales between Q4-2019 and
Between Q4-2019 and Q1-2020, total food and Q1-2020 of 19.1 percent. At a sub-category level,
beverage stores experienced a decrease in sales of specialty food services sales declined by 13.4
2.3 percent. At a sub-category level, specialty foods percent, drinking places sales declined by 32.5
stores sales declined by 21.7 percent and beer, wine percent, full-service restaurants sales declined by
and liquor stores sales declined by 18.3 percent 21.7 percent and limited-service eating places sales
between Q4-2019 and Q1-2020.14 On the other declined by 16.6 percent between Q4-2019 and Q1-
hand, grocery stores experienced Q4-2019 and Q1- 2020.
2020 growth of 3.2 percent.
Table 1. Retail food and beverage sales in Alberta (in thousands of dollars)
Q4 2019 Annual
Sub Categories Q1 2019 Q2 2019 Q3 2019 Q4 2019 Q1 2020 to Q1 Q1
2020 Change
Total Food and Beverage Stores 3,473,249 3,831,570 3,721,096 3,923,825 3,833,303 -2.3% 10.4%
Grocery Store 2,751,347 2,909,757 2,833,018 2,956,191 3,049,809 3.2% 10.8%
Specialty Food Stores 149,441 171,616 173,297 220,059 172,368 -21.7% 15.3%
Beer, Wine and Liquor Stores 572,462 750,198 714,782 747,575 611,127 -18.3% 6.8%
Source: Statistics Canada
Table 2. Food Service and Drinking Places Sales in Alberta (in thousands of dollars)
Q4 2019 Annual
Sub Categories Q1 2019 Q2 2019 Q3 2019 Q4 2019 Q1 2020 to Q1 Q1
2020 Change
Total Food Services and
2,170,120 2,434,512 2,520,075 2,431,665 1,966,725 -19.1% -9.4%
Drinking Places
Specialty Food Services 146,433 146,758 158,504 161,985 140,355 -13.4% -4.2%
Drinking Places (alcoholic
78,960 82,521 92,441 83,158 56,169 -32.5% -28.9%
beverages)
Full-Service Restaurants 966,125 1,079,254 1,112,431 1,047,942 820,507 -21.7% -15.1%
Limited-Service Eating Places 978,600 1,125,980 1,156,699 1,138,580 949,694 -16.6% -3.0%
Source: Statistics Canada
Author: Stephanie Budynski
Coordinating Researcher
Competitiveness and Market Analysis Section
Economics and Competitiveness
Branch Phone: 780-415-9773
Email: stephanie.budynski@gov.ab.ca
The views and opinions expressed in this article are those of the Economics and Competitiveness Branch and do not necessarily reflect the official policy or position of the
Ministry of Agriculture and Forestry or the Government of Alberta. Analysis performed within this article is based on limited and open source information. Assumptions made
within the analysis are not reflective of the position of the Ministry of Agriculture and Forestry nor the Government of Alberta.
14Statistics Canada defines special food services as this industry by the customer, or from a motorized vehicle or non-motorized
group comprises establishments primarily engaged in providing cart.
food services at the customer's location, at a location designated
Economics and Competitiveness Branch, Alberta Agriculture and Forestry
©2020 Government of Alberta | Published: June 2020You can also read