FEDERAL POVERTY THRESHOLD AND WHAT IT MEANS FOR KANSAS
←
→
Page content transcription
If your browser does not render page correctly, please read the page content below
68-West–Statehouse | 300 SW 10th Ave. | Topeka, Kansas 66612-1504
                                                 (785) 296-3181
kslegres@klrd.ks.gov                                                                       kslegislature.org/klrd

                                              May 13, 2021

       FEDERAL POVERTY THRESHOLD AND WHAT IT MEANS FOR KANSAS

       Developed in the early 1960s by an economist with the Social Security Administration,
the Federal Poverty Threshold (FPT) and Federal Poverty Guidelines (FPG) have become
synonymous with discussions of America’s economic health and the barrier to entry for a variety
of government assistance programs.

        The FPT has remained largely unchanged since its official adoption in 1969 as the
threshold continues to be calculated by taking three times the cost of the 1963 “economy food
plan” and accounting for inflation through the Consumer Price Index (CPI). The FPG is figured
similarly to the FPT, except that it does not account for the number of adults and children that
make up the family. The other key difference between the two measures is the FPT is released
by the U.S. Census Bureau (Bureau) toward the end of the following year1 whereas the FPG is
released by the U.S. Department of Health and Human Services (HHS) in January of the
following year.2

        The final federal poverty measure produced by the Bureau is an unofficial measure
known as the Supplemental Poverty Measure (SPM). The SPM was first introduced in 2011 for
the 2010 and utilizes a greater number of a family’s costs, incomes, and expenses in
determining the poverty level. Since its introduction, the SPM has ranged from approximately
0.5 to 1.5 percent higher than the FPT regarding the percentage of Americans in poverty.

Federal Poverty Threshold

History

        First devised in 1963–1964, the Federal Poverty Threshold (FPT) was created to
“assess the relative risks of low economic status among different demographic groups of
families with children,” not to strictly measure the number of people living in poverty. The FPT
utilized food cost studies to determine the minimum amount of money needed for families of
various sizes to obtain a minimal, but adequate, diet. This amount was then extrapolated to
account for non-food purchases and compared to a family’s cash income to determine whether
a family would be classified as impoverished.

       In 1969, the Bureau of the Budget directed all executive agencies to use a revised
version of the FPT as the official statistical measure of poverty for the federal government. The
1 The 2019 Federal Poverty Threshold was released in September 2020.
2 The 2021 Federal Poverty Guidelines were released on January 13, 2021, and were based upon 2020
  data.
primary revision was the addition of the CPI to account for changes in inflation from year to year.
Since the issuance of this directive, the calculation of FPT has remained largely unchanged
other than minor adjustments made in 19813 and the introduction of the SPM4 in 2011.
Calculating the Federal Poverty Threshold
The FPT is calculated by taking the Federal Department of Agriculture’s 1963 cost for an
individual or family utilizing the “economy food plan,” multiplying that cost by three to account for
other basic necessities, and then adjusting for inflation using the CPI.5 The FPT thus represents
a consistent level of buying power, even as the dollar amount fluctuates from year to year. Once
the figure is calculated, it is then compared against an individual’s or family’s net income to
determine their economic standing relative to the FPT.
(Cost of 1962 “Economy Food Plan” x 3) x Current CPI = FPT
Some elements included in the original FPT formula have since been removed. These
include factors such as whether a family lives on a farm or whether the head of the household
was male or female.
Due to a lack of quality data at the time it was developed, the FPT formula relies upon
several assumptions of household behavior. The first is that (as found in the 1955 study on
household food consumption) households of three or more individuals spend approximately 1/3
of their net income on food, independent of income level. As such, the formula assumes that all
families, independent of income, spend approximately 1/3 of their income on food.
The second assumption is that the proportion of a family’s food to non-food expenditures
will be maintained during changes in income. For example, if a family’s income decreases by
$3,000, the formula assumes the family will cut $1,000 from their food purchases and $2,000
from their non-food spending.
These two assumptions are combined and further extrapolated by the formula to assume
that, if a family is spending 1/3 of its income on the “economy food plan” (which provides an
“adequate” diet), the remaining 2/3 of their income would be sufficient to cover minimally
adequate non-food purchases. This is because, as discussed previously, it is assumed that all
expenses would proportionally increase or decrease with a family’s income.
A table detailing the 2019 FPT can be found in Appendix 1.
3 The adjustments in 1981 eliminated the different thresholds based on whether a family was a farm or
non-farm household and whether the head of the household was male or female.
4 The SPM is an unofficial poverty measure that broadens the definition of “family”; utilizes spending
information on clothing, shelter, and utilities in addition to food; accounts for the financial impacts
beyond cash income; and adjusts for regional differences.
5 The inclusion of CPI adjustments to account for inflation did not occur until the official adoption of the
FPT in 1969 and have since been backdated to cover FPT numbers prior to 1969.
Kansas Legislative Research Department 2 Federal Poverty Threshold and What It Means
for Kansas – May 19, 2021Calculating Income for the Federal Poverty Threshold
To determine a family’s relationship to the FPT, all of the following income is aggregated
(before tax):
● Earnings;
● Unemployment Compensation;
● Workers’ Compensation;
● Social Security;
● Supplemental Security Income;
● Public assistance;
● Veterans’ payments;
● Survivor benefits;
● Pension or retirement income;
● Interest;
● Dividends;
● Rents;
● Royalties;
● Income from estates;
● Trusts;
● Educational assistance;
● Alimony;
● Child support;
● Assistance from outside the household; and
● Other miscellaneous sources.
The family’s aggregated income is then divided by the FPT for their family size and
composition. If the result is one or lower, the family is considered to be in poverty. If the result is
greater than one, the family is considered not in poverty. These numbers are typically discussed
as a percentage of the poverty level. Examples for a family of four with two children making
$15,000 a year and $60,000 are provided below.
$15,000/$25,926 = .58 or 58.0 percent of the FPT
$60,000/$25,926 = 2.31 or 231.0 percent of the FPT
The FPT formula, as described above, is how the U.S. Census Bureau determines the
levels of poverty within the United States.
Federal Poverty Guidelines
The Federal Poverty Guidelines (FPG) are produced by the HHS and provide
operational thresholds used to determine eligibility for government assistance programs. While
the FPG are derived from the FPT, there are several key differences between the two with
regard to time frame, location, and grouping.
Kansas Legislative Research Department 3 Federal Poverty Threshold and What It Means
for Kansas – May 19, 2021The FPG are a proactive measure and are released every January to update the
eligibility thresholds for some federal assistance programs. The FPT are retroactive measures
that are typically released the following year. For example, the 2019 FPT was released in
September 2020 while the 2021 FPG were released on January 13, 2021, and were based
upon 2020 data.
The other key difference between the two is that the FPG do not differentiate among
family sizes. While the FPT has different measures based upon the number of children in a
family, the FPG provide eligibility numbers based strictly upon the total number of individuals
that comprise the family.
Additionally, the FPG provide guidelines for Hawaii and Alaska that differ from those
provided to the contiguous 48 states, and the FPG do not have separate figures for aged and
non-aged individuals or two-person households, as is found in the FPT.
A table detailing the 2020 and 2021 FPG can be found in Appendix 2.
Supplemental Poverty Measure
The Supplemental Poverty Measure (SPM) is an unofficial measure of the poverty level
that seeks to create a more accurate version of the FPT through the use of additional income
and expense data points. Since its inception in 2011, the SPM has been released every year
along with the FPT. The key differences between the FPT and SPM are found in their calculation
of the threshold for poverty and the way a family’s resources are measured.
POVERTY MEASURE CONCEPTS: OFFICIAL AND SUPPLEMENTAL
Concept Official Poverty Measure Supplemental Poverty Measure
Resource units (official family definition plus any
Families (individuals related by co-resident unrelated children, foster children, and
Measurement
birth, marriage, or adoption) or unmarried partners and their relatives) or
Units
unrelated individuals. unrelated individuals (who are not otherwise
included in the family definition).
Poverty Three times the cost of a Based on expenditure of food, clothing, shelter,
Threshold minimum food diet in 1963. and utilities (FCSU).
Vary by family size, composition, and tenure, with
Threshold Vary by family size, composition,
geographic adjustments for differences in housing
Adjustments and age of householder.
costs.
Updating Consumer Price Index for All Five-year moving average of expenditures on
Thresholds Urban Consumers: all items. FCSU.
Sum of cash income, plus non-cash benefits that
resource units can use to meet their FCSU needs,
Resource
Gross before-tax cash income. minus taxes (or plus tax credits), work expenses,
Measurements
medical expenses, and child support paid to
another household.
* Table is from the U.S. Census Bureau’s The Supplemental Poverty Measure: 2019.
Kansas Legislative Research Department 4 Federal Poverty Threshold and What It Means
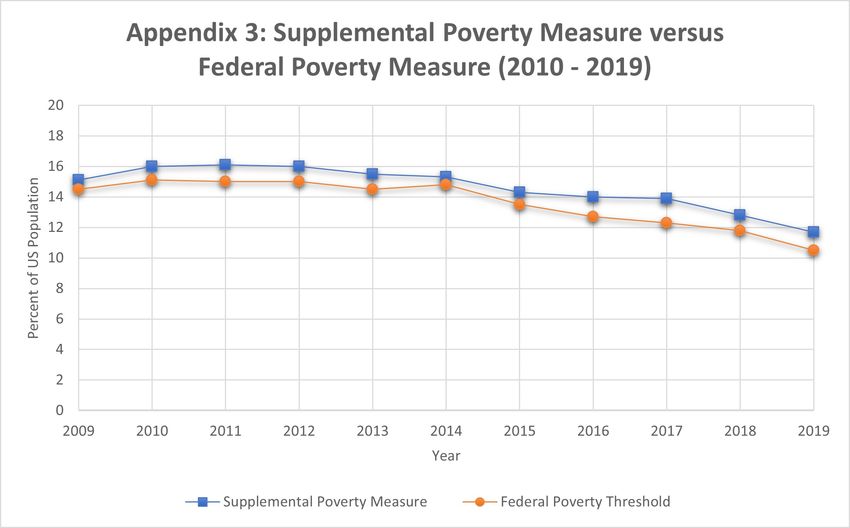
for Kansas – May 19, 2021The overall 2019 SPM was 11.7 percent of Americans living in poverty, which is 1.3
percent above the 2019 FPT of 10.5 percent of Americans living in poverty. A comparison of all
SPM versus FPT measures can be found in Appendix 3.
Income, Expenses, and the Poverty Level in Kansas
Income
In 2019, Kansans earned a per capita income of $53,426 compared to the overall U.S.
per capita income of $56,490, according to the 2019 American Community Survey (ACS)
conducted by the Bureau. When divided into households,6 approximately 26.6 percent of all
Kansas households made below $35,000 in the prior 12 months, 46.2 percent of households
made between $35,000 and $99,999, and 27.1 percent of households made $100,000 or more.
Included below is a breakdown of median incomes in Kansas based upon household
composition.
2019 American Communities Survey: Median Income in the Past 12 Months
Number of Percentage of Median Income
Households Households (dollars)
ALL HOUSEHOLDS 1,138,329 100.0% $62,087
Families 733,489 64.4% $79,006
With own children of householder under
317,647 27.9% $75,707
18 years
With no own children of householder
415,842 36.5% $81,027
under 18 years
Married-couple Families 571,620 50.2% $90,162
With own children under 18 years 223,616 19.6% $96,850
Female Householder (No Spouse) 110,580 9.7% $36,544
With own children under 18 years 66,441 5.8% $26,636
Male Householder (No Spouse) 51,289 4.5% $52,916
With own children under 18 years 27,590 2.4% $47,672
Non-family Households 404,840 35.6% $36,347
Female Householder 209,756 18.4% $31,903
Living Alone 178,349 15.7% $29,205
Not Living Alone 31,407 2.8% $54,384
Male Householder 195,084 17.1% $41,300
Living Alone 153,040 13.4% $36,812
Not Living Alone 42,044 3.7% $63,127
6 The U.S. Census Bureau states, “A household includes the related family members and all unrelated
people, if any, such as lodgers, foster children, wards, or employees who share the housing unit. A
person living alone in a housing unit, or a group of unrelated people sharing a housing unit such as
partners or roomers, is also counted as a household.”
Kansas Legislative Research Department 5 Federal Poverty Threshold and What It Means
for Kansas – May 19, 2021When comparing the median household incomes to the 2021 FPG, which are used
largely for assistance program eligibility, no four-member household groups, in their entirety, fall
below the poverty threshold. However, a breakdown of households by income ranges reveals:
● 5.1 percent, or 58,055, of Kansas households make less than $10,000 per year
and would qualify as living in poverty under the 2021 FPG, regardless of family
size;
● 4.3 percent, or 48,948, of Kansas households make between $10,000 and
$14,999 per year, the threshold for poverty for households of two or more
individuals under the 2021 FPG; and
● 8.3 percent, or 94,481, of Kansas households make between $15,000 and
$24,999 per year. Of these, households of four or more would qualify under the
2021 FPG. Households of three would qualify if they make less than or equal to
$21,960 per year.
Expenses
In 2019, the U.S. Department of Commerce’s Bureau of Economic Analysis (BEA)
estimated Kansans spent $38,898 per capita on consumer goods, rents, and services each
year. This is $5,378, or 12.1 percent, less than the national per capita annual expenditures for
consumer goods, rents, and services ($44,276). When broken down by household for 2019,
Kansas households, on average, spent approximately $96,729 each year on consumer goods,
rents, and services. This is $18,041, or 16.0 percent, less than the national household average
of $114,770.
Utilizing the BEA’s regional price parities, Kansans pay 10.8 percent less overall for
goods and services than the national average. Compared to national averages, the price of
goods in Kansas are 4.9 percent less, rents are 27.3 percent less, and other services are 6.9
percent less.
Appendix 4 shows the breakdown of 2019 personal and consumer expenditures per
capita.
Poverty Level
The 2019 ACS estimates 323,189 Kansans, or 11.5 percent, live in families with an
income that has fallen below the FPT within the past 12 months.7 This is 1.0 percent higher than
the national level of 10.5 percent of Americans who live below the poverty level according to the
FPT.
Appendix 5 shows the estimated total of the state’s population based upon various
characteristics, including the share below the poverty line.
7 Appendices 1 and 2 provide the 2019 FPT and 2020 FPG thresholds based upon family size and
composition.
Kansas Legislative Research Department 6 Federal Poverty Threshold and What It Means
for Kansas – May 19, 2021Federal and State Programs Involving the FPT or FPG
A variety of federal and state programs utilize either the FPT or FPG when determining
eligibility or levels of service. The following list provides some of these programs, organized by
the state agency that administers the program. Each program is denoted as either being a
federal or state program.
State Board of Indigents’ Defense Services
Provides criminal defense services to individuals whose household income does not
exceed the FPG.
Kansas Department for Children and Families
Child Care Assistance (Federal)
Provides cash assistance for child care services to families whose household income
does not exceed 185.0 percent of the FPG. A co-payment is required for all recipients whose
income exceeds 70.0 percent of the FPG.
Child Support Services (State)
Helps children receive the financial support necessary for growth and development.
Assists by establishing parentage and orders for child and medical support payments, locating
noncustodial parents, enforcing child and medical support orders, and modifying support orders.
All families receiving Temporary Assistance for Needy Families, food assistance, medical
assistance, foster care, or child care assistance are automatically qualified.
Commodity Supplemental Food Program (Federal)
Provides food packages to individuals 60 years of age or older whose income is 130.0
percent or less of the FPG.
Early Head Start Program (State)
A comprehensive program designed to meet the individual needs of children and families
by providing services such as early education, parent education, health and medical services,
nutritional education, family support, and child care for households whose income does not
exceed 100.0 percent of the FPG.
Food Assistance (Federal)
Provides cash assistance for food to individuals and families whose household gross
income does not exceed 130.0 percent of FPT or whose net income does not exceed 100.0
percent of the FPG.
Kansas Legislative Research Department 7 Federal Poverty Threshold and What It Means
for Kansas – May 19, 2021Low Income Energy Assistance Program (Federal)
Helps eligible households pay a portion of their home energy costs by providing a one-
time per year benefit. One of the program’s eligibility requirements is that the household does
not exceed 150.0 percent of the FPG.
Temporary Assistance for Needy Families (Federal)
Provides cash assistance for a lifetime maximum of 24 months to individuals and
families whose household income does not exceed 22.0 percent of the FPG.
Kansas Department of Health and Environment
Children’s Health Insurance Program (Federal and State)
Provides low-cost health coverage for children under the age of 19 whose household
income exceeds Medicaid requirements but does not exceed 230.0 percent of the FPG.
Medicaid/KanCare (Federal and State)
KanCare provides medical coverage for the following populations based on income
eligibility:
● Pregnant women and children under the age of one if their household income
does not exceed 171.0 percent of the FPG;
● Children between the ages of 1 and 5 whose household income does not exceed
149.0 percent of the FPG and children between the ages of 6 and 18 whose
household income does not exceed 113.0 percent of the FPG; and
● Parents or caregivers of children whose household income does not exceed 38.0
percent of the FPG.
Special Health Care Needs (State)
Provides specialized medical services to infants, children, and youth up to age 21 with
eligible medical conditions whose household income does not exceed 185.0 percent of the
FPG.
[Note: If the infant, child, or youth’s condition is genetic, then 50.0 percent coverage is
provided for household incomes not exceeding 285.0 percent of the FPG and 25.0 percent
coverage if income does not exceed 385.0 percent of the FPG.]
Kansas Legislative Research Department 8 Federal Poverty Threshold and What It Means
for Kansas – May 19, 2021Women, Infants, and Children Program (Federal)
Provides nutrition education, health education, healthy foods, and other services to
families whose household income does not exceed 185.0 percent of the FPG.
Kansas State Board of Education
At-risk Funding (State)
Part of the school funding formula involves a weighted measure for “at-risk” students.
These students are defined as qualifying for the federal Free or Reduced Lunch Program, which
utilizes the FPG to determine eligibility.
Free and Reduced Lunch Program (Federal)
Provides school meals for free or at a reduced price based upon the student’s household
income. For the 2020-2021 school year, any student at or below 130.0 percent of the FPG
would qualify for free lunch and any student at or below 185.0 but above 130.0 percent of FPG
would qualify for reduced lunch.
High Density At-risk Funding (State)
Part of the school funding formula that provides additional money to school districts with
high concentrations of “at-risk” students. As with the at-risk funding, this category measures
student populations receiving federal free or reduced lunches and utilizes the FPG for
determining income eligibility.
Low Income Tax Credit Scholarship Program (State)
Provides scholarships to public school students in grades K-8 who qualify for the Free
and Reduced Lunch Program so they may attend private schools.
Kansas Legislative Research Department 9 Federal Poverty Threshold and What It Means
for Kansas – May 19, 2021Appendix 1: 2019 Federal Poverty Thresholds
Related Children Under 18 Years
Weighted
Size of Family Unit Average Eight or
None One Two Three Four Five Six Seven
Thresholds8 More
One Person (Unrelated $13,011
Individual)
Under Age 65 $13,300 $13,300
Age 65 and Older $12,261 $12,261
Two Persons: $16,521
Householder Under Age 65 $17,196 $17,120 $17,622
Householder Age 65 and Older $15,468 $15,453 $17,555
Three Persons $20,335 $19,998 $20,578 $20,598
Four Persons $26,172 $26,370 $26,801 $25,926 $26,017
Five Persons $31,021 $31,800 $32,263 $31,275 $30,510 $30,044
Six Persons $35,129 $26,576 $26,721 $35,965 $35,239 $34,161 $33,522
Seven Persons $40,016 $42,085 $42,348 $41,442 $40,811 $39,635 $38,262 $36,757
Eight Persons $44,461 $47,069 $47,485 $46,630 $45,881 $44,818 $43,470 $42,066 $41,709
Nine Persons or More $52,875 $56,621 $56,895 $56,139 $55,503 $54,460 $53,025 $51,727 $51,406 $49,426
8 The “Weighted Average Threshold” is based on the relative number of unrelated individuals and primary families of each size and composition within the 48
different poverty thresholds.
Kansas Legislative Research Department 10 Federal Poverty Threshold and What It Means for Kansas – May 13, 2021Appendix 2: 2020 and 2021 Federal Poverty Guidelines for the 48 Contiguous States and the
District of Columbia
Persons in Family/Household 2020 Poverty Guidelines 2021 Poverty Guidelines
1 $12,760 $12,880
2 $17,240 $17,420
3 $21,720 $21,960
4 $26,200 $26,500
5 $30,680 $31,040
6 $35,160 $35,580
7 $39,640 $40,120
8 $44,120 $44,660
* For families/households with more than eight persons, add $4,480 in 2020 and $4,540 in 2021 for each
additional person.
Kansas Legislative Research Department 11 Federal Poverty Threshold and What It Means
for Kansas – May 19, 2021Appendix 4: 2019 Per Capita Personal Consumption Expenditures
Kansas as Percent
Description United States Kansas
of United States
Per Capita Personal Consumption
$44,276 $38,898 87.9%
Expenditures
GOODS $13,712 $12,733 92.9%
Durable Goods $4,674 $4,194 90.0%
Motor Vehicles and Parts $1,590 $1,609 101.2%
Furnishings and Durable Household
$1,089 $1,052 96.6%
Equipment
Recreational Goods and Vehicles $1,320 $969 73.4%
Other Durable Goods $675 $564 83.6%
Nondurable Goods $9,038 $8,539 94.5%
Food and Beverages Purchased for
$3,125 $3,148 100.7%
Off-premises Consumption
Clothing and Footwear $1,229 $952 77.5%
Gasoline and Other Energy Goods $1,022 $1,024 100.2%
Other Nondurable Goods $3,662 $3,415 93.3%
SERVICES $30,564 $26,165 85.6%
Household Consumption
$29,226 $25,062 85.8%
Expenditures (for services)
Housing and Utilities $8,168 $6,831 83.6%
Health Care $7,467 $7,042 94.3%
Transportation Services $1,473 $1,010 68.6%
Recreation Services $1,768 $1,329 75.2%
Food Services and Accommodations $3,045 $2,351 77.2%
Financial Services and Insurance $3,583 $3,523 98.3%
Other Services $3,722 $2,976 80.0%
Final Consumption Expenditures
of Nonprofit Institutions Serving $1,338 $1,103 82.4%
Households (NPISHs)
Kansas Legislative Research Department 12 Federal Poverty Threshold and What It Means
for Kansas – May 19, 2021Appendix 5: Kansas Poverty Status in the Past 12 Months9
Total Below Poverty Level Percent Below Poverty Level
Label Estimate Margin of Estimate Margin of Estimate Margin of
Error Error Error
Population 2,826,818 ±2,181 323,189 ±13,737 11.4% ±0.5
Under 5 Years 179,144 ±2,342 30,648 ±3,086 17.1% ±1.7
5 to 17 Years 507,366 ±3,220 70,446 ±5,093 13.9% ±1.0
18 to 34 Years 630,657 ±3,988 98,877 ±5,620 15.7% ±0.9
35 to 64 Years 1,049,627 ±4,217 89,868 ±5,018 8.6% ±0.5
65 Years and Over 460,024 ±2,472 33,350 ±2,522 7.2% ±0.6
Sex
Male 1,394,677 ±4,024 139,151 ±8,367 10.0% ±0.6
Female 1,432,141 ±4,190 184,038 ±8,015 12.9% ±0.6
Race
White 2,370,315 ±8,806 231,344 ±12,118 9.8% ±0.5
Black or African 156,226 ±4,827 36,815 ±5,479 23.6% ±3.4
American
American Indian and 22,096 ±3,103 4,781 ±1,800 21.6% ±7.2
Alaska Native
Asian 85,355 ±2,584 9,903 ±2,997 11.6% ±3.5
Some Other Race 85,744 ±7,128 20,618 ±4,328 24.0% ±4.7
Two or More Races 104,727 ±6,252 19,653 ±2,849 18.8% ±2.5
Hispanic or Latino 345,152 ±1,618 67,959 ±6,703 19.7% ±1.9
Educational
Attainment*
Less than High 150,306 ±6,775 31,222 ±3,108 20.8% ±1.9
School Graduate
High School 485,937 ±12,151 57,225 ±4,152 11.8% ±0.8
Graduate**
Some College, 595,682 ±10,295 51,770 ±3,756 8.7% ±0.6
Associate’s Degree
Bachelor’s Degree or 647,761 ±9,984 20,460 ±2,278 3.2% ±0.3
Higher
*Excludes all population under 25 years of age.
** Includes high school graduate equivalency.
9 Table can be found at the U.S. Census Bureau website under “Poverty Status in the Past 12 Months”
in the 2019: ACS 1-Year Estimates Subject Tables.
Kansas Legislative Research Department 13 Federal Poverty Threshold and What It Means
for Kansas – May 19, 2021You can also read