SUGAR AND SWEETENERS OUTLOOK - MICHAEL MCCONNELL, COORDINATOR DAVID OLSON, CONTRIBUTOR - USDA ECONOMICS, STATISTICS AND ...
←
→
Page content transcription
If your browser does not render page correctly, please read the page content below
Economic Research Service | Situation and Outlook Report

                          SSS-M-359 | July 18, 2018                          Next release is August 16, 2018

Sugar and Sweeteners Outlook
Michael McConnell, coordinator
David Olson, contributor

Slow Pace Reported, Lower Deliveries Forecast in
2017/18 and 2018/19
The sluggish pace of domestic deliveries for food and beverages through May results in a reduction in
estimated deliveries for 2017/18 and projected deliveries in 2018/19—reduced 65,000 short tons, raw
value (STRV) and 100,000 STRV, respectively. Production estimates for 2017/18 were revised up
55,000 STRV due to more beet sugar production. Projections for 2018/19 production are lowered
185,000 STRV due to less cane sugar production, based on the National Agricultural Statistics
Service’s Acreage report, released on June 29, 2018. Projected imports for 2018/19 are updated to
reflect the July 2, 2018, announcement from the Secretary regarding the size of the 2018/19 fiscal year
tariff-rate quotas for the raw, refined, and specialty sugar. Ending stocks for 2017/18 are raised
135,000 STRV, with an estimated stocks-to-use ratio of 16.0 percent. The stocks-to-use ratio in
2018/19 is projected to be 13.5 percent.

Mexico’s 2017/18 sugarcane harvest season was completed in early July with 6.009 million metric tons,
actual value (MT), of sugar production—a 39,000 MT increase from the previous estimate. The
additional supplies will result in increased exports on the world sugar market and slightly more ending
stocks, with the stocks-to-consumption ratio increasing slightly to 28.7 percent. Ending stocks for
2018/19 are projected to result in a relatively tighter 22.0-percent stocks-to-consumption ratio.
Projected exports in 2018/19 are raised 9,000-MT based on increased shipments to the United States.

 Approved by USDA’s World Agricultural Outlook Board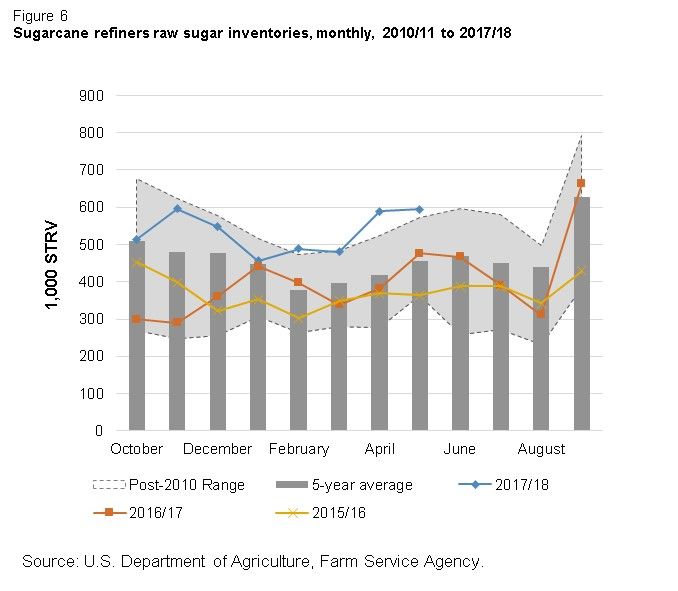
U.S. Domestic Outlook
U.S. Domestic Sugar Production Raised for 2017/18, but
Lowered for 2018/19
U.S. sugar production estimates for 2017/18 are raised to 9.293 million short tons, raw value
(STRV), in USDA’s July World Agricultural Supply and Demand Estimates (WASDE), up 55,000
STRV from the previous month’s estimate. Along with changes to estimated imports, total sugar
supplies are raised 70,000 STRV to 14.571 million STRV. Total supplies for 2018/19 are
projected to be 14.347 million STRV, 144,000 STRV higher than the June projection, all due to
raised imports as domestic production projections are reduced.

Table 1: U.S. sugar: supply and use, by fiscal year (Oct./Sept.), July 2018
Items                                                                      2017/18          2018/19                         2017/18          2018/19
                                                            2016/17       (estimate)       (forecast)       2016/17        (estimate)       (forecast)

                                                                  1,000 Short tons, raw value                 1,000 Metric tons, raw value

Beginning stocks                                                  2,054         1,876            2,011          1,863            1,702          1,824

Total production                                                  8,969         9,293            8,776          8,137            8,430          7,961
 Beet sugar                                                       5,103         5,276            5,036          4,629            4,786          4,569
 Cane sugar                                                       3,866         4,017            3,740          3,507            3,644          3,393
   Florida                                                        2,055         1,983            2,000          1,864            1,799          1,814
   Louisiana                                                      1,628         1,859            1,590          1,477            1,686          1,442
   Texas                                                            140           175              150            127              159            136
   Hawaii                                                            43             0                0             39                0              0

Total imports                                                     3,244         3,402            3,560          2,943            3,087          3,230
 Tariff-rate quota imports                                        1,611         1,788            1,540          1,462            1,622          1,397
 Other program imports                                              419           300              350            380              272            318
 Non-program imports                                              1,213         1,314            1,670          1,101            1,192          1,515
   Mexico                                                         1,201         1,269            1,655          1,090            1,152          1,502

Total supply                                                     14,267        14,571           14,347         12,943           13,219         13,015

Total exports                                                        95           170               85                86           154             77

Miscellaneous                                                        38                0                0             35                0            0

Deliveries for domestic use                                      12,258        12,390           12,555         11,121           11,240         11,390
 Transfer to sugar-containing products
  for exports under re-export program                               127           120              120            115              109            109
 Transfer to polyhydric alcohol, feed, other alcohol                 29            35               35             27               32             32
 Commodity Credit Corporation (CCC) sale for ethanol, other           0             0                0              0                0              0
 Deliveries for domestic food and beverage use                   12,102        12,235           12,400         10,979           11,099         11,249

Total use                                                        12,391        12,560           12,640         11,241           11,394         11,467

Ending stocks                                                     1,876         2,011            1,707          1,702            1,824          1,549
Private                                                           1,876         2,011            1,707          1,702            1,824          1,549
Commodity Credit Corporation (CCC)                                    0             0                0              0                0              0

Stocks-to-use ratio                                                15.14       16.01             13.50          15.14            16.01          13.50
Source: U.S. Dept. of Agriculture, Economic Research Service, Sugar and Sweetener Outlook.

Beet sugar production in 2017/18 is estimated to reach 5.276 million STRV—a 55,000-STRV
increase from the June estimate. Late-season slicing campaign reports from sugarbeet

                                                           2
                                 Sugar and Sweeteners Outlook, SSS-M-359, July 18, 2018
                                           USDA, Economic Research Service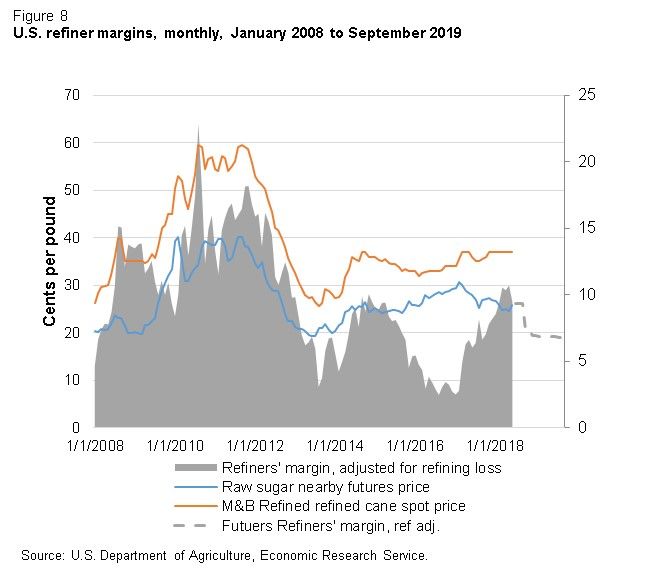
processors show strong sucrose extraction from sliced sugarbeets, raising the cumulative
extraction rate to well-above the historical 10-year average. The national slicing campaign
extended well into the spring and even into June in some regions, in large part due to the large
sugarbeet crop harvested, along with favorable weather and storage conditions that maintained
the quality of the sugarbeets. These factors increase the expected sugar produced from the
2017/18 sugarbeet crop. Expected early-season sugar production from the 2018/19 crop that is
currently developing remains unchanged from the June estimate at 598,000 STRV. This
estimate is based on the planting progress results from the spring after a slow start due to cold
weather conditions in April, but with most of the crop planted by mid-May to allow for adequate
crop development for an early harvest—particularly in the Eastern growing regions that rely on
early-season harvest and production to manage processor through-put.

On June 29, 2018, the USDA’s National Agricultural Statistics Service (NASS) released its June
Acreage report that included the first estimates for sugarbeet harvested area and updated
estimates for planted area. Sugarbeet growers are forecast to harvest 1.094 million acres for
the 2018/19 crop, which would be a 1.9-percent decrease from the previous year and the
seventh-consecutive year of small annual declines. The report slightly increased the estimate of
planted area compared with the March Prospective Plantings report on which previous forecasts
were predicated, however. The report estimates planted area at 1.116 million acres compared

                                               3
                     Sugar and Sweeteners Outlook, SSS-M-359, July 18, 2018
                               USDA, Economic Research Service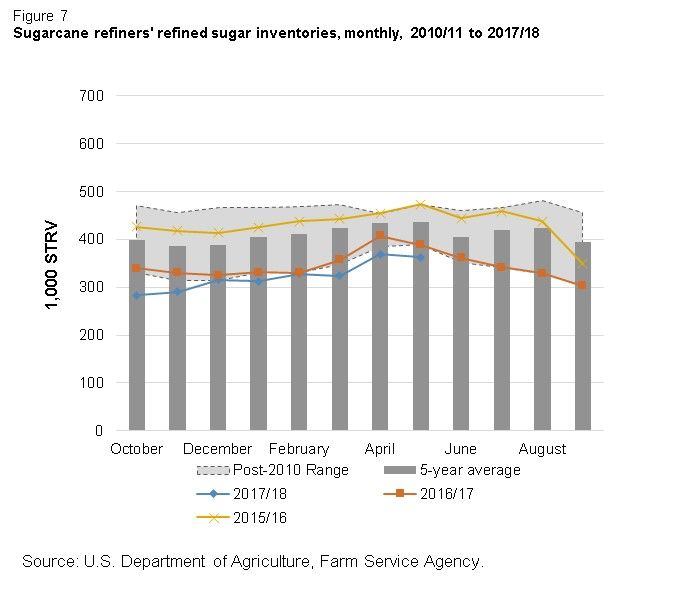
with 1.113 million acres initially forecast in March—but this still represents a 1.4-percent decline
from 2017.

     Table 2: Sugarbeet harvested area, 2015/16 to 2017/18, July 2018
                                                                      2018/19
     State           2015/16         2016/17          2017/18        (forecast)                                                    Annual Change
                                           1,000 acres                                                                                percent
     Minnesota       435.0           417.0            409.0            395.0                                                            -3.4
     North Dakota    206.0           203.0            212.0            208.0                                                            -1.9
     Idaho           172.0           170.0            166.0            162.0                                                            -2.4
     Michigan        151.0           149.0            143.0            148.0                                                             3.5
     Nebraska         46.8            47.2             45.2             44.5                                                            -1.5
     Montana          43.7            45.3             42.7             42.9                                                             0.5
     Wyoming          31.2            30.0             31.6             31.0                                                            -1.9
     Colorado         27.3            27.6             29.0             26.3                                                            -9.3
     California       24.7            25.0             24.7             24.1                                                            -2.4
     Oregon           7.7             10.2             9.1              9.7                                                              6.6
     Washington        N/A            1.9              1.8              1.9                                                              5.6
     U.S. Total     1,145.4         1,126.2          1,114.1         1,093.4                                                            -1.9
     Source: U.S. Dept. of Agriculture, National Agricultural Statistics Service.

Projected sugar production from the 2018/19 crop year is unchanged at 5.036 million STRV,
given the relatively minor change to acreage expectations from the previous month and
assuming that no substantial weather conditions will impact yield beyond normal planting
progress trends and that sucrose extraction, shrink rates, and early-season production for
2019/20 will remain in line with historical averages. On a fiscal year basis, this would represent
a 4.8-percent decline from the previous year, currently forecast to be a record.

Table 3: Beet sugar production projection calculation, 2017/18 and 2018/19
                                                             2012/13 2013/14                  2014/15     2015/16     2016/17     2017/18 2017/18 2018/19
                                                                                                                                   June     July    July
Sugarbeet production (1,000 short tons) 1/                              35,224      32,789      31,285      35,371      36,881      35,325   35,325  34,561
Sugarbeet shrink 2/                                                      4.8%        6.8%        5.4%        6.5%        8.3%        6.7%     6.7%    6.7%
Sugarbeet sliced (1,000 short tons)                                     33,532      30,545      29,595      33,066      33,834      32,958   32,958  32,245
Sugar extraction rate from slice                                        15.3%       14.3%       14.6%       14.6%       13.7%       15.0%    15.2%   14.5%
Sugar from beets slice (1,000 STRV)                                      5,142       4,325       4,325       4,820       4,643       4,955    5,010   4,668
Sugar from molasses (1,000 STRV) 2/                                        327         324         341         380         352         345      345     345
Crop-year sugar production (1,000 STRV) 3/                               5,469       4,648       4,667       5,201       4,995       5,300    5,354   5,012
August-September sugar production (1,000 STRV)                             708         315         461         688         606         715      715     598
August-September sugar production forecast (1,000 STRV)                    315         461         688         606         715         598      598     582
Sugar from imported beets (1,000 STRV) 4/                                    --          --          --          --          --         38       38      40
Fiscal year sugar production (1,000 STRV)                                5,076       4,794       4,893       5,119       5,103       5,221    5,276   5,036
Notes: 1/ National Agricultural Statistics Service, U.S. Dept. of Agriculture. 2/Projections based on processor forecasts published by U.S. Dept. of
Agriculture, Farm Service Agency. 3/ August-July basis. 4/ Sugar from imported beets split out for projections only, included in total once full crop-year slice
is recorded. They are incorporated into total production in historical data.
Source: U.S. Dept. of Agriculture, Economic Research Service and World Agricultural Outlook Board.

The NASS Acreage report included the first estimates for sugarcane harvested area, providing
the survey-based market information for the 2018/19 sugarcane market. The forecast for the
2018/19 sugarcane crop showed a 2.1-percent drop in U.S. sugarcane area compared with the

                                                             4
                                   Sugar and Sweeteners Outlook, SSS-M-359, July 18, 2018
                                             USDA, Economic Research Service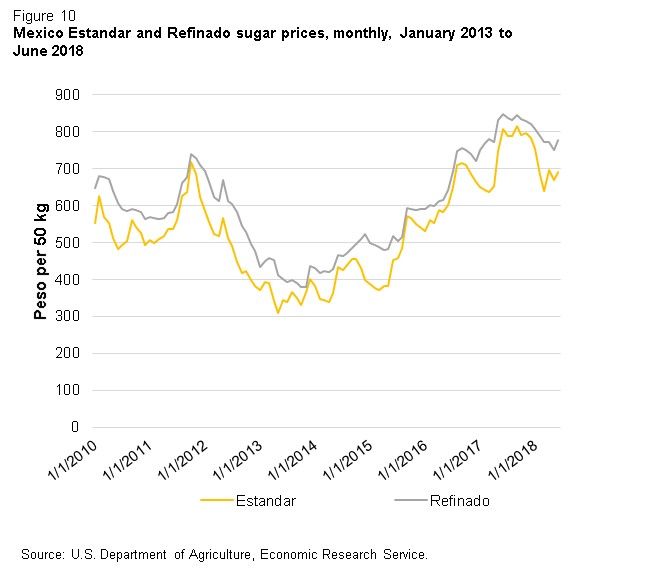
previous year. The national decline is due to a 4.4-percent decline in Louisiana and a 4.1-
percent decline in Texas, outweighing the 0.6-percent increase in Florida. With sugarcane
yields and recovery rates expected to be in line with recent average levels, total cane sugar
production in 2018/19 is projected to be 3.740 million STRV, which would be a 7.4-percent
decline from the previous year. While still early in the crop development period, sugarcane
growing conditions have been generally favorable. The production projections for each State
assume normal weather conditions for the remainder of the growing season, as well as during
the harvest season that begins in the fall and continues through spring in Florida and Texas.
Based on the reported acreage forecasts, cane sugar production in Louisiana is projected to be
1.590 million STRV, a 90,000-STRV reduction from the June report. Florida production is
projected to be 2.000 million STRV, an 85,000-STRV reduction. Texas production is projected
to be 150,000 STRV, 10,000 STRV less than the previous month.

               Table 4: Sugarcane harvested area, 2015/16 to 2018/19
                                                                                               Annual
               State                      2015/16       2016/17       2017/18        2018/19 Change
                                                                                    (forecast)
                                                            1,000 acres                        percent
               Florida                    413.0          417.0      412.7             415.2      0.6
               Louisiana                  410.0          431.0      449.6             430.0      -4.4
               Texas                      36.6           39.6       41.8              40.1       -4.1
               Hawaii                     15.1           15.5        0.0               0.0        --
               U.S. Total                 874.7          903.1      904.1             885.3      -2.1
               Source: U.S. Dept. of Agriculture, National Agricultural Statistics Service.

Imports in 2017/18 from TRQs and Mexico Remain on Pace
The outlook for sugar imports in 2017/18 is changed, but only by a relatively minor amount.
Estimated U.S. imports for 2017/18 are 3.402 million STRV, up 15,000 STRV from the June
estimate. The increase is due entirely to a 15,000-STRV increase in estimated high-tier tariff
imports based on preliminary reporting from U.S. Customs. The increase appears to be from
isolated transactions, and, thus far, does not appear to be part of a larger trend of sugar
imported at the full duty rates.

Imports under quota programs in 2017/18 are unchanged from the previous month at 1.788
million STRV. This total includes sugar imported under the 2016/17 raw sugar TRQ—totaling
236,000 STRV- which had its entry deadline extended as part of a series of policy
announcements by the Secretary in July 2017. It also includes an expected shortfall of 99,000

                                                  5
                        Sugar and Sweeteners Outlook, SSS-M-359, July 18, 2018
                                  USDA, Economic Research Service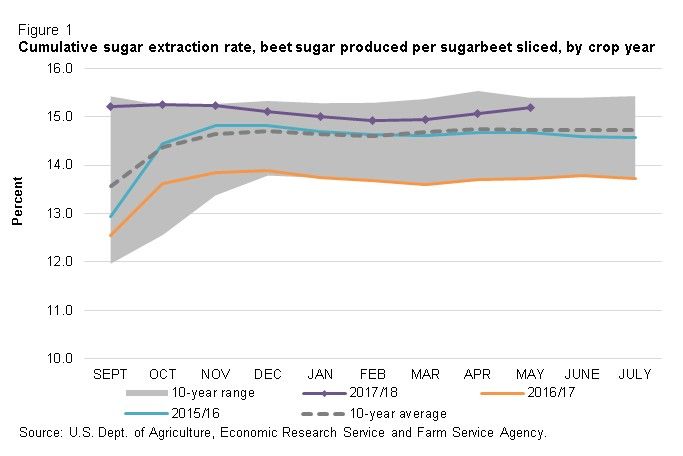
STRV in the raw sugar 2017/18 TRQ. Entries under refined and specialty TRQs and free-trade
agreements (FTA) are also unchanged in the July WASDE.

Imports from Mexico in 2017/18 are estimated to be 1.269 million STRV, unchanged from the
previous month. The estimate reflects the market access provided to Mexico through the
2017/18 Export Limit, announced by the U.S. Department of Commerce (USDOC) in March
2018, as specified in the agreements to suspend the anti-dumping and countervailing duty
(AD/CVD) investigations signed by the USDOC and the Government of Mexico. Mexico has
completed its harvest campaign for 2017/18, and the estimate assumes that Mexico fills the
entirety of the allotted Export Limit, including the specific allocations for refined and other sugar,
as defined in the agreement. Additional analysis of the Mexico sugar market is provided later in
this report. Through June, entries of sugar from Mexico are estimated at 909,000 STRV, or 72
percent of the current estimate.

Tariff-Rate Quota Amounts for 2018/19 Set by Secretary
On July 2, 2018, the Secretary announced the import quota amounts for the 2018/19 fiscal year,
including the TRQs for raw, refined, and specialty sugar. The TRQ for raw sugar (1.231 million
STRV) and refined sugar (22,000 STRV) represent the minimum required WTO commitments.
The TRQ for specialty sugars (189,000 STRV) includes the WTO minimum commitment, as well
as an additional quantity of 187,000 STRV.

U.S. sugar imports under quota programs for 2018/19 are projected to be 1.543 million STRV,
which incorporates the recent TRQ announcements. The total includes a 99,000-STRV
projected shortfall in the raw sugar TRQ—in line with shortfall estimates for the previous year.

Imports from Mexico are projected to total 1.655 million STRV, a 10,000-STRV increase from
the June projection based on changes to the anticipated U.S. Needs to be published by the
USDOC in accordance to the terms of the suspension agreements. If fully realized, this would
be a 30.4-percent increase in imports from the current 2017/18 estimate. Further, based on the
terms of the suspension agreements, an initial Export Limit would be set by the USDOC of 50
percent of the calculated U.S. Needs from July, or 828,000 STRV. Additional calculations and
Export Limit publications will be made by USDOC subsequent to the September 2018,
December 2018, and March 2019 WASDE reports. Subsequent Export Limit calculations will be
based on escalating proportions of U.S. Needs, but the Export Limit cannot be reduced from a
previously published amount.

                                                6
                      Sugar and Sweeteners Outlook, SSS-M-359, July 18, 2018
                                USDA, Economic Research Service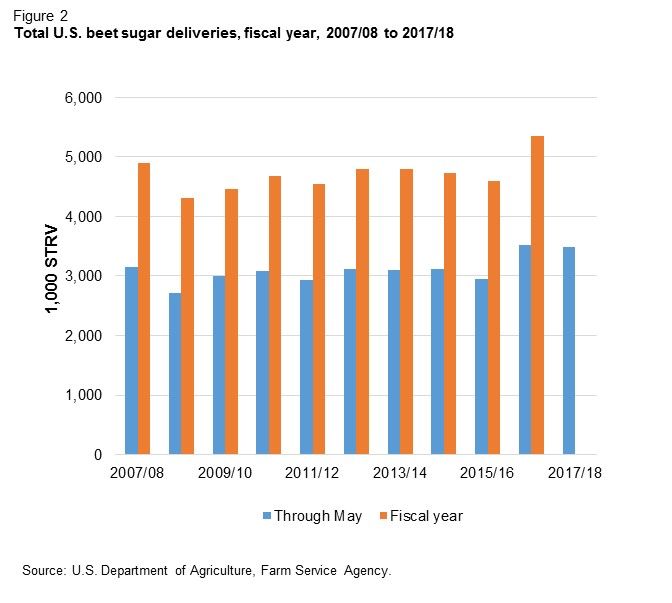
Pace of Domestic Deliveries Through May 2018 Lead to
Reduction in Forecasts for 2017/18 and 2018/19
A sluggish pace in 2017/18 sugar deliveries for food and beverages has continued through data
reported in May. Total deliveries for food and beverage use in 2017/18 were 1.3-percent lower
through May than they were the previous year. Food and beverage deliveries are projected to
be 12.400 million STRV in 2018/19, a 100,000-STRV reduction from the previous month’s
figure. The reduction for 2018/19 puts the projection more in line with the updated estimate for
the current year, forecasting a 1.3-percent annual increase. If realized, the current estimate for
2017/18 would be a 1.1-percent increase from 2016/17 deliveries.
The U.S. sugarbeet processing and cane sugar refining sectors have demonstrated distinct
trends toward the current pace. Food and beverage deliveries from the beet processing sector
are 0.9-percent lower through May than the same period last year. The decline is coming after
a record-breaking year for beet sugar deliveries in 2016/17—which had a 12.8-percent increase
from the previous year and were 11.3 percent higher than the previous record in 2013/14.
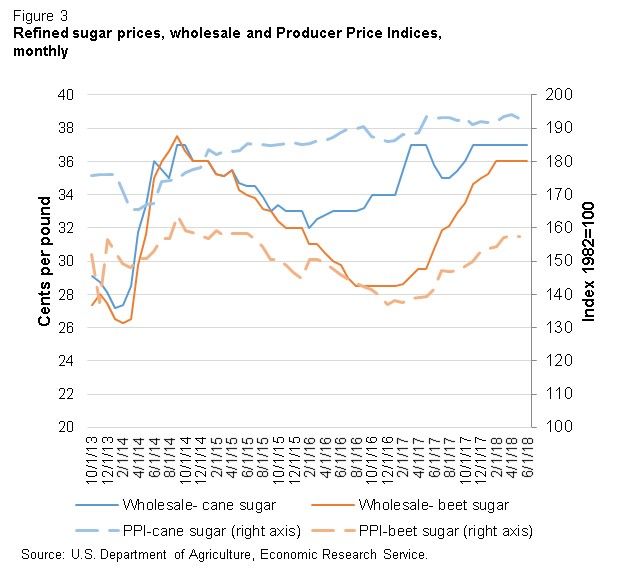
Contributing to the substantial increase in pace during 2016/17 were large supplies—due to
high inventories beginning the year and large production during the year—and a discount in the
wholesale refined beet sugar price compared with refined cane sugar, as indicated by Milling
and Baking News and the Bureau of Labor Statistics (BLS) Producer Price Index (PPI). The
pace of 2016/17 deliveries and market developments has alleviated both the high inventories
and price differential between refined cane and beet sugar. As a result, the pace of beet sugar
deliveries has begun to moderate compared with the previous year, but should still remain
strong by historical standards.
7
Sugar and Sweeteners Outlook, SSS-M-359, July 18, 2018
USDA, Economic Research Service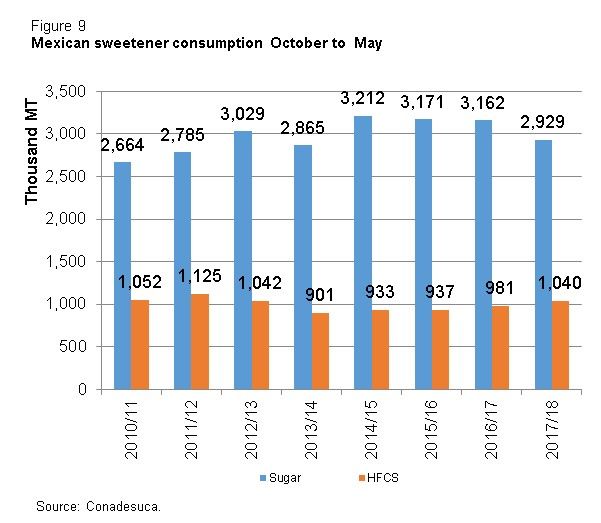
8
Sugar and Sweeteners Outlook, SSS-M-359, July 18, 2018
          USDA, Economic Research Service
9
Sugar and Sweeteners Outlook, SSS-M-359, July 18, 2018
USDA, Economic Research ServiceThe U.S. cane sugar refining sector’s food and beverage deliveries through May were 0.6-
percent lower than the previous year. The relatively sluggish pace of monthly deliveries began
in late 2016/17 when raw sugar supplies in the sector were tight. Policy actions by the USDA in
July 2017 increased the raw sugar TRQ and extended the entry period, which led to higher raw
sugar inventories carried by cane refiners in September 2017. Raw sugar inventories have
remained high through the latest reporting in May. Refiners’ melt rates have remained relatively
flat, leading to sluggish deliveries, with refined sugar inventories in the sector remaining low
while raw sugar inventories remain high. Nearby futures prices for raw sugar and spot prices for
refined cane sugar suggest greater margins for the remainder of 2017/18, compared with levels
over the last 5 years. Price levels in 2018/19 based on futures contracts and reported refined
sugar offers indicate that margins will be tighter in the upcoming year, but still at a level
comparable to recent years. Whether the cane refining sector will increase its melt rate and
deliveries at current price and margin levels or maintain high raw sugar inventories will be an
important determinant of the outlook for domestic deliveries for 2017/18 and 2018/19.
10
Sugar and Sweeteners Outlook, SSS-M-359, July 18, 2018
USDA, Economic Research Service11
Sugar and Sweeteners Outlook, SSS-M-359, July 18, 2018
USDA, Economic Research Service12
Sugar and Sweeteners Outlook, SSS-M-359, July 18, 2018
USDA, Economic Research ServiceEnding Stocks for 2017/18 Raised
Raised supply estimates and lowered use estimates result in ending stock estimates for
2017/18 being raised 135,000 STRV to 2.011 million STRV. This would result in a 16.0-percent
stocks-to-use ratio, which would be the highest since 2015/16. Projected ending stocks for
2018/19 are 1.707 million STRV, with a projected stocks-to-use ratio of 13.5 percent.
13
Sugar and Sweeteners Outlook, SSS-M-359, July 18, 2018
USDA, Economic Research ServiceMexico Outlook
Mexico Harvest Concludes, Increases from 2016/17
The Mexico sugarcane harvest has concluded by early July according to reporting by the
Comité Nacional para el Desarrollo Sustentable de la Cano de Azúcar (Conadesuca). Initial
totals for the full harvest show that Mexico sugarcane processors produced 6.009 million metric
tons, actual value (MT), in 2017/18. Harvested sugarcane area in 2018/19 was 0.8 percent
higher than the previous year, with lower sugarcane yields but higher recovery rates. This
year’s sugar production figure would represent a 0.9 percent increase from 2016/17 production
and a 39,000-MT increase from the June estimate. The increased production is forecast to
contribute to larger exports and slightly higher ending stocks.
Projected production for 2018/19 remains unchanged from the previous month, totaling 6.025
million MT—which would be a 0.3 percent increase from the 2017/18 total. Conadesuca has
not released any official estimates for the 2018/19 sugarcane crop and likely will not until the
fall, if they are consistent with past years. The projection is based on harvested area
comparable to 2017/18 and sugarcane yields and recovery rates in line with historical averages.
Domestic deliveries of sugar in Mexico continue to lag compared with the previous year.
Through May, sugar deliveries are 7.4 percent behind the previous year. This is partially offset
by a 6.1-percent increase in high-fructose corn syrup (HFCS) deliveries, but overall sweetener
deliveries remain 4.2 percent lower than 2016/17. Relatively high sugar prices are likely one of
the main reasons for this, as domestic prices experienced a sharp increase in May 2017. Prices
have moderated a bit in peso terms—particularly the estandar price—but still remain high by
historical standards.
14
Sugar and Sweeteners Outlook, SSS-M-359, July 18, 2018
USDA, Economic Research Service15
Sugar and Sweeteners Outlook, SSS-M-359, July 18, 2018
USDA, Economic Research Service16
Sugar and Sweeteners Outlook, SSS-M-359, July 18, 2018
USDA, Economic Research ServiceSugar deliveries for 2018/19 are projected to be 4.562 million MT, which would be 5.2 percent
higher than from the current 2017/18 estimate. The projection assumes that deliveries fall back
in line with longer-term trends, with per capita sweetener consumption in line with recent
historical levels.
Mexico exports in 2017/18 are estimated to be 1.228 million MT, a 36,000-MT increase from the
previous month. The increase is due to raised exports to non-U.S. destinations, primarily due to
the higher production estimate in the July WASDE. The WASDE estimates Mexico ending
stocks as being a function of expected domestic deliveries and shipments to the United States
in 2018/19. Supplies exceeding 18 percent of 2018/19 deliveries, to satisfy domestic demand
prior to the beginning of the 2018/19 sugarcane harvest, and 30 percent of the 2018/19
shipments to the United States, in line with the terms of the suspension agreement—are
assumed to be exported on the world market.
Exports to the United States are estimated to be 1.086 million MT, unchanged from the previous
month and in line with the published Export Limit by USDOC subsequent to the March WASDE.
According to Conadesuca’s latest weekly report, Mexico’s processors have produced 813,000
MT of sugar with a polarity lower than 99.2, which would qualify it for the “Other Sugar” portion
of the Export Limit that totals 760,000 MT. This would suggest that there are sufficient supplies
to fulfill this year’s Export Limit and additional supplies that can be stored for the 2018/19 Export
Limit or exported into the world market.
Exports for 2018/19 are projected to total 1.427 million MT. Shipments to the United States are
projected to account for 1.417 million MT, based on the forecast of U.S. Needs from the July
WASDE’s U.S. sugar supply and use projections. If realized, this would mean that the “Other
Sugar” portion would total 992,000 MT, or 22.0 percent more than the current production figure
for 2017/18. Exports to non-U.S. destinations are projected to be just 10,000 MT, as the
increase in shipments to the United States and volume growth in domestic markets should
constrict the availability of supplies, and low world market raw sugar prices limit the returns for
such exports.
Ending stocks in 2017/18 are estimated to be 1.246 million MT, or 28.7 percent of deliveries for
human consumption. As noted, this estimate is based on inventory levels being sufficient to
meet domestic needs for the first few months of the 2018/19 fiscal year and on having supplies
on hand to satisfy early entries under the 2018/19 Export Limit. Ending stocks for 2018/19 are
projected to be a relatively tighter 1.008 million MT, or 22.1 percent of deliveries for human
17
Sugar and Sweeteners Outlook, SSS-M-359, July 18, 2018
USDA, Economic Research Serviceconsumption; as domestic and export growth draw down available supplies from beginning
stocks and projected production.
18
Sugar and Sweeteners Outlook, SSS-M-359, July 18, 2018
USDA, Economic Research ServiceU.S. Corn Sweetener Markets
U.S. High Fructose Corn Sweetener Production and
Deliveries Decline in First 3 Months of 2018
High fructose corn syrup (HFCS) production during the first quarter (January to March) of 2018
totaled 1.923 million short tons, dry weight (tons) a 3.9- percent decline from 2.000 million tons
in 2018. This marks the second-consecutive yearly decline for the first quarter and continues a
longer-term trend of gradual decline since 1999, when production of HFCS peaked. Domestic
deliveries also continue their downward trend, with first-quarter 2018 deliveries of 1.638 million
tons, down 2.6 percent from the same period in 2017.
Exports of HFCS during the first quarter of 2018 were down 9.3 percent, totaling 248,000 metric
tons, dry value (MT) (273,000 tons) to all countries, according to Census. Mexico remains the
top export market for HFCS by far, although exports through the first 3 months of 2018 still
declined. In the first quarter, exports of HFCS-55 to Mexico were 205,000 MT, down from last
19
Sugar and Sweeteners Outlook, SSS-M-359, July 18, 2018
USDA, Economic Research Serviceyear’s figure of 220,000 MT. The great majority of exports from the United States to Mexico
come in the form of HFCS-55—which has a higher proportion of fructose and typically is used in
beverage applications. Shipments of HFCS-55 to Mexico fell 9.8 percent during the first quarter
of 2018, however. Exports of the less-sweet HFCS-42 nearly doubled from the previous year,
although only accounting for about 2 percent of total trade.
According to Sosland Publishing, spot prices for HFCS in the United States remain higher than
for both HFCS-42 and HFCS-55, with the Midwest price increasing 3.7 percent on a dry weight
basis for both products from the previous year. The average spot price for HFCS-42 during the
first quarter of 2018 was 34.86 cents per pound. The spot price for HFCS-55 was 39.29 cents
per pound over the same period. Prices for HFCS have been steadily increasing since 2014,
coinciding with a series of developments in the U.S. wet mill corn milling industry that reduced
the HFCS production capacity and increased industry utilization rates.
20
Sugar and Sweeteners Outlook, SSS-M-359, July 18, 2018
USDA, Economic Research ServiceSuggested Citation
McConnell, Michael J., Sugar and Sweeteners Outlook, SSS-M-359, U.S. Department of Agriculture,
Economic Research Service, July 18, 2018
21
Sugar and Sweeteners Outlook, SSS-M-359, July 18, 2018
USDA, Economic Research ServiceContacts & Additional Information
Contact E-mail
Michael McConnell (coordinator) (202) 694-5184 michael.mcconnell@ers.usda.gov
Subscribe to ERS e-mail notification service at https://www Telephone.ers.usda.gov/subscribe-to-ers-
e-newletters/ to receive timely notification of newsletter availability.
Data
Tables from the Sugar and Sweeteners Yearbook are available in the Sugar and Sweeteners Topics at
http://www.ers.usda.gov/topics/sugar/. They contain the latest data and historical information on the
production, use, prices, imports, and exports of sugar and sweeteners.
Related Websites
Sugar and Sweeteners Outlook http://www.ers.usda.gov/Publications/SSS/
WASDE http://usda.mannlib.cornell.edu/MannUsda/viewDocumentInfo.do?documented=1194
Sugar Topics http://www.ers.usda.gov/topics/Sugar/
E-mail Notification
Readers of ERS outlook reports have two ways they can receive an e-mail notice about release of reports
and associated data.
• Receive timely notification (soon after the report is posted on the web) via USDA’s Economics,
Statistics and Market Information System (which is housed at Cornell University’s Mann Library).
Go to http://usda.mannlib.cornell.edu/MannUsda/aboutEmailService.do and follow the
instructions to receive e-mail notices about ERS, Agricultural Marketing Service, National
Agricultural Statistics Service, and World Agricultural Outlook Board products.
• Receive weekly notification (on Friday afternoon) via the ERS website. Go to
http://www.ers.usda.gov/Updates/and follow the instructions to receive notices about ERS outlook
reports, Amber Waves magazine, and other reports and data products on specific topics. ERS also
offers RSS (really simple syndication) feeds for all ERS products. Go to
http://www.ers.usda.gov/rss/ to get started.You can also read