Indici ESG, SRI o Tradizionali? - Quali le implicazioni derivanti dallo screening
←
→
Page content transcription
If your browser does not render page correctly, please read the page content below
For professional clients only

Indici ESG, SRI o Tradizionali?
Quali le implicazioni derivanti dallo screening

Milano 21 Marzo 2019

For professional clients only

Investimenti Sostenibili: la stampa, gli eventi e la regolamentazione

                                                                                      1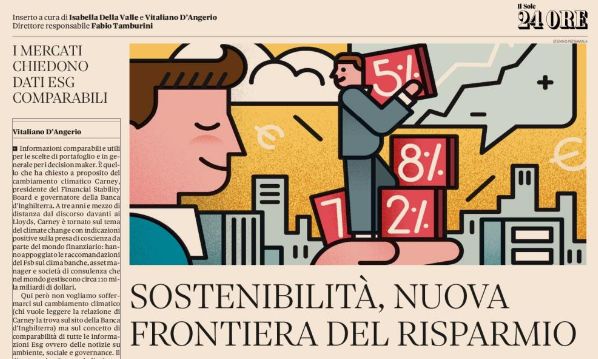
For professional clients only
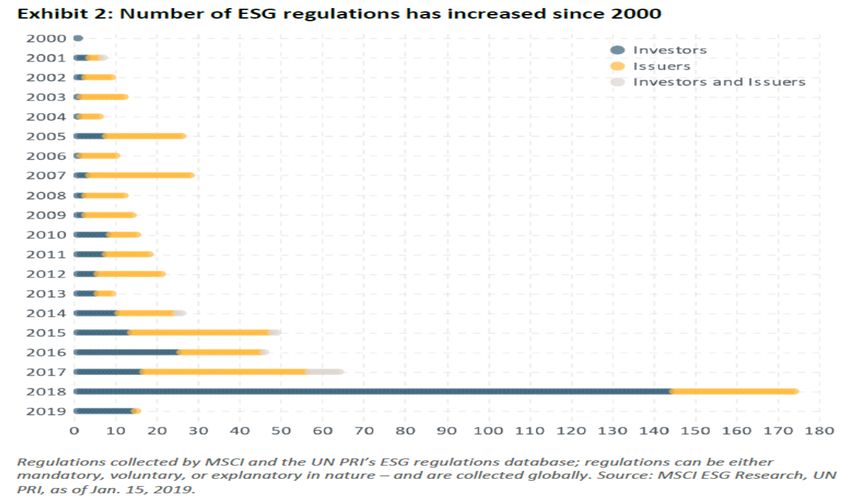
Incremento della regolamentazione in tema ESG
Fonte: MSCI 2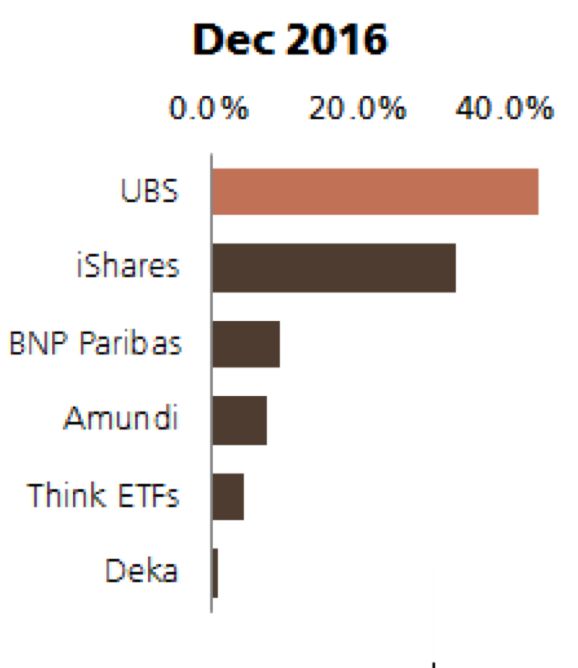
For professional clients only

ESG ETF – Dimensioni del mercato Europeo

                                        +24.2% Ytd                                                   Mar 2019
                                                                                                              0%            20%        40%

                                                                                                       UBS
                                          +12.13% ytd                                               iShares
                                                                                                                                                                   14.66
                                        ETF European mkt                                       BNP Paribas

                                             Ex-ESG                                                   Lyxor

                                                                                                  Candriam
                                                                                                                                                                            11.8
                                                                                            Legal & General

                                                                                                   Amundi

                                                                                                   OSSIAM

                                                                                                  Xtrackers

                                                                                                                                                       European SRI ETFs total AuM in USD bn
                                                                                                 Think ETFs

                                                                                                      Deka

                                                                                                 JPMorgan

                                                                                         Franklin Templeton

0.3
      Dec-12                   Dec-13                        Dec-14    Dec-15   Dec-16                             Dec-17                     Dec-18

               Source: ETGI, UBS Asset Management. As of March 2019.
                                                                                                                                                                                               3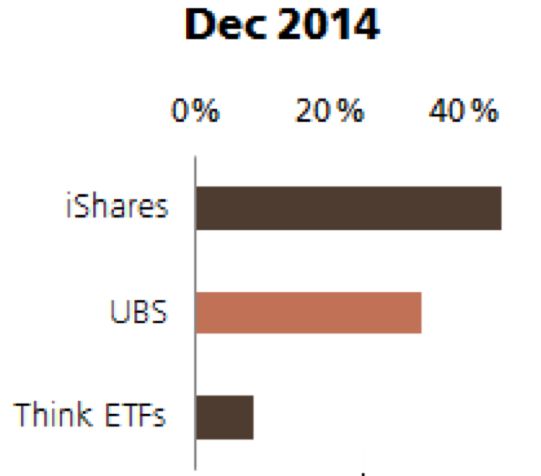
For professional clients only

    Vari Livelli di Screening – L'esempio di MSCI
                                                                                             MSCI World
                                                                                             Ex Tobacco Ex         MSCI World Low MSCI World ESG MSCI World            MSCI World
                                                                          MSCI World         Controversial Weapons Carbon         Universal      ESG Leaders           SRI 5%
Overall   ESG Rating                                                           A/BBB                      A/BBB                       A/BBB       A/AA       A/AA          AA/AAA
          ESG Score                                                              5.8                        5.8                          5.9       6.6        7.0            7.9
          Exposure to Tobacco                                                   1.1%                       0.0%                        1.2%       1.0%       0.0%           0.0%
Pillar    Environmental Pillar Score                                             6.1                        6.2                          6.2       6.4        6.6            7.0
Scores    Social Pillar Score                                                    4.7                        4.7                          4.7       5.0        5.2            5.6
          Governance Pillar Score                                                5.5                        5.5                          5.5       5.7        5.9            6.1
E         Carbon Emissions vs MSCI World                                      100.0%                      99.0%                        52.5%      78.4%      53.3%          47.8%
          Natural Resource Usage Theme Score                                     7.0                        7.1                          7.2       7.3        7.4            7.5
          Water Stress Management Score                                          4.4                        4.4                          4.3       4.5        4.7            4.9
S         Human Capital Theme Score                                              4.7                        4.7                          4.7       4.8        5.1            5.4
          Privacy & Data Security Score                                          6.7                        6.7                          6.5       6.8        7.1            7.4
          Labor Management Score                                                 5.6                        5.6                          5.8       5.7        6.0            6.1
G         Corporate Governance Theme Score                                       6.0                        6.0                          6.0       6.2        6.2            6.3
          Companies adhering to the
                                                                               89.0%                      88.7%                        89.0%      89.7%      90.2%          91.9%
          “One share, one vote” principle
          Companies that have an independent
                                                                               87.7%                      87.6%                        87.4%      88.5%      88.9%          91.4%
          board majority
          Companies that have no severe controversies                          92.2%                      92.5%                        93.6%      94.9%      96.6%          98.4%

                        Excluded mkt cap:                                         0%                        ~3%                        ~4%        ~12%      ~26%           ~30%
                        Cumulative exclusion:                                     0%                        ~3%                        ~7%        ~19%      ~45%           ~75%

               Numbers represent weighted averages of the Scores within the respective indices. Rating is a function of the weighted ESG Score.
               Source: MSCI ESG Manager, UBS Asset Management. Index data as of 31 August 2018, ESG data as of 19 September 2018.
                                                                                                                                                                                      4
Solo per investitori professionali
Costruzione degli indici MSCI SRI
La ricerca ESG è basata su tre dimensioni
2. Intangible Value Assessment (IVA)
Rating ESG
37 Problematiche ESG
Gestione a livello di impresa dei rischi e delle
opportunità ESG, rispetto ai
1. concorrenti
Screening
Business Positivo
MSCI Involvement
MSCI
IVA ESG Rating
Parent Screening (AAA-CCC)
SRI
IVAdiESG
Rating ESG minimo A e rating ≥ A
Index Esclusione di 8
attività aziendali: Alcol,
punteggio Controversy Score Index
Tabacco, Gioco d’azzardo,
IM ESG Score (0- di 4 IM ESG score ≥ 4
(es. MSCI Intrattenimento per adulti, 10) Obiettivo: 25% della (e.g. MSCI SRI
Targeting of 25% market
World) Armi da fuoco non militari, capitalizzazione dicapmercato World)
Armi militari,
Energia Nucleare,
in ogni settore
OGM
30 Indicatori ESG
3. ESG Controversy Score
Fonte: MSCI. UBS Asset Management. Solo a scopo illustrativo. 5For professional clients only
Vari Livelli di Screening - L'esempio di S&P
Un filtro più "light", per selezionare le migliori aziende senza stravolgere l'esposizione all'indice classico
S&P 500 I. UNGC II. Business III. ESG score S&P 500 ESG
Principles involvement
• World’s largest core
equity benchmark
• Top 500 US large-cap
companies
• Free-float market
capitalization weight
• Sustainability is not a
consideration
Worst 25%
Controversial ESG score
Weapons (ineligible)
500 leading US United Nations Global Tobacco Low ESG 316* most sustainable
companies Compact score within companies
GICS sector
75%
~ 2.4% market cap ~ 3.4% market cap ~ 19% market cap of S&P 500
excluded excluded excluded market cap
Arabesque’s s-Ray Sustainalytics RobecoSAM
*The constituents of S&P 500 ESG Index are
Source. S&P Dow Jones, UBS Asset Management, Data as of 30th April 2019. 319
6For professional clients only Filtri ESG ed SRI Differenze nell'allocazione settoriale e per paese
For professional clients only

Light screening vs hard screening – allocazione settoriale
Differenze di allocazione settoriale derivanti dall'applicazione di criteri di sostenibilità più o meno stringenti

                                                                                                                                     MSCI USA SRI vs MSCI USA
                       Utilities                                                           -0,65%
                                                                                                -0,16%                               SP500 esg vs SP500

                                           -6,30%
     Communication Services                                            -2,55%

                  Real Estate                                                                                     0,69%
                                                                                                          0,02%

                                                                                                                             1,96%
                    Materials                                                                                0,22%

                                                                                         -0,83%
      Information Technology                                                                                                                    4,07%

                   Industrials                                                                                       1,07%
                                                                                -1,79%

                  Health Care                                                                  -0,20%
                                                                                                 -0,06%

                    Financials                                                                            0,14%
                                                                                         -0,79%

                        Energy                                                           -0,78%
                                                                                               -0,10%

           Consumer Staples                                                                                                             3,06%
                                                                                                             0,34%

     Consumer Discretionary                                                                                                  1,84%
                                                                                                                  0,80%

                               -8,00%                -6,00%   -4,00%              -2,00%             0,00%                2,00%             4,00%           6,00%

            Fonte: MSCI, S&P Dow Jones , 29-mar-19                                                                                                                  8
For professional clients only
Azionario Euro – allocazione settoriale e per paese
MSCI EMU SRI vs MSCI EMU
MSCI EMU SRI vs MSCI EMU Spain
Utilities
Communication Services Portugal
Real Estate Netherlands
Materials
Italy
Information Technology
Ireland
Industrials
Germany
Health Care
France
Financials
Finland
Energy
Belgium
Consumer Staples
Consumer Discretionary Austria
-6,00% -4,00% -2,00% 0,00% 2,00% 4,00% 6,00% 8,00% -10,00% -5,00% 0,00% 5,00% 10,00%
* Fonte MSCI , 29-mar-19
9For professional clients only
Azionario Paesi Emergenti– allocazione settoriale e per paese
MSCI Emerging SRI vs MSCI Emerging
Utilities United Arab Emirates
Turkey
Thailand
Communication Services
Taiwan
South Africa
Real Estate
Russia
Qatar
Materials Poland
Philippines
Information Technology Peru
Pakistan
Mexico
Industrials
Malaysia
Korea
Health Care
Indonesia
India
Financials Hungary
Greece
Energy Egypt
Czech Republic
Consumer Staples Colombia
China
Chile
Consumer Discretionary
Brazil
-8,00% -3,00% 2,00% 7,00% 12,00% -30,00% -25,00% -20,00% -15,00% -10,00% -5,00% 0,00% 5,00% 10,00%
* Fonte MSCI , 29-mar-19
10For professional clients only Filtri ESG ed SRI Incidenza nelle metriche di rischio
For professional clients only

Impatto sulle misure di rischio – Azionario America

                         SP500 ESG*                     SP500*                                     MSCI USA SRI**                      MSCI USA**

   Maximum DD                   19.29%                    19.49%     Maximum DD                              18.26%                          19.65%

       Rmac                     11.85%                    11.99%         Rmac                                13.69%                          12.68%

     Volatilità                 13.61%                    13.78%       Volatilità                            12.92%              >           12.82%

        TEV                      0.93%                                    TEV                                 2.16%

         IR                      -0.15                                     IR                                  0.46

      Sharpe                      0.87                      0.87        Sharpe                                 1.06                           0.99

 Downside deviation             10.54%                    10.67%   Downside deviation                        11.12%                          11.60%

    Correlazione                99.81%                                Correlazione                           98.59%

       Beta                     0.9850                                   Beta                                 0.9934

      Sortino                     1.12                      1.12        Sortino                                1.23                           1.09

        * Fonte Bloomberg, weekly data 31-dec-10   to 29-mar-19                     ** Fonte Bloomberg, weekly data 08-jul-16 to 29-mar-19

                                                                                                                                                        12
For professional clients only
Impatto sulle misure di rischio – Azionario Euro
MSCI EMU SRI MSCI EMU
Maximum DD 18.25% 22.03%
Rmac 10.25% +4.29% p.a. 5.96%
Volatilità 14.31% 14.97%
TEV 2.90%
IR 1.48
Sharpe 0.72 0.40
Downside deviation 9.73% 10.23%
Correlazione 98.14%
Beta 0.9381
Sortino 1.05 0.58
* Fonte Bloomberg, weekly data 02-oct-15 to 29-mar-19
13For professional clients only
Impatto sulle misure di rischio – Azionario Paesi Emergenti
MSCI EMERGING SRI MSCI EMERGING
Maximum DD 31.52% 35.55%
Rmac 2.91% 2.55%
Volatilità 15.60% 16.44%
TEV 4.66%
IR 0.08
Sharpe 0.19 0.15
Downside deviation 9.91% 10.44%
Correlazione 95.90%
Beta 0.9097
Sortino 0.29 0.24
* Fonte Bloomberg, weekly data 13-jun-14 to 29-mar-19
14For professional clients only
Conclusioni
1. La selezione basata sui criteri di sostenibilità si traduce in differenze
anche sostanziali di allocazione per settore o per paese.
2. Non sempre l'utilizzo di filtri Socially Responsible portano ad una
riduzione della volatilità.
3. In tutti I casi I filtri hanno portato ad una riduzione del massimo
drawdown e della downside deviation.
15For professional clients only
Risk information
UBS ETFs investing in equities received by the Fund from the Swap Counterparty under the terms of the Relevant Swap and, therefore,
UBS Exchange Traded Funds invest in equities and may therefore be subject to high fluctuations in value. are subject to the credit risk of the Swap Counterparty. In the event that the Swap Counterparty defaults
For this reason, an investment horizon of at least five years and corresponding risk tolerance and capacity under the terms of the Relevant Swap, the Fund may suffer a loss. Assets are passively managed meaning
are required. All investments are subject to market fluctuations. Every fund has specific risks, which can losses that could be avoided via active management will not be offset. The net asset value of the Fund’s
significantly increase under unusual market conditions. The fund’s assets are passively managed. As a assets are directly dependent on the performance of the underlying investments. In case the currency of
result, the net asset value of the fund’s assets is directly dependent on the performance of the underlying the product is different from your reference currency, the return may increase or decrease as a result of
equities. Losses that could be avoided via active management will not be offset. currency fluctuations.
UBS ETFs investing in Real Estate Funds UBS ETFs investing in Fixed Income
The funds invest in real estate funds under Swiss law that are denominated in CHF and invest exclusively in This UBS Exchange Traded Fund invests in treasuries and corporate bonds and may therefore be subject to
Swiss properties. The price of the underlying fund units is not determined by estimates of market value high fluctuations in value. For this reason, an investment horizon of at least five years and corresponding
but by investor supply and demand. All investments are subject to market fluctuations. Every fund has risk tolerance and capacity are required. All investments are subject to market fluctuations. Every fund has
specific risks, which may increase considerably in unusual market conditions. Please contact your client specific risks, which can significantly increase under unusual market conditions. As a result, the net asset
advisor if you wish to receive further information on the investment risks associated with this product. value of the funds assets is directly dependent on the performance of the underlying index. Losses that
could be avoided via active management will not be offset.
UBS ETFs investing in Metals
The UBS Exchange Traded Fund investing in metals may be subject to considerable fluctuations in value. UBS ETFs investing in Multi Asset Portfolios
Investors therefore require an investment horizon of at least five years and corresponding risk tolerance The Fund is highly dynamic and may exhibit above-average potential growth and investment performance,
and capacity. All investments are subject to market fluctuations. All funds have specific risks, which may depending on the economic environment. For this reason, an investment horizon of at least five years and
significantly increase under unusual market conditions. The fund’s assets are passively managed. As a corresponding risk tolerance and capacity are required. The Fund is exposed to the investment risk arising
result, the net asset value of the fund’s assets is directly dependent on the performance of the underlying from the Reference Strategy underlying the Swaps. In the event that the swap counterparty defaults under
equities. Losses that could be avoided via active management will not be offset. the terms of the relevant swap, the Fund may suffer a loss. The Fund’s assets are passively managed. As a
result, the net asset value of the Fund’s assets is materially dependent on the performance of the
UBS ETFs investing in Oil and Commodities underlying investments. Losses that could be avoided via active management will not be offset. The
The Fund delivers the returns of a broadly diversified commodity index and may therefore be subject to Reference Strategy is a rules based Algorithm designed to target consistent returns but may not be
high fluctuations in value. For this reason, an investment horizon of at least five years and corresponding effective in delivering such returns.
risk tolerance and capacity are required. The returns payable on the Fund are dependant on payments
received by the Fund from the Swap Counterparty under the terms of the Relevant Swap and, therefore,
are subject to the credit risk of the Swap Counterparty. In the event that the Swap Counterparty defaults
under the terms of the Relevant Swap, the Fund may suffer a loss. Assets are passively managed meaning
losses that could be avoided via active management will not be offset. The net asset value of the Fund’s
assets are materially dependent on the performance of the underlying investments. In case the currency
of the product is different from your reference currency, the return may increase or decrease as a result of
currency fluctuations. All investments are subject to market fluctuations. Every fund has specific risks,
which can significantly increase under unusual market conditions.
UBS ETFs investing in HFR
The Fund delivers the returns of a broadly diversified hedge fund index and may therefore be subject to
high fluctuations in value. For this reason, an investment horizon of at least five years and corresponding
risk tolerance and capacity are required. The returns payable on the Fund are dependent on payments
16For professional clients only
Disclaimer
For marketing and information purposes by UBS.
For qualified investors only. The information and opinions contained in this document have been compiled or arrived at based upon information obtained from sources believed to be reliable and in good faith, but is not guaranteed as being accurate, nor
is it a complete statement or summary of the securities, markets or developments referred to in the document. UBS AG and / or other members of the UBS Group may have a position in and may make a purchase and / or sale of any of the securities or
other financial instruments mentioned in this document.
UBS funds under Luxembourg law.
BLOOMBERG® is a trademark and service mark of Bloomberg Finance L.P. BARCLAYS® is a trademark and service mark of Barclays Bank Plc, used under license. Bloomberg Finance L.P. and its affiliates, including Bloomberg Index Services Limited ("BISL")
(collectively, "Bloomberg"), or Bloomberg’s licensors own all proprietary rights in the Bloomberg Barclays US 1-3 Year Treasury Bond Total Return, Bloomberg Barclays US 1-3 Year Treasury Bond hedged to EUR Total Return, Bloomberg Barclays US 7-10
Year Treasury Bond Total Return, Bloomberg Barclays EUR Treasury 1-10 Bond Index, Bloomberg Barclays Euro Area Liquid Corporates 1-5 Year Total Return, Bloomberg Barclays Euro Area Liquid Corporates 1-5 Year (hedged to CHF) Total Return,
Bloomberg Barclays Euro Area Liquid Corporates 1-5 Year (hedged to USD) Total Return, Bloomberg Barclays Euro Area Liquid Corporates Total Return, Bloomberg Barclays Euro Area Liquid Corporates (hedged to CHF) Total Return, Bloomberg Barclays
Euro Area Liquid Corporates (hedged to USD) Total Return, Bloomberg Barclays Euro Area Liquid Corporates (hedged to GBP) Total Return, Bloomberg Barclays Euro Area Liquid Corporates (hedged to CAD) Total Return, Bloomberg Barclays Euro Area
Liquid Corporates (hedged to SGD) Total Return, Bloomberg Barclays Euro Area Liquid Corporates™ Duration hedged Total Return, Bloomberg Barclays Euro Area Liquid Corporates™ Duration hedged (hedged to CHF) Total Return, Bloomberg Barclays
Euro Area Liquid Corporates™ Duration hedged (hedged to USD) Total Return, Bloomberg Barclays Euro Area Liquid Corporates™ Duration hedged (hedged to GBP) Total Return, Bloomberg Barclays Euro Area Liquid Corporates™ Duration hedged (hedged
to CAD) Total Return, Bloomberg Barclays Euro Area Liquid Corporates™ Duration hedged (hedged to SGD) Total Return, Bloomberg Barclays MSCI US Liquid Corporates Sustainable Total Return, Bloomberg Barclays MSCI US Liquid Corporates Sustainable
hedged to CHF Index, Bloomberg Barclays MSCI US Liquid Corporates Sustainable hedged to EUR Index, Bloomberg Barclays MSCI US Liquid Corporates Sustainable hedged to GBP Index, Bloomberg Barclays US Government 1-10 Year Inflation-Linked Bond
Index, Bloomberg Barclays US Government 1-10 Year Inflation-Linked Bond Index, Bloomberg Barclays US Government 1-10 Year Inflation-Linked Bond Index hedged to CHF, Bloomberg Barclays US Government 1-10 Year Inflation-Linked Bond Index
hedged to EUR, Bloomberg Barclays Euro Government Inflation-Linked 1-10 Year, Bloomberg Barclays Euro Government Inflation-Linked 1-10 Year hedged to USD, Bloomberg Barclays Euro Government Inflation-Linked 1-10 Year hedged to CHF,
Bloomberg Barclays Euro Government Inflation-Linked 1-10 Year hedged to GBP, Bloomberg Barclays Euro Government Inflation-Linked 1-10 Year hedged to SGD, Bloomberg Barclays Euro Government Inflation-Linked 1-10 Year hedged to CAD,
Bloomberg Barclays Euro Government Inflation-Linked 10+ Year, Bloomberg Barclays Euro Government Inflation-Linked 10+ Year hedged to USD, Bloomberg Barclays Euro Government Inflation-Linked 10+ Year hedged to CHF, Bloomberg Barclays Euro
Government Inflation-Linked 10+ Year hedged to GBP, Bloomberg Barclays Euro Government Inflation-Linked 10+ Year hedged to SGD, Bloomberg Barclays Euro Government Inflation-Linked 10+ Year hedged to CAD, Bloomberg Barclays US Government
1-10 Year Inflation-Linked Bond™ Index hedged to GBP, Bloomberg Barclays US Government 10+ Year Inflation-Linked Bond Index, Bloomberg Barclays US 10+ Year Treasury Bond Index hedged to EUR, Bloomberg Barclays US Liquid Corporates 1-5 Year
Total Return, Bloomberg Barclays US Liquid Corporates 1-5 Year (hedged to CHF) Total Return, Bloomberg Barclays US Liquid Corporates 1-5 Year (hedged to EUR) Total Return, Bloomberg Barclays US Liquid Corporates 1-5 Year (hedged to GBP) Total
Return, Bloomberg Barclays US Liquid Corporates Total Return, Bloomberg Barclays US Liquid Corporates (hedged to CHF) Total Return, Bloomberg Barclays US Liquid Corporates (hedged to EUR) Total Return, Bloomberg Barclays US Liquid Corporates
(hedged to GBP) Total Return, Bloomberg Barclays US Liquid Corporates Duration Hedged Index Total Return, Bloomberg Barclays Emerging Markets USD Sovereign & Agency 3% Country Capped Index, Bloomberg Barclays Emerging Markets USD
Sovereign & Agency 3% Country Capped Index hedged to CHF, Bloomberg Barclays Emerging Markets USD Sovereign & Agency 3% Country Capped Index hedged to EUR, Bloomberg Barclays Emerging Markets USD Sovereign & Agency 3% Country Capped
Index hedged to GBP, Bloomberg Barclays MSCI Euro Area Liquid Corporates Sustainable Total Return, Bloomberg Barclays Euro HQLA 1-5 Years Bond Index.
Neither Barclays Bank PLC, Barclays Capital Inc., nor any affiliate (collectively "Barclays") nor Bloomberg is the issuer or producer of UBS ETF – Bloomberg Barclays US 1-3 Year Treasury Bond UCITS ETF, UBS ETF – Bloomberg Barclays US 7-10 Year Treasury
Bond UCITS ETF, UBS ETF – Bloomberg Barclays EUR Treasury 1-10 UCITS ETF, UBS ETF – Bloomberg Barclays Euro Area Liquid Corporates 1-5 Year UCITS ETF, UBS ETF – Bloomberg Barclays MSCI US Liquid Corporates Sustainable UCITS ETF, UBS ETF –
Bloomberg Barclays TIPS 1-10 UCITS ETF, UBS ETF – Bloomberg Barclays TIPS 10+ UCITS ETF, UBS ETF – Bloomberg Barclays Euro Inflation Linked 1-10 UCITS ETF, UBS ETF – Bloomberg Barclays Euro Inflation Linked 10+ UCITS ETF, UBS ETF – Bloomberg
Barclays Capital US 10+ Year Treasury Bond UCITS ETF, UBS ETF – Bloomberg Barclays US Liquid Corporates 1-5 Year UCITS ETF, UBS ETF – Bloomberg Barclays US Liquid Corporates UCITS ETF, UBS ETF – Bloomberg Barclays USD Emerging Markets
Sovereign UCITS ETF, UBS ETF – Bloomberg Barclays MSCI Euro Area Liquid Corporates Sustainable UCITS ETF, UBS ETF – Bloomberg Barclays US Liquid Corporates Interest Rate hedged UCITS ETF, UBS ETF – Bloomberg Barclays EUR High Quality Liquid
Assets 1-5 Bond UCITS ETF and neither Bloomberg nor Barclays has any responsibilities, obligations or duties to investors in the above mentioned products. The above mentioned indices are licensed for use by UBS ETF SICAV as the Issuer of the above
mentioned products. The only relationship of Bloomberg and Barclays with the Issuer in respect of the above mentioned indices is the licensing of the above mentioned indices, which is determined, composed and calculated by BISL, or any successor
thereto, without regard to the Issuer or the above mentioned products or the owners of the above mentioned products.
Before investing in a product please read the latest prospectus carefully and thoroughly. Units of UBS funds mentioned herein may not be eligible for sale in all jurisdictions or to certain categories of investors and may not be offered, sold or delivered in
the United States. The information mentioned herein is not intended to be construed as a solicitation or an offer to buy or sell any securities or related financial instruments. Past performance is not a reliable indicator of future results. The performance
shown does not take account of any commissions and costs charged when subscribing to and redeeming units. Commissions and costs have a negative impact on performance. If the currency of a financial product or financial service is different from your
reference currency, the return can increase or decrease as a result of currency fluctuations. This information pays no regard to the specific or future investment objectives, financial or tax situation or particular needs of any specific recipient. The details
and opinions contained in this document are provided by UBS without any guarantee or warranty and are for the recipient’s personal use and information purposes only. This document may not be reproduced, redistributed or republished for any
purpose without the written permission of UBS AG. Source for all data and charts (if not indicated otherwise): UBS Asset Management.
This document contains statements that constitute “forward-looking statements”, including, but not limited to, statements relating to our future business development. While these forward-looking statements represent our judgments and future
expectations concerning the development of our business, a number of risks, uncertainties and other important factors could cause actual developments and results to differ materially from our expectations.
Representative in Switzerland for UBS funds established under foreign law: UBS Fund Management (Switzerland) AG, P.O. Box, CH-4002 Basel. Paying agent: UBS Switzerland AG, Bahnhofstrasse 45, CH-8001 Zurich. Prospectuses, simplified prospectuses
or key investor information, the articles of association or the management regulations as well as annual and semi-annual reports of UBS funds are available free of charge from UBS AG, P.O. Box, CH-4002 Basel or from UBS Fund Management
(Switzerland) AG, P.O. Box, CH-4002 Basel..
© UBS 2018. The key symbol and UBS are among the registered and unregistered trademarks of UBS. All rights reserved.
17You can also read