Large buyer Coordinated demand visibility update - 23 July 2018 IAS
←
→
Page content transcription
If your browser does not render page correctly, please read the page content below

Large buyer Coordinated demand visibility update
23 July 2018
IAS
The Netherlands
Global Fund, PEPFAR and Government of South Africa are working
together to improve the consolidated demand outlook

     What we will do                                What we will not do together
  Coordinated approach and messages             Long-term agreements with manufacturers
  Synergistic strategies                        Selection of suppliers and demand allocation
  Direct engagement with suppliers & supplier   Execution of purchase orders
  visits (sometimes)
                                                We will not manage actual supplier
  Align on key supplier performance metrics     performance jointly
  Sharing of synthesized market intelligence    Managing overall supplier performance
  and general supplier performance              (Price, lead-time, delivery etc.)

  Sharing information (without providing
  confidential / sensitive information)
  Providing improved demand visibility

                                                                                               2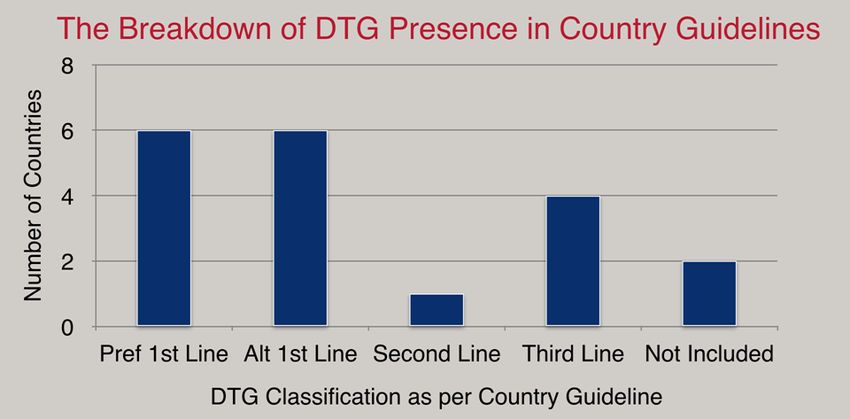
Increased dialogue between buyers & sellers over the last 20 months
Update @ July 2018
June 2014 Nov. 2016 March 2017 Aug 2017 Nov 2017 April 2018
July 2018 Review and
Joint Global Large ARV 4 month update: web update Annual forum – update adjust cycle
Fund/ PEPFAR 2016Buyers and @ AMDS Cape Town @ AMDS
update @ IAS as needed
Supplier Sellers Forum -
Conference Geneva
All updates posted @ https://www.theglobalfund.org/en/sourcing-management/health-products/antiretrovirals/
Other actions being adopted by buyers and sellers
A number of procurement channels considering performance metrics, Framework contracts and
moving away from frequent spot tenders
Big funders/buyers committed to further strengthen partnership and improve on demand
management
3 Improve certainty on the time dimension; reduced volatility (smoothen demand)
Aligned messages to programs on the benefits of better planning; incentivize good planning
Demand & Expand scope and discuss forecasts/deviations to improve “trust in the forecast”
Streamline administrative process and reduce bottlenecks to reduce inventory & write-offs
order
Stronger coordination amongst funders and buyers
management
Improved and more timely demand planning at the country level
Stable buyer/seller partnership and volume certainty to enable sustainable investment and to optimize
Process & process development, API sourcing, and production
product Early and continuous engagement especially on new products (buyer, seller, & programs)
lifecycle Optimize and harmonize product and packaging specifications
Clear pathways for new products and new suppliers
Buyers to align on performance metrics
Incentivize continuous improvement
Performance
Articulate the cost of poor performance and encourage procurement channels to consider factors beyond
price especially performance
4Large ARV Buyers and Sellers Forum November 2017
Breakout Sessions notes: Value for Money
Topics discussed
Sourcing/ Supplier ▪ Reduce packaging and markings while linking with regulations
Management ▪ Bring services closer to customers to reduces freight cost and allow for smaller batch sizes
▪ Deliver large orders in smaller consignments
Demand Management ▪ Demand planning should be a 2-way communication
▪ Execute volume commitments
Enable continuous production through smoother more regular orders
Leverage technology to use bar-coding
Implement packaging efficiencies to reduce shipping costs
Process & product
Harmonize labelling requirements by aligning global, regional and national approaches
lifecycle Encourage swifter regulatory approvals to implement manufacturing and supply efficiencies
Alignment of regulatory processes to be able to while bringing more countries into regional harmonization efforts
Reduce pill size through process technologies and new molecules
Invest in local packaging
Supply chain
Freight optimization
optimization Ship bulk drugs to country and execute filling and labeling in country
For manufacturers it is all about lead time
Improve forecasting Big buyers do the forecasts
Single standard or put in barcodes that can be accessed in country (and link to reporting mechanism).
Optimize packaging & Inserts can be printed locally or made directly available to patient via their cell phone
labeling Remove inserts and remove cartons (and standardize)
Doing away with the cartons – low hanging fruitLarge ARV Buyers and Sellers Forum November 2017
Breakout Sessions notes: Value for Money (2)
Topics discussed
Sourcing closer to For a local manufacturing level – capex is an issue. The length of tender or finding innovative finance mechanisms or an
demand operational model that can spread the burden of this risk
In a large country – placing larger orders is a struggle – instead deliver it in monthly/quarterly batches; formulate the order to
Optimize storage
be delivered in batches
Leverage technology: bar coding and automatic ordering
Leverage cell phone technology for pharmacovigilance
Better leverage regional warehouses
Other Redefine shelf life requirements to not hamper longer shelf life products and emergency deliveries.
• suppliers recommend using months of until expiry instead of a percentage of RSL.
Multi-month packs
Establish market early warning system for suppliersLarge ARV Buyers and Sellers Forum November 2017
Breakout Sessions notes: Demand Management
Topics discussed
Information needed Need also more disaggregated demand information including company specific allocations from more buyers
Demand visibility should be shared for the next level up in the supply chain (e.g. FPP to provide visibility to API etc.)
Accuracy +/- 20% in forecasts is manageable
Substantive uncertainty of demand with order late or not visible/predictable creates significant peaks and troughs in demand
Manufacturing inefficiency where unutilized capacity and stop/start takes time to restart/respond - or may be allocated to
Impacts of poor other products
demand Respond to poor demand management by holding inventory – so works in terms of responsiveness for buyers – even
though not at an insignificant cost of capital and expiry risk (especially with high remaining shelf life requirements)
Challenges compounded up the supply chain and longer lead-times for sourcing of APIs and Key Starting Materials (KSM)Global Fund, PEPFAR, Republic of South Africa Demand Management Update 23 July 2018 IAS The Netherlands
Caveats and Limitations
Conservative estimates based on currently confirmed demand
Prepared based on data currently available to The Global Fund,
Government of South Africa, Kenya and PEPFAR
Kenya data may include PEPFAR, Global Fund and
Government of Kenya demand
PEPFAR data is inclusive of both USAID and CDC demand
Preliminary estimates for discussion only – and not final
purchase commitments
May not yet fully capture lead times between order placement
at manufacturer and in-country deliveryForecast at mid-July
Consolidated Demand Forecast Outlook
Overall ARV Demand Outlook
Q3 2018-Q4 2019, Number of packs, million
▪ Malawi ▪ Kenya ▪ TLE/TEE ▪ LZ (adult)
PEPFAR
▪ Tanzania ▪ Mozambique ▪ LZN (adult) ▪ EFV 600
Kenya
▪ Zimbabwe ▪ Nigeria ▪ LZN (pediatric) ▪ NVP 200
Republic of South Africa
▪ Ethiopia ▪ Uganda ▪ Lpv/r (adult) ▪ TLD
Global Fund ▪ Zambia ▪ Cote d'Ivoire ▪ ATV/r ▪ DTG 50mg
44
41 41 47
37 9
7 33
9 4
14 4 4
4 4 ▪ TL 3
4
4 15 16
12 13 13 13 9
14 16
16
14
18 18
14 13 10
9
Q3 2018 Q4 2018 Q1 2019 Q2 2019 Q3 2019 Q4 2019
DISCLAIMER: This is an initial version of the forecast, and may contain inaccuracies. These slides contain a conservative estimate for demand management between the three programs. As such, there may be future volumes not
yet financially committed or confirmed. 10
SOURCE: PEPFAR (USAID and CDC), Kenya, Government of South Africa, The Global FundForecast at mid-July
TLE 600, TLE 400, and TEE – Consolidated Demand Forecast Outlook
Overall ARV Demand Outlook
Q3 2018-Q4 2019, Number of packs, million
▪ Malawi ▪ Kenya
PEPFAR
▪ Tanzania ▪ Mozambique
Kenya ▪ Zimbabwe ▪ Nigeria
Republic of South Africa ▪ Ethiopia ▪ Uganda
The Global Fund ▪ Zambia ▪ Cote d'Ivoire
28
28
2
22 3 19
2 2 19
5 1 1
13 1 1 11
2 13
12 13 13 13 9
4
1
8
12 1
11 13 2
10 9 7
3
Q3 2018 Q4 2018 Q1 2019 Q2 2019 Q3 2019 Q4 2019
DISCLAIMER: This is an initial version of the forecast, and may contain inaccuracies. These slides contain a conservative estimate for demand management between the three programs. As such, there may be future volumes not
yet financially committed or confirmed. 11
SOURCE: PEPFAR (USAID and CDC), Kenya, Government of South Africa, The Global FundForecast at mid-July
TLD – Consolidated Demand Forecast Outlook
Overall ARV Demand Outlook
Q2 2018-Q3 2019, Number of packs, million
PEPFAR
▪ Malawi ▪ Kenya
Kenya ▪ Tanzania ▪ Mozambique
Republic of South Africa ▪ Zimbabwe ▪ Nigeria
The Global Fund ▪ Ethiopia ▪ Uganda
▪ Zambia ▪ Cote d'Ivoire
22
8 15
2
12
2 2
1210 137 136 13
3
9
1
6 9
5 4 11
5
0.1
-
0.6 1
4 3 3 0.2
1- 1-
Q3 2018 Q4 2018 Q1 2019 Q2 2019 Q3 2019 Q4 2019
DISCLAIMER: This is an initial version of the forecast, and may contain inaccuracies. These slides contain a conservative estimate for demand management between the three programs. As such, there may be future volumes not
yet financially committed or confirmed. 12
SOURCE: PEPFAR (USAID and CDC), Kenya, Government of South Africa, The Global FundForecast at mid-July
DTG 50mg – Consolidated Demand Forecast Outlook
Overall ARV Demand Outlook
Q3 2018-Q4 2019, Number of packs, thousands
PEPFAR
▪ Malawi ▪ Kenya
Kenya ▪ Tanzania ▪ Mozambique
Republic of South Africa ▪ Zimbabwe ▪ Nigeria
▪ Ethiopia ▪ Uganda
The Global Fund
▪ Zambia ▪ Cote d'Ivoire
1,433 1,440 1,503
9 17
9
50 54
45
12 13 13262 13 9
437 1,334 1,381 1,427
119
8
379
118 38
7 -
28 1 216
51- 45 0.2 5
Q3 2018 Q4 2018 Q1 2019 Q2 2019 Q3 2019 Q4 2019
DISCLAIMER: This is an initial version of the forecast, and may contain inaccuracies. These slides contain a conservative estimate for demand management between the three programs. As such, there may be future volumes not
yet financially committed or confirmed. 13
SOURCE: PEPFAR (USAID and CDC), Kenya, Government of South Africa, The Global FundForecast at mid-July
LZN (Adult) – Consolidated Demand Forecast Outlook
Overall ARV Demand Outlook
Q3 2018-Q4 2019, Number of packs, thousands
▪ Malawi ▪ Kenya
▪ Tanzania ▪ Mozambique
PEPFAR Kenya The Global Fund
▪ Zimbabwe ▪ Nigeria
▪ Ethiopia ▪ Uganda
▪ Zambia ▪ Cote d'Ivoire
2,443
15
513
1,432 1,209
12 13 13 13 9 983
970 14
667 14 70
839 47 1,915 140
15
590 1,125
275 829
593
333 377
-
Q3 2018 Q4 2018 Q1 2019 Q2 2019 Q3 2019 Q4 2019
DISCLAIMER: This is an initial version of the forecast, and may contain inaccuracies. These slides contain a conservative estimate for demand management between the three programs. As such, there may be future volumes not
yet financially committed or confirmed. 14
SOURCE: PEPFAR (USAID and CDC), Kenya, Government of South Africa, The Global FundForecast at mid-July
LZN (Pediatric) – Consolidated Demand Forecast Outlook
Overall ARV Demand Outlook
Q3 2018-Q4 2019, Number of packs, thousands
▪ Malawi ▪ Kenya
▪ Tanzania ▪ Mozambique
PEPFAR Kenya The Global Fund
▪ Zimbabwe ▪ Nigeria
▪ Ethiopia ▪ Uganda
▪ Zambia ▪ Cote d'Ivoire
1,368
1,180
275
52 738
354
52 49
12 13 13 13 9
395
324 52
1,041 48
774 45 143
637 52
52 34
57 52 295
227
Q3 2018 Q4 2018 Q1 2019 Q2 2019 Q3 2019 Q4 2019
DISCLAIMER: This is an initial version of the forecast, and may contain inaccuracies. These slides contain a conservative estimate for demand management between the three programs. As such, there may be future volumes not
yet financially committed or confirmed.
SOURCE: PEPFAR (USAID and CDC), Kenya, Government of South Africa, The Global Fund 15Forecast at mid-July
LPV/r (adult) – Consolidated Demand Forecast Outlook
Overall ARV Demand Outlook
Q3 2018-Q4 2019, Number of packs, thousands
PEPFAR ▪ Malawi ▪ Kenya
Kenya ▪ Tanzania ▪ Mozambique
Republic of South Africa ▪ Zimbabwe ▪ Nigeria
The Global Fund ▪ Ethiopia ▪ Uganda
▪ Zambia ▪ Cote d'Ivoire
1,110
1,005
920
198 399
144
124
80 46 462 405 398
12 13 13 13
42 9
499 578 42 43
539 28
18 16
267 253 236
184 152 125 103
92 92
Q3 2018 Q4 2018 Q1 2019 Q2 2019 Q3 2019 Q4 2019
DISCLAIMER: This is an initial version of the forecast, and may contain inaccuracies. These slides contain a conservative estimate for demand management between the three programs. As such, there may be future volumes not
yet financially committed or confirmed.
SOURCE: PEPFAR (USAID and CDC), Kenya, Government of South Africa, The Global Fund 16Forecast at mid-July
ATV/r – Consolidated Demand Forecast Outlook
Overall ARV Demand Outlook
Q3 2018-Q 2019, Number of packs, thousands
PEPFAR ▪ Malawi ▪ Kenya
Kenya ▪ Tanzania ▪ Mozambique
▪ Zimbabwe ▪ Nigeria
The Global Fund ▪ Ethiopia ▪ Uganda
▪ Zambia ▪ Cote d'Ivoire
956
728
149 459 386
708 385
372
222 51 54
106
13 13 13
12 9 56
249
126 178 357 268 278
122 101 159 64 38
Q3 2018 Q4 2018 Q1 2019 Q2 2019 Q3 2019 Q4 2019
DISCLAIMER: This is an initial version of the forecast, and may contain inaccuracies. These slides contain a conservative estimate for demand management between the three programs. As such, there may be future volumes not
yet financially committed or confirmed.
SOURCE: PEPFAR (USAID and CDC), Kenya, Government of South Africa, The Global Fund 17Forecast at mid-July
TL – Consolidated Demand Forecast Outlook
Overall ARV Demand Outlook
Q3 2018-Q4 2019, Number of packs, thousands
▪ Malawi ▪ Kenya
PEPFAR ▪ Tanzania ▪ Mozambique
Kenya ▪ Zimbabwe ▪ Nigeria
The Global Fund ▪ Ethiopia ▪ Uganda
▪ Zambia ▪ Cote d'Ivoire
1,604
1,321 142
237 1,067
448
869 800
378
12 13
308 13 13 538 9 119
573 1,225 187 167
114
365 169
502 514
300 196 255
Q3 2018 Q4 2018 Q1 2019 Q2 2019 Q3 2019 Q4 2019
DISCLAIMER: This is an initial version of the forecast, and may contain inaccuracies. These slides contain a conservative estimate for demand management between the three programs. As such, there may be future volumes not
yet financially committed or confirmed.
SOURCE: PEPFAR (USAID and CDC), Kenya, Government of South Africa, The Global Fund 18Forecast at mid-July
LZ (adult) – Consolidated Demand Forecast Outlook
Overall ARV Demand Outlook
Q3 2018-Q4 2019, Number of packs, thousands
PEPFAR
▪ Malawi ▪ Kenya
Kenya
▪ Tanzania ▪ Mozambique
▪ Zimbabwe ▪ Nigeria
Republic of South Africa
▪ Ethiopia ▪ Uganda
The Global Fund
▪ Zambia ▪ Cote d'Ivoire
1,862
1,666
14 1,457
69 1,162 134
1,341 1355 14
133
14 138
343 356 1,005
691
162 132
12246 13 13 13 9 1,043
643 909
596 773 709
156 194 262
107
Q3 2018 Q4 2018 Q1 2019 Q2 2019 Q3 2019 Q4 2019
DISCLAIMER: This is an initial version of the forecast, and may contain inaccuracies. These slides contain a conservative estimate for demand management between the three programs. As such, there may be future volumes not
yet financially committed or confirmed.
SOURCE: PEPFAR (USAID and CDC), Kenya, Government of South Africa, The Global Fund 19Forecast at mid-July
EFV 600 – Consolidated Demand Forecast Outlook
Overall ARV Demand Outlook
Q3 2018-Q4 2019, Number of packs, thousands
PEPFAR ▪ Malawi ▪ Kenya
Kenya ▪ Tanzania ▪ Mozambique
Republic of South Africa ▪ Zimbabwe ▪ Nigeria
The Global Fund ▪ Ethiopia ▪ Uganda
▪ Zambia ▪ Cote d'Ivoire
1,432
39
1,011
442 636
12 802 13 68 13 13 9
309 31
440
156 161 86
938 36
437 33 519
457 103
170 94
41 34
Q3 2018 Q4 2018 Q1 2019 Q2 2019 Q3 2019 Q4 2019
DISCLAIMER: This is an initial version of the forecast, and may contain inaccuracies. These slides contain a conservative estimate for demand management between the three programs. As such, there may be future volumes not
yet financially committed or confirmed.
SOURCE: PEPFAR (USAID and CDC), Kenya, Government of South Africa, The Global Fund 20Forecast at mid-July
NVP 200 – Consolidated Demand Forecast Outlook
Overall ARV Demand Outlook
Q3 2018-Q4 2019, Number of packs, thousands
PEPFAR
Kenya ▪ Malawi ▪ Kenya
Republic of South Africa
▪ Tanzania ▪ Mozambique
▪ Zimbabwe ▪ Nigeria
The Global Fund
▪ Ethiopia ▪ Uganda
▪ Zambia ▪ Cote d'Ivoire
610
765
99
7
391
351 105
470 7
25 88
12 13 13 13 9 17 14
74
74 245 410 53
353
7 7
122 48 19 24 16
81
6
Q3 2018 Q4 2018 Q1 2019 Q2 2019 Q3 2019 Q4 2019
DISCLAIMER: This is an initial version of the forecast, and may contain inaccuracies. These slides contain a conservative estimate for demand management between the three programs. As such, there may be future volumes not
yet financially committed or confirmed.
SOURCE: PEPFAR (USAID and CDC), Kenya, Government of South Africa, The Global Fund 21ARV FORECAST MEETING
AIDS 2018 CONFERENCE
Christine Malati, PharmD | July 23, 2018TLD TRANSITION & SUPPLY
PLAN UPDATEFirst Line
Routine ARVofFixed
Use TLDDose Combinations,
as First-Line ARTPEPFAR
Millions of Packs Ordered as of July 5, 2018* 2017: FDA approves TLD (Aug)
45
Millions
40 2016: DTG with TL or TE
recommended as
35
alt first line*
30
2013: EFV with TL or TE
25 recommended preferred
2010: TLE and LZN first line for patients
20
recommended starting ART*
2006:
15
Patients first line
10 transitioned
off d4T 40
5
0
2006 2007 2008 2009 2010 2011 2012 2013 2014 2015 2016 2017 2018
LSN LZN TEE TLE TLE400 TLD
WHO HIV Treatment Guidelines, 2006, 2010, 2013, 2016Routine Use of TLD as Second-Line ART Opportunity to simultaneously use TLD as second-line ART Weighing potential advantages of TLD over Protease Inhibitor (PI)-based second-line ART against potential concerns
Where does DTG currently stand in National Treatment
Guidelines?
DTG Rollout among Women Treatment Populations

Equity

Variation in definition of childbearing age

More nuanced approaches

Consistent contraception?
Concerns for Adolescents
   Countries That Do Not Include   Adolescent Age     CBA Range
    Adolescent Ages within CBA         Range
              Range

 Burundi                           10-18            15-49

 DRC                               10-19            14-49
 Ethiopia                          10-19            15-49

 Haiti                             10-14            15-49

 eSwatini                          10-19            18-49
 Uganda                            10-19            15-49
TLD Firm Orders
USAID|HQ, CDC, USAID|Kenya (2018–2019)
USAID CDC Kenya
10,000,000
9,000,000
8,000,000
7,000,000
6,000,000
5,000,000
4,000,000
3,000,000
2,000,000
1,000,000
-
18-Jun- 18-Jul- 18-Aug- 18-Sep- 18-Oct- 18-Nov- 18-Dec- 19-Jan- 19-Feb- 19-Mar- 19-Apr- 19-May- 19-Jun- 19-Jul- 19-Aug- 19-Sep- 19-Oct- 19-Nov- 19-Dec-LZN vs. TLE vs. TLD Consumption
July 2018 – July 2021
TLD Consumption TLE/TEE Consumption LNZ Consumption
18,000,000
Does not include: Cameroon, Kenya, Namibia, Lesotho, Botswana, South Africa
16,000,000
14,000,000
12,000,000
10,000,000
8,000,000
6,000,000
4,000,000
2,000,000
-Timeline for TLD Transition
Country 2019 2020 2021
J J A S O N D J F M A M J J A S O N D J F M A M J J A S O N D J F M A M J
Rwanda New Patients Only
Zambia
Nigeria
Uganda-JMS
Uganda-MAUL
Uganda-NMS
Haiti
Ukraine
eSwatini
Botswana
Mozambique
Tanzania
Malawi
Cote d'Ivoire New Patients Only
Burundi
DRC
Ethiopia
South Africa
Zimbabwe
Cameroon
Lesotho
Vietnam
South Sudan
NamibiaAs presented at
Timeline of South Africa Transition IAS: 21 July 2018
Dec 2017: Minister of Health and Cabinet announce DTG introduction will be in
April 2018
Jan 2018: Guidelines “finalised”
End Jan 2018: Clear above NOT possible with current tender processes
March 2018: SAHPRA refused to register ANY TLD combination
April 2018: Clarifying tender processes, working with SAHPRA
July 2018: New submissions of dossiers
July 2018: Tender planned release 17 August, close mid-Sept
April 2019 Introduction?
Thanks Francois VenterChanges in D4T, AZT & TDF use – often FAST
(2006-2012)
Between 2 to 4 million
people using AZT containing
regimen in 2012
2006 2007 2008 2009 2010 2011 2012
WHO AMDS database, 2014, (preliminary data)
Thanks Francois VenterSouth Africa possible scenarios post-NTD signal
Stay with TEE (or TLE) or go with DTG (with small number on TLE)
Or hybrid – messy, but may be only way forward
Implement observational cohorts urgently (see later)
Thanks Francois VenterOther Pharmaceutical Matters PEPFAR ARV and Pharmaceutical Formulations: Research, Regulatory, and Procurement Priorities
Other Pharmaceutical Matters Dolutegravir pediatric formulations Sulfamethoxazole/trimethoprim/isoniazid/pyridoxine
Thank You!
You can also read