API Industry Outlook First Quarter 2021 - R. Dean Foreman, Ph.D - American Petroleum Institute

Page created by Ronald Campos
 
CONTINUE READING
API Industry Outlook First Quarter 2021 - R. Dean Foreman, Ph.D - American Petroleum Institute
API Industry
Outlook
First Quarter 2021

R. Dean Foreman, Ph.D.
March 18, 2021
API Industry Outlook First Quarter 2021 - R. Dean Foreman, Ph.D - American Petroleum Institute
Key points                                                                                                                                    5-year range     Quarterly increase
                                                                                                                                                               Quarterly decrease
                                                                                                        U.S. petroleum
Strong global economic rebound broadly expected this year and in 2022                                      demand
                                                                                                          18.7 mb/d                                          Revenues
   o   Led by emerging markets, 3rd party consensus estimates for global real                                                                                 $486 B
       GDP growth have risen to 4.7% y/y in 2021 and 4.0% y/y in 2022

Record global oil demand growth could stretch supply – EIA projects
record two-year demand growth of +5.3 mb/d in 2021 and +3.8 mb/d in 2022 –
and new global highs by Q4 2022                                                       U.S. refinery                                                                        Net
                                                                                      throughput                                                                         income
   o   OPEC & Russia could redeploy 4.6 mb/d of capacity by Q4 2022 per EIA            14.4 mb/d                                         U.S. drilling
                                                                                                                                           activity                      $(15) B
   o   The U.S. could add 3.0 mb/d of liquids production for a record-high of 20.8                                                        311 rigs

       mb/d by Q4 2022 per EIA

Natural gas – Strong productivity helped sustain production despite
historically low drilling activity                                                                    U.S. oil & gas                                    Capital
   o   U.S. solid (regionally disparate) winter demand; record natural gas exports                     production                                    expenditures
                                                                                                      31.2 mb/doe                   Q4 2020 averages    $42 B
   o   Natural gas remains integral to planned U.S. power generation capacity                                                   Brent        $44.62/bbl
       additions, but global coal-fired power additions could outpace it                                                        WTI          $42.57/bbl
                                                                                                                                NGL composite $5.19/mmBtu
                                                                                                                                Henry Hub     $2.48/mmBtu

                                                                                 •  Financial compilation based on API 200 companies with shares listed on
                                                                                    U.S. stock exchanges.
                                                                                 sources: EIA; API Monthly Statistical Report; Bloomberg and company
                                                                                 reports; Baker Hughes; API Team analysis
API Industry Outlook First Quarter 2021 - R. Dean Foreman, Ph.D - American Petroleum Institute
Industry capital expenditures remained historically low in Q4 2020, and the
backlog of U.S. projects under construction has fallen by $50 billion y/y
      The industry invested $42.1 billion in Q4 2020, compared with $70.5 billion in the same quarter one year ago
      Across the energy value chain, API is monitoring 77 oil & gas-related projects currently under construction worth $194 billion

Capital expenditures by industry segment                                                    $194 billion in current U.S. energy
Billion dollars (2021$)
                                                                                            infrastructure investments
140

120
              Downstream and Petrochemcial
              Equipment & Services
                                                                 Midstream
                                                                 Global integrated
                                                                                                                 194 billion
                                                                                                           in estimated industry projects
              Upstream                                                                        7 LNG
                                                                                              $84 B        under construction (February 2021,
100                                                                                                        down from $344 billion in Q1 2020)

 80
                                                                                                         23        17 Refinery             21
 60                                                                                                   PetChem      expansions           Pipelines
                                                                                                       $69 B         $18 B                $23 B
 40

 20                                                                                            9 Gas
                                                                                              storage                        sources: S&P Market Intelligence; Oil &
  0                                                                                           $119 M                         Gas Journal; American Chemistry Council;
                                                                                                                             API Team calculations as of Feb. 2021
   2008                     2011                     2014              2017          2020
   * All other oil & gas industry companies
   sources: Bloomberg; publicly-available company reports; BLS
API Industry Outlook First Quarter 2021 - R. Dean Foreman, Ph.D - American Petroleum Institute
Global
Economy
API Industry Outlook First Quarter 2021 - R. Dean Foreman, Ph.D - American Petroleum Institute
Global real GDP outlook                                                    Real GDP growth (percentage points, year-on-year)
                                                                                    World                         OECD                 Non-OECD
                                                                           6
 Led by emerging markets,    3rd
                               party consensus estimates are               3                                                                          Avg.
 for global real GDP growth of 4.7% y/y in 2021 and 4.0% y/y               0                                                                       2000-2020
 in 2022                                                                  -3
                                                                          -6                             2019     2020   2021   2022

                                                     Europe       Russia / Caspian                                   Every region is expected to grow in 2021
                                                                5
                                                5               0                                                    and 2022, but China and the rest of
                                                0              -5                China                               Developing Asia Pacific economies have
         5    U.S.                             -5                                                      Dev. AP
                                                            Middle East 10
                                                                                                       ex-China      remained on a greater scale with relatively
         0                                              5                      5
                                           Africa       0                                         10                 mild 2020 recessions and strong resumed
         -5                            5                                       0                   5
                      Latin America                    -5                                                            growth
                      & Caribbean      0                                                           0
                                      -5                                                          -5                 China could overtake the U.S. as the
                      5
                      0                                                                                              world’s largest economy by 2028 per
                     -5                                                                                              Bloomberg

                                             sources: IMF; Bloomberg   * Market exchange rate basis
API Industry Outlook First Quarter 2021 - R. Dean Foreman, Ph.D - American Petroleum Institute
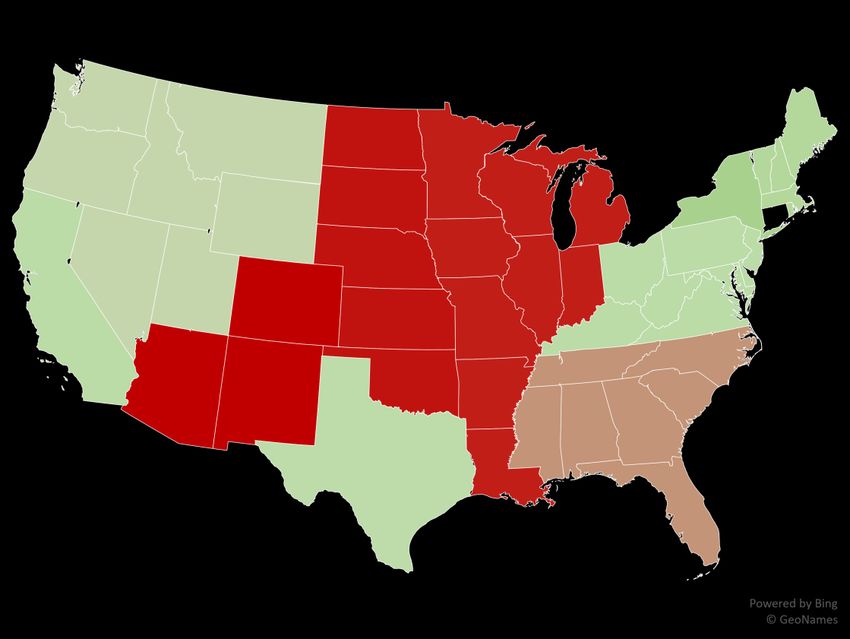
Recent U.S. dollar depreciation has correlated with increased oil prices
      Global oil prices have historically been inversely correlated with the U.S. dollar’s broad foreign exchange value
      Three quarters after the onset of the Great Financial Crisis in 2008, the U.S. dollar appreciated, and oil prices fell. By
      contrast with the 2020 COVID-19 recession, the U.S. dollar depreciated, and oil prices rose

Two perspectives on Brent crude oil spot prices and the U.S. dollar’s foreign exchange value
Index (Jan 2006=100)                          Dollars per barrel (2021$)                      Dollars per barrel (2021$)
130                       FRB broad nominal dollar index            160                       175       Q2 2008
                          Real Brent crude oil spot price                     140             150
120
                                                                              120
                                                                                              125
110                                                                           100
                                                                                              100
                                                                              80                                                 Q1 2009   Q1 2021
100                                                                                             75
                                                                              60
                                                                              40                50
 90
                                                                              20                25
                                                                                                                                                 Q2 2020
 80                                                                           0                  0
   2006     2008       2010   2012   2014    2016      2018       2020                               80      85  90     95 100 105 110 115 120              125
                                                                                                               Nominal dollar broad index (Jan. 2006=100)

                                                    sources: Federal Reserve Board; Bloomberg; U.S. Bureau of Labor Statistics
API Industry Outlook First Quarter 2021 - R. Dean Foreman, Ph.D - American Petroleum Institute
What we’re watching now
                  Although uncertainties on the path of global recovery remain, natural gas and oil demand is generally expected to be led by
                  emerging markets. Central Bank Digital Currencies may present a credible thread to the U.S. dollar’s global status

Policy Support and Vaccines                          Ready, steady, go? Results of the 3rd                                  Oil Market Report, February 2021
Expected to Lift Activity                            BIS survey on central bank digital currency

• A stronger starting point for the 2021-2022         • The Bahamas launched the first “live” CBDC in                       • IEA expects world oil demand growth of 5.4
forecast with vaccinations and adapted activities     Q1 2021, and central banks collectively                               mb/d in 2021 with a more favorable economic
                                                      representing a fifth of the world’s population are                    outlook and stronger oil demand in the second
• Softening in early 2021 is expected to give way     likely to issue a central bank digital currency                       half of the year
to rising momentum beginning in Q2 2021               (CBDC) in the next three years --- a transparent
                                                      and stable version of blockchain-based                                • Global oil supply rose by 0.6 mb/d in January
• Fiscal policy support set to boost activity in                                                                            and was set to fall in February as Saudi Arabia cut
some countries, but most are expected to              cryptocurrency
experience lower deficits in 2021                     • In emerging market and developing economies,                        • Global implied stock draws rose 2.24 mb/d in
                                                      financial inclusion and payments efficiency                           4Q20 from 1.56 mb/d in 3Q20, and IEA expects
• Supportive financial conditions. Major central                                                                            higher stock draws over the second half of 2021
banks are assumed to maintain their current           objectives motivate the shift towards CBDCs
                                                                                                                            International Energy Agency, February 2021
policy rate settings throughout the forecast
horizon to the end of 2022                            C. Boar and A. Wehrli, Bank of International Settlements, Jan. 2021

International Monetary Fund, January 2021
Oil Markets
Global oil demand recovery in 2021 and 2022 could become the largest two-
year increase on record since 1950
 EIA projects global oil demand was 96.7 mb/d in February - within 1.0% of its February 2020 level of 97.7 mb/d – and could rise by a total of 9.1
 mb/d this and next year (5.3 mb/d in 2021 and 3.8 mb/d in 2022)

          Global oil demand
          Million barrels per day
          120
                                                                                                                                           EIA estimates
          100                                                 Double-dip recession,
                                                              front-wheel drive and                                                              2022
                                                                 CAFE standards                                                                2021
           80                                                      (1980-1982)                                                          2020
                                                                                                                Great Financial       COVID-19
           60                                                                                                  Crisis (2008-2009)     recession

           40

           20

             0
                 1950               1960          1970            1980               1990            2000             2010              2020
                   *Market exchange rate basis                    Real GDP (Trillion 2010$)
                   sources: IEA; EIA; Bloomberg
Global oil demand could set a new record-high by the end of 2022 per EIA
  EIA projects global oil demand of 102.4 mb/d in Q4 2022, with similar increases (Q1 2021 to Q4 2022) by developed (+3.4 mb/d) and emerging
  economies (+3.9 mb/d)
  For global supply by Q4 2022, EIA projects OPEC and Russian & Caspian producers to redeploy 4.7 mb/d of spare capacity, while U.S. production
  could rise by 1.7 mb/d by Q4 2021 and add another 1.4 mb/d to reach a new high for U.S. liquids production of 20.8 mb/d in Q4 2022

Global oil demand                                       EIA                            Global oil supply                                 EIA
Million barrels per day                              estimates                         Million barrels per day
                                                                                                                                      estimates
100                                                                                    100
                                                                                                    Russia & Caspian

 75                       Non-OECD                                                       75
                          (Emerging economies)                                                       OPEC

 50                                                                                      50
                                                                                                     United States
 25                       OECD                                                           25
                          (Developed economies)                                                      Other Non-OPEC
  0                                                                                       0
      2016   2017   2018      2019     2020       2021   2022                                 2016   2017   2018     2019   2020   2021   2022

                                                                 source: EIA STEO (March 2021)
Strong sustained U.S. oil well productivity has kept downward pressure
     on estimated breakeven prices
           EIA reported solid well productivity even as companies have begun to re-deploy rigs and crews that were idled
           BTU Analytics estimated breakeven prices were below recent market prices among major U.S. oil producing basins

U.S. oil well productivity – new production per rig                              Oil estimated breakeven prices*
Million barrels per day oil-equivalent                                                                              Dollars per barrel ($/Bbl.)
4                                                                                                          0            20          40           60
                                                                                                                                                WTI month-ahead
                          Bakken                      Permian                                                                                             futures price
                                                                                                Bakken         Feb. 2021
                          Eagle Ford                  DJ Niobrara                                              Feb. 2020                                  Mar. 16, 2021
3
                                                                                  Eagle Ford - West

2                                                                                  Eagle Ford - East

                                                                                          DJ Niobrara
1
                                                                                 Permian - Delaware

0                                                                                 Permian - Midland
    2016             2017               2018   2019        2020     2021
                                                                                 *Half cycle breakevens assuming 10% discount factor. sources: BTU Analytics; CME Group
 source: EIA Drilling Productivity Report
EIA projects U.S. liquid fuels consumption could return to its 2019 levels by
the second half of 2021
     Indicators of industrial and chemical production, daily flights and mobility statistics, and vehicle miles traveled tracking show broad recovery from
     Q2 2020 lows, but ongoing year-on-year declines as of Q1 2021
     EIA projects Q2 2021 total consumption for refined products to reach that of pre-COVID levels, with the strongest recoveries in motor and jet fuels

Refined product key U.S. demand indicators, As of March 2021 YoY                                         U.S. liquid fuel consumption by fuel
                                                                                                         Million barrels per day
                                                                                                         25
                                                                                                                                                       EIA estimates

                                                                                                         20
                                                                                                                      Other (naphtha/gasoil; HGLs)
Passenger VMT                  Truck VMT                    Total Flights                Manufacturing
                                                                                                                      Residual fuel oil
                                                                                                         15
-10% +6% -13% +20%                                                                                       10
                                                                                                                      Jet fuel

                                                                                                                      Distillates/diesel fuel
Apple Mobility               DAT Spot Loads                 TSA Passengers                   Chemicals

+5% +72% -56% +3%                                                                                         5          Motor gasoline

                                                                                                          0
 source: U.S. Federal Highway Administration; FlightRadar24; ISM PMI; ACC; TSA; Apple; DAT                    2016                 2018         2020      2022
                                                                                                           sources: EIA; API MSR
U.S. refinery capacity utilization could recover gradually, but U.S. crude oil
trade is projected to revert to net imports in Q2 2021 per EIA
  EIA expects refinery capacity, domestic demand and refined product exports to re-strengthen over the next year, but lower U.S. drilling and
  production could set back U.S. crude oil exports

 U.S. liquid fuel consumption and refinery throughput                                 U.S. petroleum net trade
                                    Refinery crude                                    Million barrels per day
 Million barrels per day            distillation unit                    %
                                 capacity utilization                                 6                                               EIA estimates
 25                                                        EIA estimates 100
                                                 rate                                 4          Refined products
 20                                                                                   2
                                                                        75                                                                        Net exports
                                                                                      0
 15                                                                                              Total petroleum                                  Net imports
                                                                        50           -2
 10           U.S. liquid fuel
           Total U.S. liquid fuel                                                    -4
              consumption
           consumption                                                  25           -6
  5
                                                                                     -8
                                                                                                 Crude oil
  0                                                                     0           -10
      2016      2017      2018   2019      2020     2021     2022                         2016    2017         2018   2019   2020   2021   2022
      sources: EIA; API MSR                                                            sources: EIA; API MSR
Natural Gas
Natural gas market recovery in Asia Pacific and Europe has keyed record trade
and U.S. liquefied natural gas (LNG) exports
         Asia and Europe have consistently led in LNG imports, while the U.S. has emerged as an exporter with new infrastructure
         Following weakness in mid-2020, robust global growth LNG trade and record U.S. exports appeared in Q1 2021

                                                               Dutch
                                                                 TTF
                                                          UK NBP
                                                                                                  Japan
                                              Henry Hub                                           Korea
                                                                                                 Marker

Regional gas hub pricing                                                                                  Global LNG trade by region
$2021 per mmBtu, monthly                                                                                  Billion cubic meters
16         UK Benchmark (NBP)                                                                             600
                                                                                                                 Asia Pacific        Europe         North Am       Latin Am   Middle East
           Dutch Benchmark (TTF)
14         Asian Benchmark (JKM)                                                                          400

                                                                          Q1 Asian cold snap

                                                                                                                                                                                            Imports
           Henry Hub
12
                                                                                                          200
10
 8                                                                                                          0

                                                                                                                                                                                            Exports
 6
                                                                                                          -200
 4
 2                                                                                                        -400

 0                                                                                                        -600
     2016             2017             2018    2019                2020                        2021                2016          2017           2018          2019     2020      2021
     sources: Bloomberg; Quandl; EIA                                                                              sources: API Team analysis; BP; IEA; ICIS; EIA
Recent natural gas futures prices have exceeded estimated breakeven
prices among top producing regions
 Dedicated drilling for dry gas sustained solid productivity gains per EIA
 Estimated natural gas breakeven prices moved in different directions by producing region but generally remained below
 recent natural gas futures prices

        Natural gas well productivity –production per rig                      Natural gas estimated breakeven prices
                                                                                                            Dollars per million Btu (mmBtu)
        Million cubic feet per day nat. gas-equivalent                                                      0           1          2        3
        35
                                                                                                                      Feb 2021
        30                                                                                 Haynesville
                                                                                                                      Feb. 2020
        25                                    Appalachia
        20                                                                   Appalachia - Northeast PA
        15
                                             Haynesville
        10                                                                   Appalachia - Southwest PA
         5
                                                                                                                                     Henry Hub month-
         0                                                                           Appalachia - Ohio                               ahead futures price
             2016      2017            2018            2019    2020   2021                                                             Mar. 16, 2021

                    source: EIA Drilling Productivity Report
                                                                                           *Half cycle breakevens assuming 10%
                                                                                           discount factor and play-specific costs
                                                                                           sources: BTU Analytics; CME Group
U.S. natural gas exports could grow while supply and demand recede from 2019
highs per EIA, despite cold winter seasonality
  Q1 2021 brought a polar vortex and polarizing effects on gas demand for power by region, with large gains/losses as power competed with other fuels
  COVID-driven 2020 declines in demand and dry gas production could be extend into 2021 before broadly recovering per EIA

U.S. power sector gas consumption                                                        U.S. natural gas consumption and production
Year-to-date through March 1st, y/y%                                                     by sector, Trillion cubic feet
                                                                   ISO-NE
                                                                    +9.7%                40 Dry natural gas                 EIA estimates
                                                                                               production
                                                          ISO-NY
     Northwest                                            +17.3%
                                 SWP                                                           Net Exports
       -3.8%                                                                             30
                                -21.5%
                                             MISO                                                Electric
                                                            PJM                                  Power
CAISO                                       -20.5%
                                                           +4.2%                         20
+4.2%
           Southwest                                                                            Industrial
            -23.2%                                   Southeast
                                                       -9.8%                             10
                                ERCOT
                                +2.7%                                                             Res /
                                                                                                 Comm
                                                                                          0
                                                                                                  2020            2021      2022          2023          2024
   sources: EIA Hourly Grid Monitor; FERC                                                         sources: EIA AEO 2021
While the U.S. is poised to add 190 GW of gas and renewable power through
2024, global coal capacity is expected to increase by over 200 GW
 Natural gas has remained competitive in the mix of U.S. electricity capacity additions with a 30% share through 2024
 By comparison, 209 GW of added coal capacity could come online by 2024 in emerging per the Global Energy Monitor estimates

Global coal capacity additions vs. U.S. net generation capacity changes
Gigawatts
80                              Indonesia               Coal           Natural Gas   Wind & Solar   Other     Additions
                                Other                                                                                         Global coal additions by 2024
60

                                 India
                                                                                                                                +209 GW
40

20                               China

 0
                                                                                                                            U.S. natural gas and renewables
-20

                                                                                                              Retirements
                                                                                                                                 +190 GW
-40
        2020                          2021                           2022            2023              2024
        sources: Global Energy Monitor; IEA WEO 2020; EIA AEO 2021
        Projects listed as under construction or permitted
API economics resources available at www.api.org
You can also read