Siltronic Roadshow Presentation - May / June 2018 - Siltronic AG
←
→
Page content transcription
If your browser does not render page correctly, please read the page content below
Siltronic Roadshow Presentation

May / June 2018

                                  © Siltronic AG 2018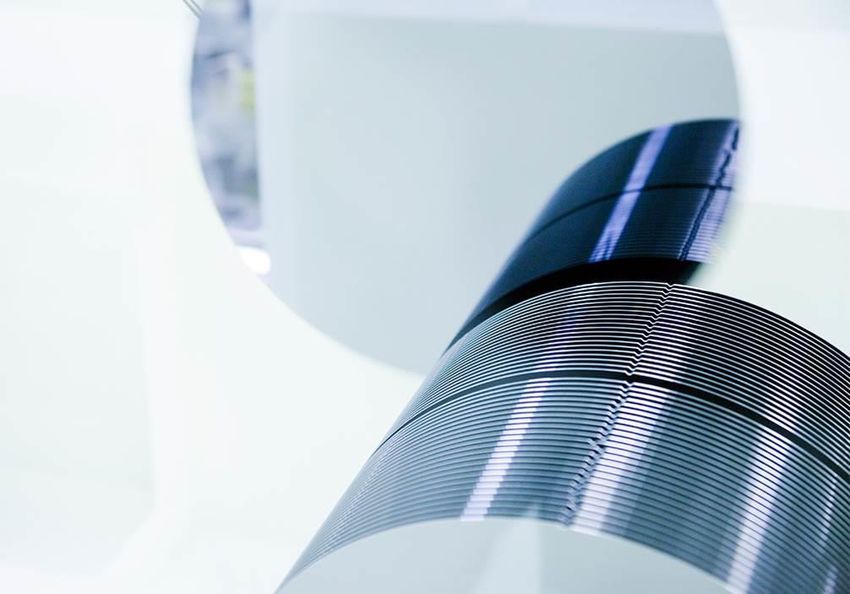
Financials improved strongly over the last years

        Adjusted1 financial                                                                                                                                  Q1 /
        figures (EUR million)
                                                            2013               2014                2015               2016              2017
                                                                                                                                                            2018

        Sales                                              875.5              853.4               931.3              933.4          1.177,3                 327.4

        EBIT                                              (87.3)              (31.6)                  2.7              27.0            235.7                 96.6

        EBIT margin in %                                  (10.0)                (3.7)                 0.3                2.9             20.0                29.5

        EBITDA                                             112.6               117.7              124.0              146.0             353.1                122.3

        EBITDA margin in %                                   12.9               13.8                13.3               15.6              30.0                37.4

        CapEx                                                39.7               40.7                75.0               88.8            123.2                 33.4

        Free cash flow              2                        64.7               86.3                37.4               19.0            169.6                     -

        Net cash flow 2                                            -                   -                  -            39.6            124.8                112.4
1   Figures 2013-2014 adjusted for consolidation effects resulting from acquisition of SSW and restructuring
2   Starting 2018, Siltronic will be reporting the key figure „net cash flow“ instead of „free cash flow“. Net cash flow represents free cash flow without the time shifts
    created by inflow and return of customer prepayments which, due to the size, impairs the meaningfulness of free cash flow.

                    Siltronic Roadshow Presentation                                                                                   ® Siltronic AG 2018
                    May / June 2018
                                                                                                                                                                       2 of 34
Increasing FX exposure due to higher margins
FX exposure
USD exposure 2018
100%
hedging ratio approx. 40%
EUR
EBITDA excl. profit
JPY roughly
1/4 hedging ratio approx. 75%
100%
JPY exposure 2018
hedging ratio approx. 30%
EUR roughly
2/3
excl. profit
USD roughly
2/3 hedging ratio approx. 50%
JPY
SGD
USD
Sales Costs
2018e 2018e
Siltronic Roadshow Presentation ® Siltronic AG 2018
May / June 2018
3 of 34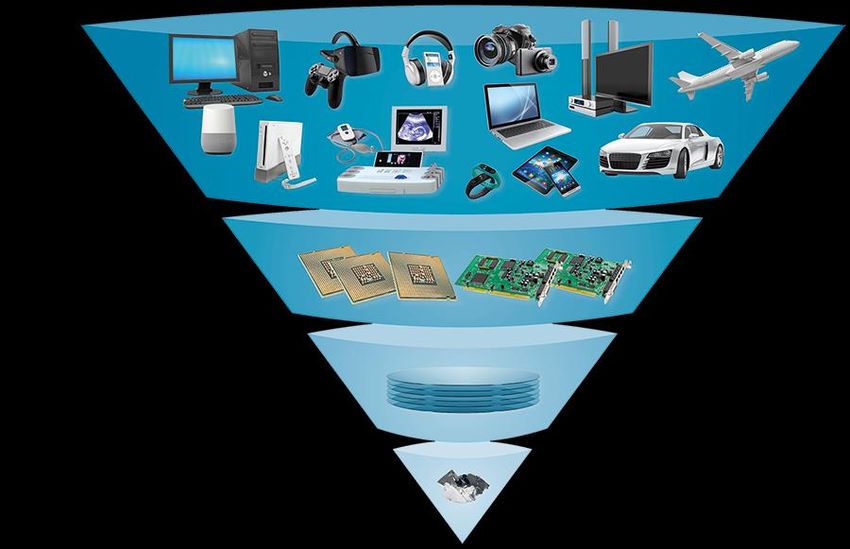
At FX rates (1.25/135) negative impact on sales by approx. EUR
100m and on EBITDA by approx. EUR 60m

Chance USD, in EUR million                      Change JPY, in EUR million

1 ct     ~ EUR 7.5m sales                       1 JPY     ~ EUR 2m sales

         ~ EUR 6.5m gross margin                          ~ EUR 2m gross margin

         ~ EUR 4.5m EBITDA after hedging                  ~ EUR 1m EBITDA after hedging

        2017                          2018e             2017               2018e
         1.13                            1.25           127                  135

         ~ EUR -90m sales                                 ~ EUR -17m sales

         ~ EUR -55m EBITDA                                ~ EUR -10m EBITDA

           Siltronic Roadshow Presentation                             ® Siltronic AG 2018
           May / June 2018
                                                                                             4 of 34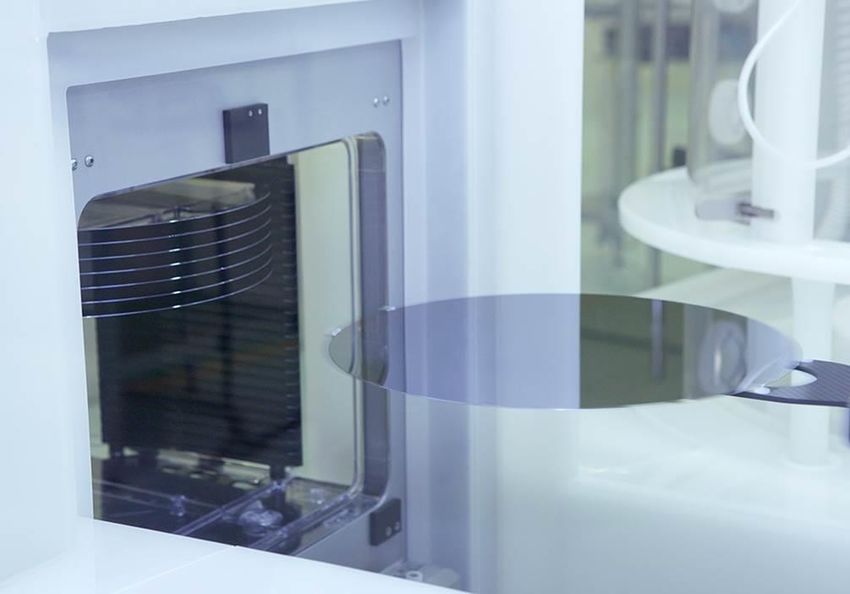
MARKET UPDATE

                © Siltronic AG 2018
IHS Markit forecasts 5.4% growth for silicon area in 2018 with
broad based growth in a wide range of applications.

 Wafer demand 2000 / 2017, in bn cm²

                                              2000           2017                               Growth 2018 / 2017, in %
               Total Market                     33.6         72.5                                                  5.4%

           Mobile / Smartphones                       2.5                               19.2                                     7%

  Desktop, Notebook & Server PC         9.4                                      11.3                            -2%

                        Industrial              5.6                        8.9                                                   9%

               Solid-State Drives                                    6.8                                                                      21%

                      Automotive                       2.1           6.5                                                      6%

    Switches, Hubs, Modems etc                    3.6          4.1                                                          3%

   Appliances, Video Players etc.               4.8            3.8                                                          2%

     Media Tablets & Tablet PCs                               2.7                                       -11%

        Mobile Infrastructure etc.                    2.6    2.5                                               -4%

                        LCD TVs                              2.1                                                                             19%

                          Others                      2.9          4.6                                          -2%

                                                                   Source: IHS Markit Technology (Semiconductor Silicon Demand Forecast Tool, Q2‘18 Update)

              Siltronic Roadshow Presentation                                                                          ® Siltronic AG 2018
              May / June 2018
                                                                                                                                                    6 of 34
FINANCIALS Q1 / 2017

                       © Siltronic AG 2018
Q1 sales on high Q4 level despite headwind from USD
Sales, in EUR million
Comments
Positive
308.1
328.1 327.4 Sales volume on very high
level relatively stable q-o-q
283.1
258.0 Significant ASP increase y-o-y
Slight ASP increase q-o-q
Further ASP increases in 2018
Negative
Headwind from USD
Q1 2017 Q2 2017 Q3 2017 Q4 2017 Q1 2018
Siltronic Roadshow Presentation ® Siltronic AG 2018
May / June 2018
8 of 34EBITDA and EBITDA-margin also on high Q4 level
EBITDA margin in %; EBITDA in EUR million
Comments
Positive
36.8 37.4 Significantly higher ASP
34.6 y-o-y
Further price increases
q-o-q
25.7
Cost of sales per wafer area
20.5 slightly decreased
120.9 122.3
106.5
Negative
72.7
53.0 Headwind from USD
Q1 2017 Q2 2017 Q3 2017 Q4 2017 Q1 2018
Siltronic Roadshow Presentation ® Siltronic AG 2018
May / June 2018
9 of 34Net profit increased further
Result and income tax, in EUR million
Comments
-12.3
Net profit of EUR 82.0m
-15.2 in Q1/2018
Main reason: lower
depreciation
EUR 18.7m expenses for
effective taxes in Q1/2018
94.3
89.1
82.0 EUR 6.4m income from
73.9 deferred tax assets (one-
time effect in Q1)
Q4/2017 Q1/2018
Result before income tax Income tax Result for the period
Siltronic Roadshow Presentation ® Siltronic AG 2018
May / June 2018
10 of 34Equity further improved, stable equity ratio of ~50%
Balance sheet, in EUR million
Mar 31, Dec 31, Comments Equity and Mar 31, Dec 31, Comments Mar
Assets
2018 2017 Mar 31, 2018 liabilities 2018 2017 31, 2018
Non-current 554.4 546.6 Equity 707.1 637.9
PP&E 518.2 513.3 Siltronic 703.1 637.3
22 intangibles
Other Samsung’s 22% in
Other fixed 36.2 33.3 (related to SSW) 4.0 0.6 SSW
2 hedging shareholders
Current 861.4 705.8 Liabilities 708.7 614.5
Inventories and Pension
156.4 149.9 380.7 367.2 Germany and US
contract assets provision
Trade 45 personnel related
172.5 159.9 Other provisions 72.2 54.6 (e.g. early retirement)
receivables
Trade liabilities 83.5 67.1
Other current 41.7 53.9 18 hedging Customer
106.6 69.8
prepayments
Cash and fixed 55 employee-related
490.8 342.1 Other 65.7 55.8 3 hedging
term deposits
Total
1,415.8 1,252.4 Total 1,415.8 1,252.4
Siltronic Roadshow Presentation ® Siltronic AG 2018
May / June 2018
11 of 34Fluctuations in pension provision due to interest rate
movements
Pension provision, in EUR million
371 381
367 Comments
345 341
Changes in interest rates
influence evaluation of
pension provision
Change in interest rates
directly reflected in equity
(OCI)
Q1 2017 Q2 Q3 Q4 Q1 2018
interest rates IFRS
USA 3.90% 3.65% 3.61% 3.45% 3.81%
Germany 2.07% 2.19% 2.21% 2.10% 2.02%
Siltronic Roadshow Presentation ® Siltronic AG 2018
May / June 2018
12 of 34Net financial assets on an all-time high in Q1 2018
Dividend payment of EUR 75m in April 2018
Net financial assets, in EUR million First dividend payment since IPO in 2015
Successful financial year 2017 leads to first
491 dividend payment since IPO
Dividend of EUR 2.50 per share approved by
the Annual General Meeting on April 19,
2018
342
295
241
209
Siltronic Roadshow Presentation ® Siltronic AG 2018
May / June 2018
13 of 34Capex 2018: EUR 240m to EUR 260m
Investment, in EUR million Comments
~240-260
~50-70 Capex of EUR ~140m for 70k wafers/month
over 2 years
Capex in 2018 includes new crystal pulling hall
in Singapore to create sufficient crystal pulling
capacity to further expand wafer capacity in
123 ~110 2020
~30 Due to long lead-times additional crystal pullers
already ordered
Capex base level to sustain business:
~90 MOB (maintenance of business)
54
~80
Capabilities
Cost reductions
Ø 2014-2016 2017 2018e Automation
Capex crystal pulling hall Capex for 70k/m.
Base Capex
Siltronic Roadshow Presentation ® Siltronic AG 2018
May / June 2018
14 of 34Increasing net cash flow generation boosted by net profit
Capex and NCF, in EUR million
Comments
Net cash flow of EUR 112.4m
as a result of improved net
profit
Customer prepayments of
EUR ~41m received in Q1
112.4 2018
Further prepayments
60.6 61.4 expected during the year
30.9 37.8 33.4
19.3 25.5
16.9
-4.5
Q1 2017 Q2 2017 Q3 2017 Q4 2017 Q1 2018
NCF Capex
Siltronic Roadshow Presentation ® Siltronic AG 2018
May / June 2018
15 of 34OUTLOOK
© Siltronic AG 2017Siltronic Outlook for 2018 (as of March 5, 2018), confirmed
EBITDA margin close to 40%
ROCE clearly higher than in 2017
Net cash flow clearly higher than in 2017
Sales clearly above EUR 1.3bn, depending on FX effects
R&D approx. 5% of sales
Cost position negative effect on savings potential due to tariff increases and inflation
assuming an EUR/USD exchange rate of 1.25 and an EUR/JPY exchange rate of 135 negative FX impact of
FX effects
approx. EUR 100m on sales and approx. EUR 60m on EBITDA
Depreciation approx. EUR 90m
Tax rate between 15% and 20%
Financial result relatively stable
CapEx approx. between EUR 240m and EUR 260m
Earnings per share significantly higher than in 2017
Siltronic Roadshow Presentation ® Siltronic AG 2018
May / June 2018
17 of 34Contact and Additional Information
Issuer and Contact Additional Information
Siltronic AG ISIN: DE000WAF3001
Hanns-Seidel-Platz 4 WKN: WAF300
D-81737 München Deutsche Börse: WAF
Listing: Frankfurt Stock Exchange
Investor Relations:
Prime Standard
Petra Mueller
email: petra.mueller@siltronic.com
Tel. +49 89 8564-3133
Financial Calendar
Q2 2018 Results July 25, 2018
Q3 2018 Results October 25, 2018
Siltronic Roadshow Presentation ® Siltronic AG 2018
May / June 2018
18 of 34APPENDIX
© Siltronic AG 2018Increasing demand for electronic devices and new applications
drive semiconductor growth, which in turn fuels silicon demand.
Electronics Value Chain 2017
Electronics
USD 1,504 bn
Semiconductors
USD 400 bn
Semiconductors silicon wafers
USD 8.7 bn
Silicon for electronic applications
USD 1.1 bn
Source: Electronics (IC Insights), Semiconductors (WSTS, only silicon-based), Silicon wafers (SEMI SMG), Electronic applications (estimate)
Siltronic Roadshow Presentation ® Siltronic AG 2018
May / June 2018
20 of 34Siltronic is a strong wafer supplier with leading-edge technology
Top 5 wafer producers serve more than 90% of market across all diameters
10%
18%
15%
27%
30%
SK Siltron Siltronic Shin Etsu Sumco GlobalWafers
Sources: reported company revenues FY 2017, converted to USD million
Siltronic Roadshow Presentation ® Siltronic AG 2018
May / June 2018
21 of 34Siltronic is focused on growing 300 mm and attractive 200 mm
business.
Development of total wafer demand per diameter, in mn 300 mm equivalents per month
Strong
7 demand
300 mm 200 mm SD &
6 growth
5
4
3 Stable &
attractive
2
1
Mid-term
decline
0
2010 2011 2012 2013 2014 2015 2016 2017 2018
Source: SEMI up to Mar 2018
Siltronic Roadshow Presentation ® Siltronic AG 2018
May / June 2018
22 of 34Customer base well diversified across all major semiconductor
silicon wafer consumers
Siltronic is a supplier to all top 20 Silicon wafer consumers
Siltronic well positioned at all Top 10 customers represent ~73%
major Silicon consumers of 2017 revenues
Source: Company Information, Siltronic
Siltronic Roadshow Presentation ® Siltronic AG 2018
May / June 2018
23 of 34International manufacturing network supports
market leadership and business focus
Freiberg CP* 300 mm
Germany
Portland 200 mm
United States
Burghausen CP* 300 mm SD*
► Central R&D hub in Burghausen
► High volume facilities for 300 mm
in Germany and Singapore
► Among world’s newest & largest SSW CP* 300 mm SSP 200 mm
fabs in Singapore
Singapore
*CP = Crystal Pulling | *SD = 150 mm and smaller
Siltronic Roadshow Presentation ® Siltronic AG 2018
May / June 2018
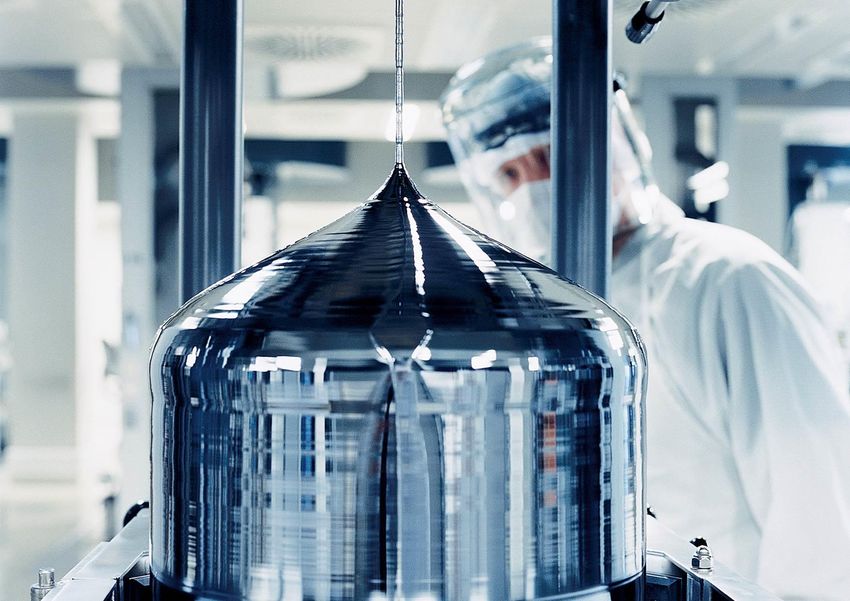
24 of 34Continuous improvement of key ingot and wafer properties to
meet customers‘ requirements
Ingot Wafer
doping level
mechanical stability edge flatness
flatness
purity uniformity
resistivity
surface cleanliness
oxygen content shape
homogeneity
Siltronic Roadshow Presentation ® Siltronic AG 2018
May / June 2018
25 of 34Semiconductor Revenue vs Silicon Area and Silicon Revenue.
Semiconductor vs Silicon Revenue and Silicon Area
350%
Silicon area
300%
Semic. revenue
As % of Q1 1996
250% Silicon revenue
200%
150%
100%
50%
0%
96
97
98
99
00
01
02
03
04
05
06
07
08
09
10
11
12
13
14
15
16
17
Source: WSTS and SEMI up to Q4 2017
Siltronic Roadshow Presentation ® Siltronic AG 2018
May / June 2018
26 of 34Silicon area demand continues to grow
Silicon wafer demand, in bn in2 +5%
+10%
12.4e
11.8
10.7
10.4
10.1
9.4
9.0 9.0 9.1
2010 2011 2012 2013 2014 2015 2016 2017 2018
Source: SEMI (Silicon Area until 2017), IHS Markit Technology (Semiconductor Silicon Demand Forecast Tool, Q2’18 Update, Estimate 2018
Siltronic Roadshow Presentation ® Siltronic AG 2018
May / June 2018
27 of 34Silicon demand for industrial and automotive applications is
expected to grow stronger in the next years.
Silicon demand for main wafer consuming applications, bn cm² and CAGR
Computing 3%
3% Mobile Phones
7% 24 27 2%
4% 24 3% 20 2% 21
4% 20 10% 18 3% 20
17 20 10% 18
17 13
13
2013 2016 2019 2022 2013 2016 2019 2022
Industrial Automotive
6%
6% 13
11% 6%
5%
5% 11 11
11 9% 7%
7%
8 8% 9% 7 9
7 % 6
5
2013 2016 2019 2022 2013 2016 2019 2022
Source: IHS Markit Technology (Q2’18 Update) Note: Mobile phones: Smart & Feature phones; Computing: Desktop, Notebook & Server
PC & periphery, Tablets, SSD & DRAM
Siltronic Roadshow Presentation ® Siltronic AG 2018
May / June 2018
28 of 34Within a car, most silicon is used for powertrain, infotainment
and safety.
300 mm demand in automotive, in %
Other
Automotive
Powertrain
Chassis &
Safety (incl.
ADAS)
Infotainment
and
Connectivity
Body &
Convenience
300 mm 200 mm SD
1 ADAS = advanced driver assistance system Source: IHS Markit Technology (Q1 2018 Update)
Siltronic Roadshow Presentation ® Siltronic AG 2018
May / June 2018
29 of 34Silicon demand for NAND driven by growing demand for solid-
state drives and increasing storage in smartphones.
NAND silicon area demand by applications, bn cm² p.a.
20
16
12
8
4
0
2014 2016 2018 2020 2022
Solid-State Drives Smartphones Memory Cards Tablet Computers Others
Source: IHS Markit Technology (Semiconductor Silicon Demand Forecast Tool, Q2‘18 Update)
Siltronic Roadshow Presentation ® Siltronic AG 2018
May / June 2018
30 of 34NAND is the growth engine in the memory sector.
Silicon area for DRAM only shows moderate growth.
Split of memory silicon area market by DRAM and NAND, bn cm² p.a.
40
30
20
10
0
2014 2016 2018 2020 2022
DRAM NAND
Source: IHS Markit Technology (Semiconductor Silicon Demand Forecast Tool, Q2‘18 Update)
Siltronic Roadshow Presentation ® Siltronic AG 2018
May / June 2018
31 of 34Silicon is needed to generate much more data, but even more
Silicon is needed to store, move and process ever more data
160 The number of networked devices will grow
Annual data creation from ~17 billion in 2016 to ~27 billion in 2021
120
430 kilometers
By 2020, data centers are expected to have
Zetabyte
1.84 Zetabytes of storage: If SSDs for this
80 were stacked, they would stretch 430 km high
-- the distance from Munich to Vienna
40
Strong increase in cloud storage will drive
0 300 mm silicon demand for memory as well
2010 2013 2016 2019 2022 2025 as high bandwidth communication
4
Annual global IP traffic With 24% CAGR, annual global IP traffic will
Zetabyte / year
3
reach 3.3 ZB per year by 2021:
2 It would take more than 5 million years to
watch the amount of video that will cross
1 global IP networks each month in 2021.
0 Infrastructure required to support this traffic
includes items like routers, switches, hubs,
2016
2017
2018
2019
2020
2021
5G and cell equipment
Source: Cisco VNI Forecast, IDC Data Age 2025 Study, Cisco Cloud Index (GCI), IHS, Siltronic Estimate
Siltronic Roadshow Presentation ® Siltronic AG 2018
May / June 2018
32 of 34Disclaimer
The information contained in this presentation is for background purposes only and is subject to
amendment, revision and updating. Certain statements contained in this presentation may be
statements of future expectations, future financial performance and other forward-looking statements
that are based on management's current views and assumptions and involve known and unknown risks
and uncertainties. In addition to statements which are forward-looking by reason of context, including
without limitation, statements referring to risk limitations, operational profitability, financial strength,
performance targets, profitable growth opportunities and risk adequate pricing, words such as "may”,
“will”, “should”, “expects”, “plans”, “intends”, “anticipates”, “believes”, “estimates”, “predicts”, “continue”,
“projects” or “seeks”, “potential”, “future”, or “further” and similar expressions may identify forward-
looking statements. By their nature, forward-looking statements involve a number of risks, uncertainties
and assumptions which could cause actual results or events to differ materially from those expressed or
implied by the forward-looking statements. These include, among other factors, changing business or
other market conditions, currency and interest fluctuations, introduction of competitive products, poor
acceptance of new products and services, change of the corporate strategy and the prospects for
growth anticipated by the management. These and other factors could adversely affect the outcome and
financial effects of the plans and events described herein. Statements contained in this presentation
regarding past trends or activities should not be taken as a representation that such trends or activities
will continue in the future. Siltronic AG does not undertake and does not intent to undertake any
obligation to update or revise any statements contained in this presentation, whether as a result of new
information, future events or otherwise. In particular, you should not place any reliance on forward-
looking statements which speak only as of the date of this presentation.
Siltronic Roadshow Presentation ® Siltronic AG 2018
May / June 2018
33 of 34SILTRONIC AG | Hanns-Seidel-Platz 4
81737 Munich
Germany
© Siltronic AG 2018You can also read