Bank of Åland Investor Presentation August 2021

 
CONTINUE READING
Bank of Åland Investor Presentation August 2021
Bank of Åland
                            Investor Presentation
                                August 2021

1     Vi går
    Going ourvår
              ownegen
                   wayväg
Bank of Åland Investor Presentation August 2021
Table of Contents

         1. Bank of Åland in Brief          3

         2. Strategy and Market Position    7

         3. Sustainability                 12

         4. Performance and Capital        15

         5. Asset Quality                  21
         6. Liquidity and Funding          23

         7. Contact Details                26
         8. Appendix                       28

2
Bank of Åland Investor Presentation August 2021
1. Bank of Åland in Brief

3
Bank of Åland Investor Presentation August 2021
Bank of Åland in Brief
                    •   Established in 1919 on the Åland Islands, listed since 1942 on NASDAQ OMX Helsinki
                    •   A Finnish bank targeting high net worth and affluent individuals
                    •   Operations on the Åland Islands, Finnish mainland and Sweden
    Bank of Åland   •   Top-ranked in customer loyalty
                    •   A long-standing tradition of stability and very low credit losses
        Plc         •   BBB rating with a positive outlook from S&P

                    • Create value for ambitious individuals and companies that appreciate relations:
                         • Private Banking since 1982
                         • IT services by Crosskey Banking Solutions since 2004
                         • Premium Banking since 2004
      The Vision         • Partnership Banking since 2016
                    • Delivering a large bank’s range of services with a small bank’s thoughtfulness and good sense
                    • Bank’s customer surveys show that also during the Covid-19 pandemic customers continue to
                      appreciate Bank’s expertise, personalized service, high ethical standards and sustainability work

                    • The Bank of Åland has been active in the covered bond market in SEK and EUR since 2012
                    • Two Cover Pools: Cover Pool SWE consists of 100 % Prime Swedish residential mortgages and Cover
                      Pool FIN consists of 100 % Finnish and the Åland Islands’ residential mortgages
                    • Clear concentration to the growth centres and the wealthiest parts of Sweden and Finland
    Covered Bonds   • Published commitment to a strong over-collateralization and six months liquidity
                    • AAA (stable) rating from S&P on both Cover Pool SWE and Cover Pool FIN

4
Bank of Åland Investor Presentation August 2021
Scorecard June 30, 2021

       Capital                                                   Liquidity and Funding

       • Strong capital position                                 •   Loan/ deposit ratio of 119 %
       • Standardised approach used in Sweden                    •   Liquidity reserve at 19 % of total assets
       • Dividends for 2019 and 2020 EUR 31.2 M approved         •   LCR at 152 %
         and distributed under H1 2021, subtracted from the      •   NSFR at 110 %
         Bank’s CET1 capital ratio on December 31, 2020          •   BBB bank rating with positive outlook

       Risk Management                                           Profitability

       • Long history of having the lowest loan loss level of    •   Positive earnings trend
         all Finnish banks. Loan loss level at 0.05 % in Q2      •   Challenging interest rate environment
         2021 (0.08 % in Q2 2020). EUR 2.0 M Covid-19            •   Net operating profit of EUR 13.6 M in Q2
         provision during 2020                                       2021 (EUR 9.8 M in Q2 2020)
       • No trading positions or complex financial               •   ROE 16.4 % in Q2 2021 (11.8 % in Q2
         instruments                                                 2020)
       • Strict limits on exposures to financial institutions.
         Bulk of the exposure is to highly rated Nordic
         entities

5
Bank of Åland Investor Presentation August 2021
Standard & Poor’s Rating on Bank of Åland
Finnish banks                                                      A-
                                                                                    S&P, December 15, 2020:
     Business position                                             -2               •   “We expect the joint venture will further diversify Bank of Åland's
         - Despite some geographic diversification, concentrated                        revenue base and give growth opportunities in Sweden”
         business focus on retail and Private Banking makes it
         vulnerable to cyclical swings in the segments                              S&P, January 22, 2021 and July 15, 2021:
     Capital and earnings                                          +1
                                                                                    •   ”We could raise the rating if Bank of Åland's capitalization
         - Strong capital position
                                                                                        improves, as indicated by a sustained increase of its RAC ratio
         - Strong earnings
                                                                                        beyond 15 % over the next 24 months, after the establishment of
     Risk position                                                 -1
                                                                                        the joint mortgage platform”
         - Small customer base with concentration risks
         - Moderate geographic diversity
                                                                                    S&P, July 15, 2021:
     Liquidity and funding                                          0
         - Stable core deposit base                                                 •   “Bank of Åland's RAC ratio may exceed our 15 % threshold for a
                                                                                        very strong capital and earnings assessment once the Swedish
The Bank of Åland standalone rating                                BBB   positive       mortgage loan book is carved out”
                                                                                    •   “Bank of Åland has delivered solid results over the past several
     Cover Pool FIN, Cover Pool SWE                                +9                   years and, in addition to issuing capital instruments, has
        - Very low credit losses and stable loan base                                   succeeded in building its capital base through earnings retention”
        - Commitment to strong over-collateralization                               •   “Once the Borgo platform is finalized and we have full data
        - Commitment to six months liquidity buffer                                     transparency, we will analyze whether the RAC ratio can
                                                                                        sustainably exceed 15 %”
The Bank of Åland Covered Bonds rating                             AAA   stable

6
Bank of Åland Investor Presentation August 2021
2 Strategy and Market Position

7
Bank of Åland Investor Presentation August 2021
Three Markets – Two Strategies
    The Åland Islands
           • 2 offices, market share > 50 %
           • Full product range offered
           • The Bank for everyone

    Finland
              • 6 offices in affluent parts of Finland, market share > 1 %
              • Full product range offered but “bread and butter” services only as
                complement to Private Banking and Premium Banking services
                offering
              • Targeted segment: High Net Worth/ Affluent Individuals and
                their companies

    Sweden
         • 3 offices in Sweden’s largest cities, market share < 1 %
         • Full product range offered but “bread and butter” services only as
           complement to Private Banking and Premium Banking services
           offering
         • Targeted segment: High Net Worth/ Affluent Individuals and
           their companies

8
Bank of Åland Investor Presentation August 2021
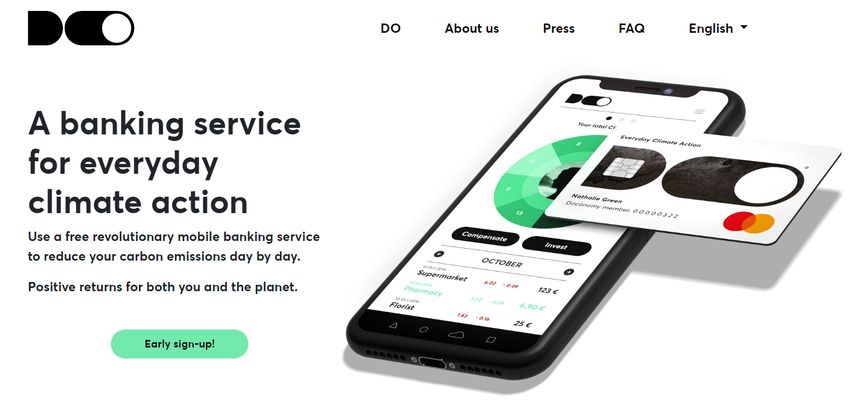
Bank of Åland History of Strategic Decisions

     From a local bank...
     Supporting development of the Åland                                                   2019
     Islands – a poor fishing and agrarian                                2016
     community                                              2009
                                             2004

                              1994
                                                                                          Extended
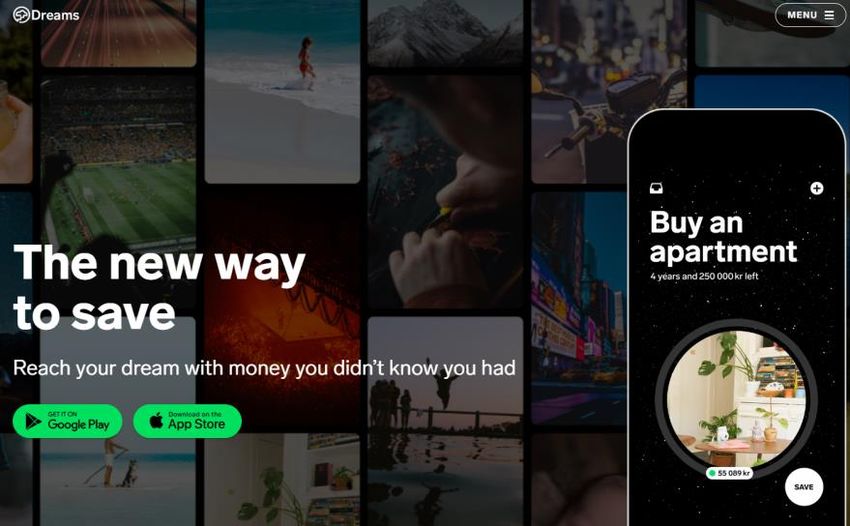
                                                                              Fintech     partnerships
                    1942                                       Expansion to   Dreams      New Swedish
                                                    IT company Sweden
                                                                                          mortgage bank
                                       Expansion    Crosskey                              with partners
            1919                                    Ab Ltd
                                       to Finnish
                             Listing
                                       mainland
                     Foundation                                               ...to a Nordic banking group
                                                                              With wide product range and personal
                                                                              service targeting High Net Worth Individuals

9
Bank of Åland Investor Presentation August 2021
Digitalization in Focus: Strategic Fintech Partners

10
Bank of Åland Group Legal and Ownership Structures
                                                                                                                                                          S-Crosskey Ab
                                                                                                                                                              60 %

                                                                                                            Crosskey Banking Solutions Abp Ltd
                                                                                                                         100 %

                                                                                                                                                           Model IT Oy
                                                                                                                                                             100 %
                                                                         Ålandsbanken Abp
                                                                         (Bank of Åland Plc)

                                                                                                                                                 Ålandsbanken Fonder Ab, 100 %
                                                                                                               Ålandsbanken Fondbolag Ab
                                                                                                                                                 Ålandsbanken Fonder II Ab, 100 %
                                                                                                                         100 %
                                                                                                                                                 Ålandsbanken Fonder III Ab, 100 %

     Major owners as of June 30, 2021                                Share of capital     Share of votes
     Wiklöf Anders with companies                                                21.3 %           29.7 %
     Alandia Insurance                                                            6.8 %           11.1 %
     The Family Kamprad Foundation                                                6.0 %             0.7 %
     Fennogens Investment S.A. (Family Ehrnrooth)                                 4.7 %             8.3 %
     Pensionsförsäkringsaktiebolaget Veritas                                      2.5 %             2.0 %
     Approximately 10,500 shareholders in total, half of them from the Åland Islands

11
3. Sustainability

12
Bank of Åland ”World Champion” in Sustainability

13
14
4. Performance and Capital

15
Long-Term Financial Targets*

                                            ROE shall exceed 10 %
                                            As a Bank for investors, with financing know-how, the Bank of Åland has a business model
        Profitability                       that shall generate most earnings from operations with limited capital requirements. The
                                            Bank of Åland’s earnings will benefit from higher interest rates

                                           The Bank’s capital adequacy, primarily defined as CET1 capital ratio
                                           under the Basel regulations, shall clearly exceed all regulatory
     Capitalization                        requirements

                                           The payout ratio shall amount to 50 %
                                           This payout ratio target is subject to the condition that the capital adequacy target
       Payout ratio                        continues to be achieved

* During 2021 the Bank of Åland will review its long-term financial targets

16
H1 2021 in Summary                                                                                Volumes, EUR M
                                                                               +40 %
                                                                                      8,541

                                                                              6,107                                                    +8 %
                                                                                                            +10 %
•    New record level of actively managed assets, lending and                                                                       4,188 4,518
                                                                                                          3,459 3,801

     deposits
•    A new office opened in Oulu on the Finnish mainland
                                                                        Actively managed assets             Deposits                 Lending
•    Dividends for 2019 and 2020 EUR 31.2 M (15.6 + 15.6)                                             2020       2021
     approved and distributed
                                                                                              Net operating profit, EUR M
•    In March 2021, for the first time the Bank of Åland issued              +14 %
                                                                                   84.6
     additional Tier 1 (AT1) capital instruments, totalling SEK 300 M       74.2

•    In March 2021 the Swedish Financial Supervisory Authority                                                                          +46 %

     granted Borgo, the new jointly owned mortgage company, a                                                                           16.7
                                                                                                                                               24.4
                                                                                                  +13 %             -88 %
     permit as a credit market company and an issuer of covered
                                                                                                                       -4.6 -0.6
                                                                             Income            Expenses             Loan losses    Net operating profit
     bonds. Sparbanken Syd wants to join as a fifth partner
•    Working hours re-calculated to full-time equivalent positions
                                                                                               -53.0
     increased by 81 FTE Q2 2021 vs. Q2 2020                                                        -59.7

                                                                                                       2020         2021

17
”Best Q2 2021 and H1 2021 results ever”
 • Net operating profit Q2, EUR 13.6 M (9.8 M), +39 %
 • ROE Q2, 16.4 % (11.8 %)
 • Net operating profit H1, EUR 24.4 M (16.7 M), +46 %
 • ROE H1, 14.4 % (10.1 %)
 • Earnings per share H1, EUR 1.27 (0.85), +50 %

  ROE %, 2019-2021                                                         ROE, Rolling 12 Months, %                                               Net Operating Profit, Rolling 12 Months, EUR M

18.0                                                                      14.0                                                             13.7    50.0                                                                47.4
                                                                   16.4
16.0                                                                                                                                                                                                            43.7
                                                                                                                                                   45.0
                                                     13.6                 13.0                                                      12.6                                                                 39.7
14.0                 12.3                                   12.5                                                                                                                                  36.5
                                                                                                                                                   40.0
              11.5          11.4         11.8 12.3                                                                                                                                  34.3
                                                                                                                                                                                           35.4
12.0                                                                      12.0                                               11.6                                            33.2
                                                                                                                                                   35.0               31.8
10.0
                                                                                                     10.7
                                                                                                            10.9 11.0 11.0                                29.6 29.9
                                   8.4                                    11.0                10.5                                                 30.0
  8.0   7.6
                                                                                 9.9   10.0                                                        25.0
  6.0                                                                     10.0
                                                                                                                                                   20.0
  4.0
                                                                           9.0                                                                     15.0
  2.0
  0.0                                                                      8.0                                                                     10.0

Stability fee: EUR 2.3 M (Q1 2019), EUR -0.5 M (Q2 2019), EUR 2.0 M (Q1 2020), EUR 0.6 M (Q2 2020), EUR 2.8 M (Q1 2021) and EUR -0.1 M (Q2 2021)

  18
Higher Income and Expenses
•        Total income rose by 14 % to EUR 84.6 M. Higher net commission income was the main reason
•        Total expenses increased by 13 % to EUR 59.7 M. Higher staff costs and IT expenses were the main reasons

Higher Income                                                                                        Higher Expenses
EUR M                                                                                                EUR M

                                                                                                                                 0.2             0.3            0.3
                                                                                                                                                                             1.1
                                                                                                                       2.9
                                                                                   2.7

                                                     1.1             1.7
                                                                                                                5.3
                                    5.9
                                                                                              84.6                                                                                   59.7

                   1.2
                                                                                                        53.0
         74.2

         2020   Net interest   Net commission Net income from      IT income   Other income   2021      2020   Staff   IT    Stability fee     Travel and   Depreciation/   Others   2021
                 income            income     financial items at                                                                             representation amortisation
                                                  fair value

    19
Commitment to a Strong Capital Ratio
•    The Bank of Åland is committed to a strong capital ratio
                                                                                          According to S&P the capital position of the Bank of
                                                                                          Åland is strong
•    The Bank will continue to build up its capital base, improve and diversify
     earnings, and uphold a sound approach to risk                                            •   Strong risk-adjusted capitalization

•    In March 2021, for the first time the Bank of Åland issued additional Tier 1 (AT1)       •   Low credit losses
     capital instruments, totalling SEK 300 M                                                 •   RAC ratio 13.9 % (December 31, 2020) remains a rating strength to
•    Conservative pay-out policy is to safeguard the capital position                             the Bank of Åland
                                                                                              •   S&P (January 22, 2021 and again July 15, 2021) has indicated that
•    Dividends for 2019 and 2020 EUR 31.2 M approved and distributed under H1
     2021, subtracted from the Bank’s CET1 capital ratio on December 31, 2020                     they could raise the rating if the Bank of Åland's capitalization
                                                                                                  improves, as indicated by a sustained increase of its RAC ratio
•    CET1 capital ratio for a small bank like the Bank of Åland is not comparable to              beyond 15 % threshold for a very strong capital and earnings over
     larger banks with IRB methods. Standard & Poor’s rating method considers the
     Bank of Åland to have strong risk-adjusted capitalization                                    the next 24 months

     18.0                                                       16.5          16.6
                                15.4           15.8
     16.0        14.2                                           2.2           1.5
     14.0                       2.4             2.4                           1.7
                 1.3
     12.0
     10.0
      8.0
                 12.9           13.0           13.4             14.3         13.4
      6.0
      4.0
      2.0
      0.0
                 2017           2018           2019             2020         2021
                                       CET1    AT1    T2

20
5. Asset Quality

21
Lending Strategy – Balanced Credit Growth
 •           The Bank of Åland is a relationship Bank with primary focus on customers with                                                                     Stage 3 Credits 2018-2021
             investment needs in the Private Banking and Premium Banking segments                                                60                                                                                               1.4
                                                                                                                                                                                                         1.30
                                                                                                                                 50                                                                                        1.01   1.2
              ➢    Selective lending to high quality, affluent clients, where asset quality prioritised over                                                                  0.93
                                                                                                                                                                                            0.85 0.81       0.89 0.92             1.0
                  lending volume growth and higher returns                                                                       40                                                  0.81
                                                                                                                                                                                                                                  0.8

                                                                                                                       EUR M
                                                                                                                                 30             0.69

                                                                                                                                                                                                                                        %
 •           The Bank of Åland is not granting credits as a standalone product to mass market clients                                                  0.57 0.49 0.51 0.52                                                        0.6
                                                                                                                                         0.46
             or corporate clients                                                                                                20
                                                                                                                                                                                                                                  0.4
                                                                                                                                 10                                                                                               0.2
 •           Balanced growth in lending versus deposits in every business area
                                                                                                                                   0                                                                                              0.0
 •           Residential mortgages or property as collateral in at least half of the lending

 •           Many small loans are preferred to few large
                                                                                                                                                                 Stage 3 credits, EUR M
 •           Loan loss level 0.05 % in Q2 2021 and 0.08 % in Q2 2020*                                                                                            Share of Stage 3 credits of total lending, %

                                      Total Lending                                                                                                       Lending to the Companies                              Other industry and crafts

                                                                                                                                   1400                                                                         Construction
              5000
              4500                                                                                                                 1200                                                                         Agriculture, forestry and
              4000                                                                                                                                                                                              fishing
                                                                                                                                   1000                                                                         Other service operations
              3500

                                                                                                                               M EUR
     M EUR

              3000                                                                                                                     800
                                                                                Public and non-profit sector                                                                                                    Hotel and restaurant
              2500
                                                                                                                                       600                                                                      operations
              2000                                                              Companies                                                                                                                       Financial and insurance
              1500                                                                                                                     400                                                                      operations
              1000                                                              Private individuals                                                                                                             Other real estate operations
                                                                                                                                       200
               500
                 0                                                                                                                       0                                                                      Housing operations

                                                                                                                                                                                                                Wholesale and retail trade

                                                                                                                                                                                                                Shipping

     * Model-driven impairment losses on financial assets increased because of the expected effects of the Covid-19 pandemic. During the first quarter of 2020, the Bank
22   made a group provision of EUR 2.0 M related to heightened risk of losses in the corporate loan portfolio. So far it has not been necessary to utilize these provisions
6. Liquidity and Funding

23
Group Funding and Liquidity Management
 • Demand deposits and time deposits from core private customers and their                                      Group Funding Profile June 30, 2021
   companies are the main funding sources
                                                                                                                                0%
 • Covered Bonds, the main long-term funding tool, were introduced in early 2012 in                                        3%     5%                              Deposits
   order to diversify funding sources and to form a reliable and cost efficient funding                             10 %
                                                                                                                                                                  Covered Bonds
   channel                                                                                                    4%
                                                                                                                                                                  Senior unsecured

 • Loans from central banks have grown during the time of Covid-19: 2 % → 10 %                                                                                    Central banks

                                                                                                            15 %                                                  Short term banks
 • A balanced funding mix is maintained with diversity of funding sources                                                                           63 %
                                                                                                                                                                  Subordinated
 • Well-diversified maturity profile with limited exposure to short term wholesale                                                                                Own capital
   funding

                           Maturing Long Funding* June 30, 2021                           Themes 2021
                400                                                                       • Share of customer deposits will stay high on around 60 % of funding
                350
                300                                                                       • During the Covid-19 it has been a reasonable strategy to issue retained Covered Bonds and
                250                                                                         use those as collateral for funding from the central banks
        M EUR

                200
                150                                                                       • Demand conditions and the market situation favour issuance in Covered Bonds
                100
                 50                                                                       • The balanced funding mix is maintained
                 -
                          2021              2022          2023              2024          • The Bank of Åland will receive an MREL requirement from the beginning of 2022. The
                                                                                            requirement will consist of a minimum of 9 % total capital requirement and a minimum of 3 %
                                   Covered bonds    Senior unsecured
                                                                                            leverage ratio. The MREL requirements have no material effect on the funding of the Bank
     * Excluding retained Covered Bonds

24
Liquidity Reserve

                                                             Key metrics
 • Very high quality in liquidity reserves
     • The most liquid and tradable assets                 Liquidity reserve
     • LCR and NSFR targets reached
                                                                 19 %
 • Coordinated cash pools between Finland and Sweden          of total assets

 • Conservative approach to market risk within liquidity   Liquidity portfolio
   reserves
                                                           EUR 1,166 M
     • Assets with short duration
     • Well diversified counterparty risk profile
                                                                  LCR

                                                                152 %

                                                                 NSFR

                                                                110 %

25
7. Contact Details

     Vi går vår egen väg
26
Contact Details

Peter Wiklöf, CEO
peter.wiklof@alandsbanken.fi
+358 40 512 7505

Jan-Gunnar Eurell, CFO
jan-gunnar.eurell@alandsbanken.se
+46 70 589 1209

Maria Rissanen, Head of Group Treasury
maria.rissanen@alandsbanken.fi
+358 50 538 8898

27
8. Appendix

28
 28
Key Figures

                                     H1 2021   H1 2020   2020    2019    2018    2017    2016

     ROE, %                             14.4      10.1    11.6    10.7     9.8     9.1     9.1

     Expense/ income ratio, %            71        71      70      73      77      78      76

     Loan loss level, %                 0.03      0.22    0.11    0.08    0.02    0.06    0.11
     CET1 capital ratio, %              13.4      14.5    14.3    13.4    13.0    12.9    11.8
     Total capital ratio, %             16.6      16.7    16.5    15.8    15.4    14.2    13.0

     Earnings per share, EUR            1.27      0.85    2.02    1.69    1.48    1.35    1.29

     Equity capital per share, EUR     18.09     17.41   18.76   16.61   15.67   15.14   14.50

                                       4,518     4,188   4,378   4,110   4,022   3,979   3,808
     Lending to the public, EUR M
                                       3,801     3,459   3,605   3,368   3,304   3,148   3,028
     Deposits from public, EUR M
                                        311       271     292     258     242     234     222
     Equity capital, EUR M
                                       1,812     1,661   1,671   1,583   1,578   1,538   1,576
     Risk exposure amount, EUR M

     FTE                                825       744     751     700     691     691     683

29
Income Statement
     EUR M                                     H1 2021   H1 2020    2020    2019    2018    2017    2016

     Net interest income                          30.5      29.3    58.9     53.9    54.5    55.9    55.1
     Net commission income                        38.5      32.6    66.3     58.0    54.3    52.9    48.0
     Other income                                 15.6      12.3    24.9     22.0    18.8    19.2    17.3
     Total income                                 84.6      74.2   150.1    133.9   127.6   128.0   120.4

     Staff costs                                 -36.0     -30.7    -62.9   -57.0   -57.1   -59.8   -57.0
     Other expenses                              -23.7     -22.3    -42.7   -40.5   -40.7   -40.0   -34.3
     Total expenses                              -59.7     -53.0   -105.6   -97.5   -97.8   -99.8   -91.3

     Profit before impairment losses              25.0      21.3    44.6     36.4    29.8    28.2    29.2

     Net impairment loss on financial assets      -0.6      -4.6     -4.9    -3.2    -0.8    -2.1    -4.1

     Net operating profit                         24.4      16.7    39.7     33.2    29.0    26.0    25.1

     Income taxes                                 -4.5      -3.5     -8.2    -6.9    -6.1    -5.3    -5.4

     Net profit for the period                    19.8      13.2    31.5     26.3    22.9    20.7    19.7

     Non-controlling interests                     0.0       0.0      0.0     0.0     0.0     0.0     0.0

     Shareholders in Bank of Åland Plc            19.8      13.2    31.5     26.3    22.9    20.7    19.7

30
Outstanding Long-Term Funding* June 30, 2021

       Cover Pool FIN

       ISIN                           Nominal Amt     Settlement date   Maturity date               Coupon    Currency   EUR eq amt    Time to maturity
       XS0876678391                     90 000 000         30-01-2013    30-01-2023                    2.75       EUR     90 000 000              1.59
       XS1496878742                    250 000 000         29-09-2016    29-09-2023                       0       EUR    250 000 000              2.25
       FI4000375241                    300 000 000         19-03-2019    19-03-2024                   0.125       EUR    300 000 000              2.72
                                                                                                                         640 000 000              2.38

       Cover Pool SWE

       ISIN                           Nominal Amt     Settlement date   Maturity date              Coupon     Currency   EUR eq amt    Time to maturity
       SE0010598474                   2 500 000 000        22-11-2017    22-11-2022     QUARTLY STIB + 53.0       SEK    247 225 464              1.40
                                                                                                                         247 225 464              1.40

       Senior Unsecured

       ISIN                           Nominal Amt     Settlement date   Maturity date               Coupon    Currency   EUR eq amt    Time to maturity
       FI4000348966                    250 000 000         13-09-2018    13-09-2021                     0.5       EUR    250 000 000              0.21
                                                                                                                         250 000 000              0.21

 * Excluding retained Covered Bonds

31
Disclaimer
• The presentation was prepared by Bank of Åland Plc for use in investor relations. This presentation is not intended
  for retail customers

• This presentation has been prepared on the basis of publicly available information which the Bank of Åland
  considers to be reliable

• This presentation may contain forward-looking statements, which are subject to risks, uncertainties, and
  assumptions. This presentation is being presented solely for your information and is subject to change without
  notice. No representation or warranty, expressed or implied, is made and no reliance should be placed on the
  accuracy, actuality, fairness, or completeness of the information presented

• This presentation does not constitute an offer or invitation to purchase or subscribe for any shares or debt
  instruments of the Company, and no part of this presentation shall form the basis of or be relied upon in
  connection with any contract or commitment

• The contents of this presentation may not be reproduced, redistributed or passed on, directly or indirectly, to any
  other person or published, in whole or in part, for any purpose

32
You can also read