Results Presentation #sustainableactions - For the year ended 28 February 2021 - Calgro M3
←
→
Page content transcription
If your browser does not render page correctly, please read the page content below
Results
Presentation
For the year ended 28 February 2021

#sustainableactions

 www.calgrom3.com
Agenda

         1. Year in perspective

         2. Business update

         3. Financial review

         4. Looking forward

         5. Appendix

                                  2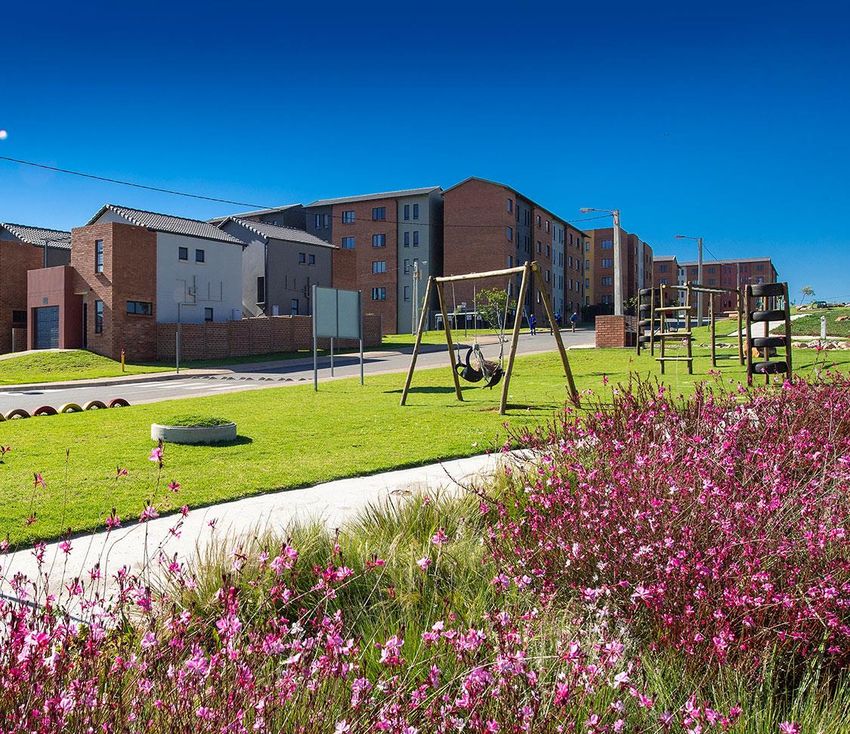
1
YEAR IN PERSPECTIVE
Background

         2016 - 2018                       2019 - 2020:

                                                                       Exacerbated by:
                               ▪ Having to stand ready with what
▪   No power                     feels like a loaded gun after head-
▪   Land invasions               winds of the past three years
▪   Constrained liquidity      ▪ Serviced land
▪   High cost structure        ▪ Sales
▪   Shortage of back-up cash   ▪ Cash to roll this out ….....
                               ▪   ….. and then Covid-19

    #sustainableactions                           2021 onwards

                                                                         4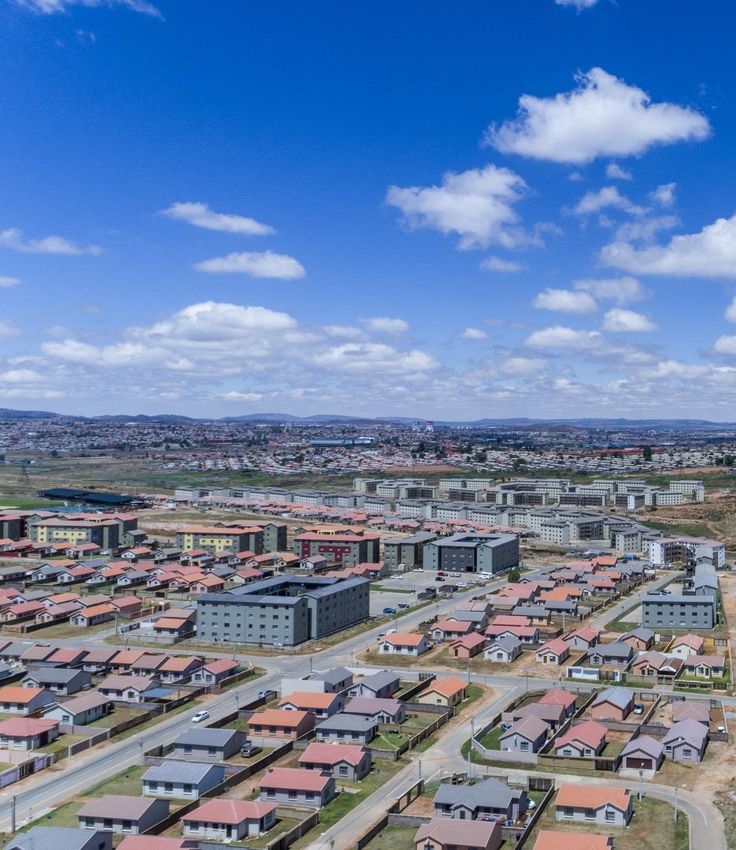
#sustainableactions

          Continued implementation to return to profitability

                                                   Grow market share
                                                                              Ensuring
 Optimal capital                                   and sales through
                                                                              liquidity and
 allocation               Complete units           product
                                                                              reducing debt
                          and increase sales       enhancement and
                          across Residential       increasing
                          Property                 footprint of
                          Development              Memorial Parks
                          business                 business

                         #sustainableactions
  Endeavour to ensure decisions and actions are taken so that we remain sustainable while
                      supporting Building legacies, Changing lives.
                                                                                            5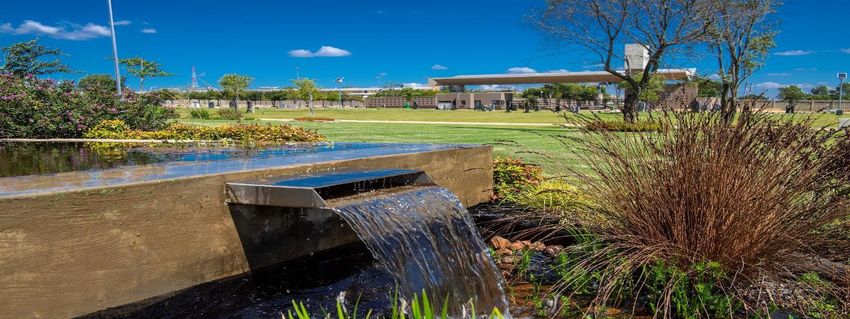
Strategic successes

         Disposal of Ruimsig rental portfolio

         Disposal of non-core Vista Park project

         Share buy-back

         Debt restructured

         Closure of in-house construction division

                                                     6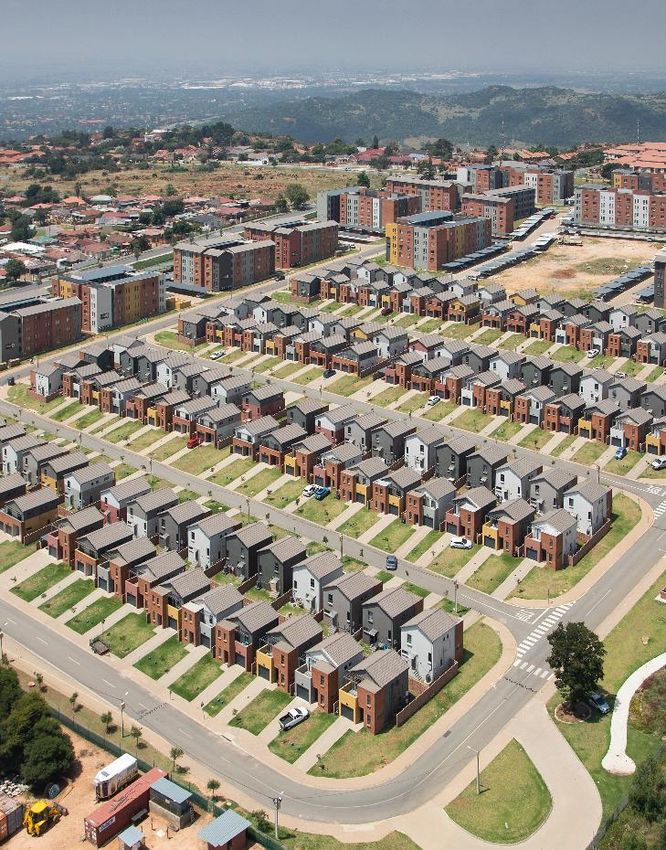
The base is set!

      NAV increased by 7,2% to                  Decreased total liabilities by
          R6,82 per share                       15,5% from R1,94 billion to
                                                      R1,64 billion

        PAT of R18,5 million                   Positive cash generated from
        (2020: R5,3 million)                   operations of R114,8 million to
                                                support #sustainableactions

      Memorial Parks revenue
                                             Liquidity of R555 million
       increased by 65,2%

    4,654 units under construction                 R155m
            (2020: 2,393)            R300m                        Cash on hand
                                                                  Available overdraft
                                                                  DFC
        Net debt : equity ratio                      R100m
              0.99 : 1
           (2020: 1.04:1)
                                                                             7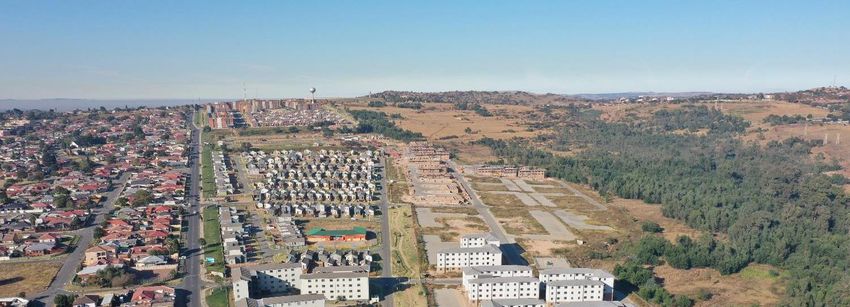
Dealing with Covid-19

     Residential Property Development                                           Memorial Parks

   All construction suspended during lockdown                     Considered an essential service &
   (three months' production lost)                              remained operational throughout the
                                                                           financial year
   Deeds office closed / operating with skeleton
   staff, causing delays in transfers                          Pricing reductions of graves & services
                                                                            implemented
   Annual house sales price increases not
   implemented to assist with affordability

                                                                         Ongoing interventions

                       Hand sanitiser &
Offices regularly                             Social distancing & mask      Ongoing, consistent staff
                        masks readily
    sanitised                                   wearing mandatory         communication & education
                          available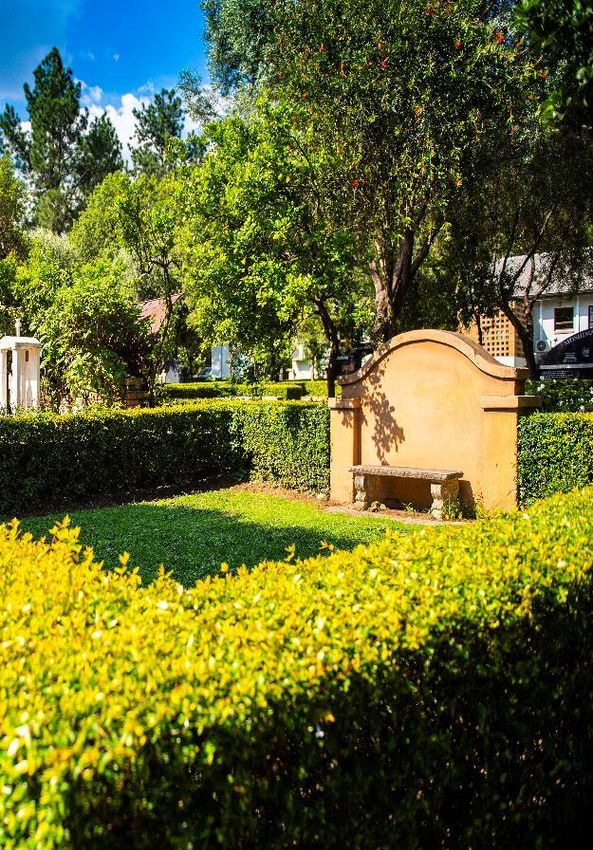
Building legacies and Changing lives

                                       Even though retrenchments
    Made sure all staff were paid in
                                       were unavoidable - paid 3x
    full during lockdown
                                       normal salary

    Fast tracked and shortened         Staff were able to work from
    SMME payments and                  home and will again if next
    retentions                         lockdown materialises

    Kept thousands of people fed       Retained United Nations Global
    and safe                           Compact advanced level status

    Continued to focus on
                                       Reduced pricing of graves and
    empowerment aside from
                                       services
    Level 1 B-BBEE status

                                                                 9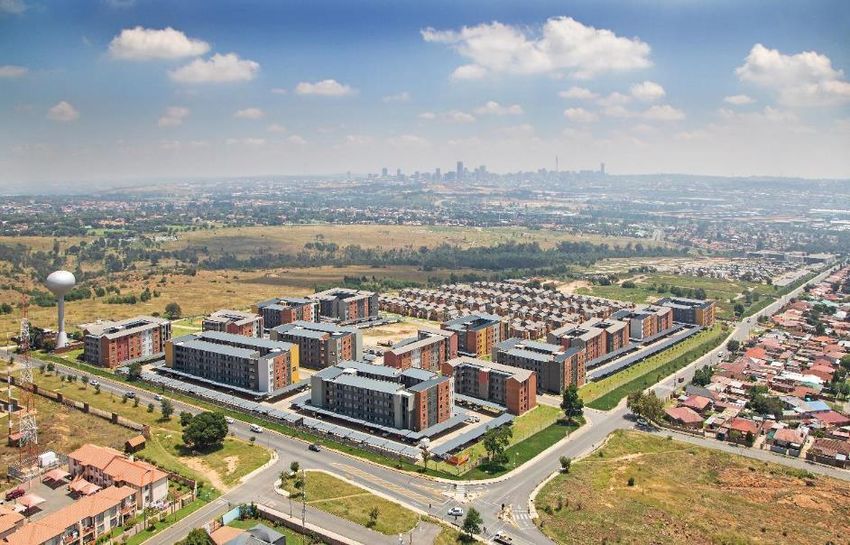
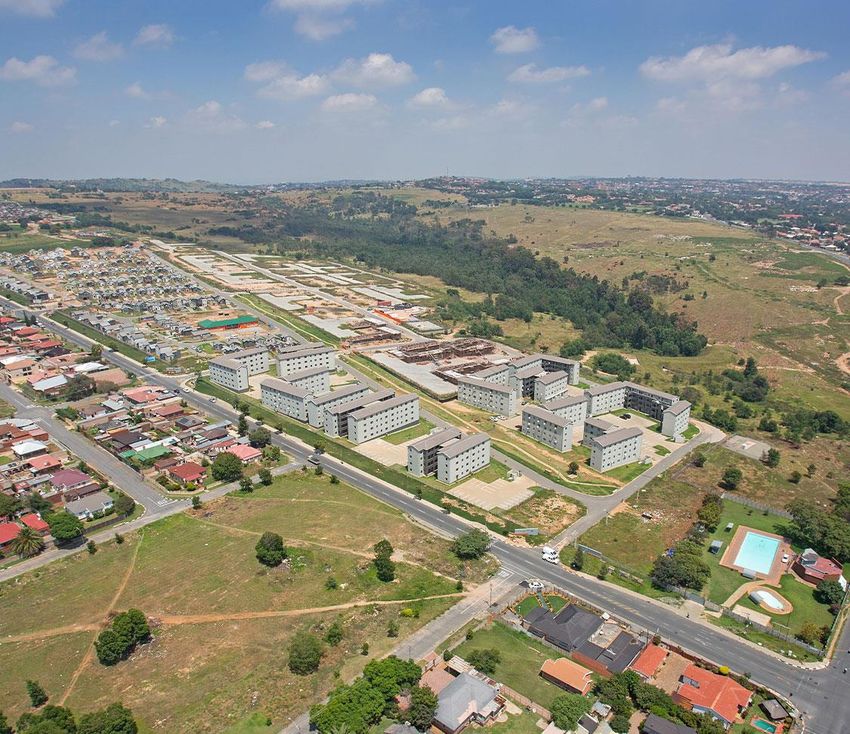
Purposeful location choices

Gauteng accounts for 34,0% and 38,6% of total residential properties in
         volume and value respectively (Lightstone research 2020)

                                                                     10
Purpose
112 BUSINESS UPDATE
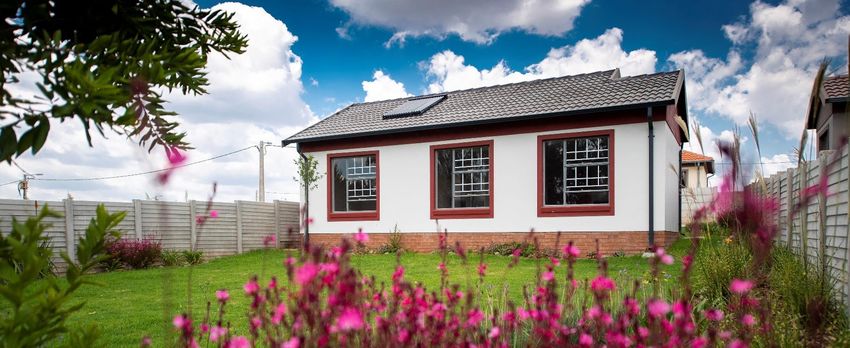
Integrated Residential Developments

▪ Largest contributor to revenue
▪ Three months’ production (construction)
  loss
▪ Covid-19 effect:
    ▪ Reduction in revenue from already low base
    ▪ Standing time costs (R35,8 million)
▪ Closure of construction division, reducing
  overheads and increased cash flow
  predictability
    ▪ Restructuring cost ̶ Construction Division
      successfully closed (R12,9 million)
▪ Substations funded and underway
▪ No need for investment in “long term”
  infrastructure as sufficient serviced stands
  in place
▪ Enhanced product offering while keeping
  sales prices low                                 13
Integrated Residential Developments:
Future focus
▪ Two provinces
▪ Gauteng
▪ Western Cape
▪ Sale of now non-core projects
▪ Meticulous capital allocation to high-yielding
projects
▪ Consistent monthly hand-over of units to
enhance stability of cash flows and reduce
capital exposure
▪ Lower overheads and leaner structure
▪ Government still spending but our focus is
on private sector
▪ Long-dated DFI debt to fund roll-outs in
more sustainable manner
▪ Focus on where the demand is while taking
risk into account – while housing market
remains strong
14Residential Property Developments
(Excluding Frankenwald, KwaNobuhle, and Umhlanga Hills)
15Residential Property Developments
32,590 total available opportunities with 33% in production
Under contruction
14%
Serviced
opportunities
19%
Partially /
unserviced
67%
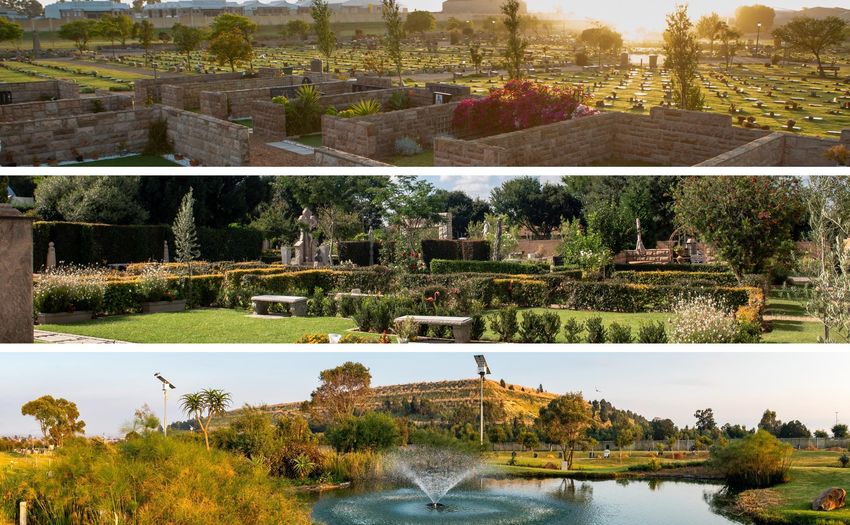
16Memorial Parks
17Memorial Parks
18Memorial Parks
▪ Revenue increased by 65,2%
▪ Total cash received increased by 57,0%
to R53,6 million (2020: R34,1 million)
▪ Total confirmed Covid-19 sales
amounted to R6,9 million
▪ High-quality products in safe and tranquil
environment
19Memorial Parks:
Future focus
▪ Current market share estimated to be 1% in
metro areas representing strong potential
growth with strong demand
▪ Pipeline of 59,366 burial opportunities
▪ No additional capital required –
development to be funded by operations
▪ National roll-out and development of further
land parcels to become a priority in the next
two years
20Memorial Parks
Contribution to cash (FY 2021) Total cash received (inlc VAT)
(all products excluding rental
income) (Rm)
53.6
21% CAGR 2018 – 2021
53,22%
1%
2% 46%
34.1
28.8
30%
14.9
Nasrec Fourways Enokuthula Bloemfontein Durbanville
2018 FY 2019 FY 2020 FY 2021 FY
213 FINANCIAL REVIEW
Summary of pertinent achievements in the year

Financial metric                  February    H1 (August    H2 (February    Improvement
                                      2021         2020)           2021)          on H1
Revenue (R’m)                        879,1         395,8           483,3          22,1%

Gross profit (R’m)                   108,0          31,3            76,7         145,1%

Gross profit (%)                     12,3%          7,9%           15,9%         101,3%

Administrative expenses              (87,1)        (47,7)          (39,4)        (17,4)%
(R’m)
Share of profit/(loss) of joint        3,3           1,2             2,1          73,5%
ventures and associates – net
of tax (R’m)

                                                                                    23
Statement of Cashflows
2021 2020
Cash (utilised in)/generated from operating activities
Cash generated from operations 114 768 074 464 208 720
Finance income received 7 576 796 14 598 305
Finance cost paid (107 474 196) (117 612 227)
Tax (paid)/refunded (17 878 456) (17 817 929)
Net cash (utilised in)/generated from operating activities (3 007 782) 343 376 869
Cash flow invested in investing activities
Additions of investment property (342 885) (16 759)
Purchase of property, plant and equipment (471 224) (771 883)
Proceeds from the sale of property, plant and equipment 11 500 379 635
Disposal of cash balance in disposal of investment in subsidiary (205 340) -
Investments in joint ventures and associates - (103 500)
Acquisition of businesses (500 000) (12 500 000)
Loans advanced to joint ventures and associates (50 945 569) (163 238 723)
Loans repaid by joint ventures and associates 886 885 18 049 785
Net cash invested in investing activities (51 566 633) (158 201 445)
24Statement of Cashflows
(continued)
2021 2020
Cash flows repaid in financing activities
Proceeds from borrowings 396 000 000 145 000 000
Repayment of borrowings (403 000 000) (157 000 000)
Loans repaid to joint ventures and associates - (23 000 000)
Shares bought back (14 175 000) -
Repayment of capital portion of leases (2 044 207) (1 839 258)
Transactions of non-controlling interest (22 174 286) (15 900 000)
Net cash repaid in financing activities (45 933 493) (52 739 258)
Net (decrease)/increase in cash and cash equivalents (100 507 908) 132 436 166
Cash and cash equivalents at the beginning of the year 255 069 163 122 632 997
Cash and cash equivalents at the end of the year 154 561 255 255 069 163
25Covenants
Audited Audited
year ended year ended
28 February 2021 29 February 2020
Net debt to equity ratio 0.99 1.04
Debt service cover ratio (“DSCR”) 1.40 1.93
Date Target
By 28 February 2022 0.90:1
By 28 February 2023 0.80:1
By 28 February 2024 0.75:1
26Segmental revenue contribution
Revenue Audited Audited
year ended year ended
28 February 2021 29 February 2020
Residential Property Development 829 101 989 950 342 471
Memorial Parks 42 451 968 25 692 483
Residential Rental Investments 7 592 628 8 095 532
Total 879 146 585 984 130 486
27Residential project contributions
(to Residential Property Development segment)
FY 2021 FY 2020
100%
90% 28 379
80% 229 038
88 632
70% 379 496 41 229
60% 183 566
50%
40% 96 103
30% 315 941
107 799
20% 231 378 22 024
10% 55 854
0%
Fleurhof Jabulani Witpoortjie South Hills Belhar Third parties
28Statement of Comprehensive Income
Revenue Audited Audited
year ended year ended
28 February 2021 29 February 2020
Revenue 879 146 585 984 130 486
Cost of sales (771 123 301) (883 521 154)
Gross profit 108 023 284 100 609 332
Other income 50 630 761 11 314 454
Administrative expenses (87 064 595) (89 116 268)
Other expenses (4 085 328) -
Impairment (losses)/gains on financial and (99 402) 25 169 310
contracts assets
Operating profit/(loss) 67 404 720 47 976 828
Finance income 28 212 925 30 800 370
Finance costs (72 897 240) (64 717 053)
Share of profit/(loss) of joint ventures and 3 345 892 (732 541)
associates – net of tax
Profit/(loss) before tax 26 066 297 13 327 604
Taxation (7 586 856) (7 984 810)
29Statement of Comprehensive Income
(Continued)
Revenue Audited Audited
year ended year ended
28 February 2021 29 February 2020
Profit after taxation 18 479 441 5 342 794
Profit after taxation attributable to:
Equity holders of the Company 18 944 086 4 918 905
Earnings per share – cents 14.88 3.84
Headline earnings/(loss) per share – cents (15.17) 1.77
Certain once off costs Audited
28 February 2021
Profit on disposal of investment in subsidiary (R36,6 million)
Fair value adjustment in investment properties (R5,7 million)
Loss on sale of investment in joint venture R4,1 million
30Statement of Financial Position – Assets
Assets 2021 2020
Non-current assets
Investment property 19 947 022 13 833 550
Property, plant and equipment 22 500 654 27 490 484
Intangible assets 159 650 534 159 655 377
Investments 13 027 204 12 269 982
Investments & investment in joint ventures and associates 37 066 691 164 647 175
Deferred income tax asset 56 582 473 57 263 604
308 774 578 422 890 190
Current assets
Loans to joint ventures and associates 320 435 842 279 903 888
Inventories 643 573 871 719 305 469
Current tax receivable 976 320 1 227 212
Construction contracts 840 695 306 945 948 487
Trade and other receivables 198 786 388 130 437 204
Cash and cash equivalents 154 561 255 255 069 163
2 159 028 982 2 331 891 423
Total assets 2 467 803 560 2 754 781 613
31Statement of Financial Position – Equity and Liabilities
Equity and Liabilities 2021 2020
Total Equity 828 057 105 815 191 931
Non-current liabilities 208 616 970 219 242 079
Current liabilities
Borrowings 944 161 828 1 062 842 931
Current income tax liabilities 92 611 672 463
Trade and other payables 486 875 046 656 832 209
1 431 129 485 1 720 347 603
Total liabilities 1 639 746 455 1 939 589 682
Total equities and liabilities 2 467 803 560 2 754 781 613
32Borrowing maturities
Detail Rand Maturity profile Rand
Opening balance 1 March 2020 (gross) 1 069 000 000 FY 2022 107 400 000
New debt 396 000 000 FY 2023 194 800 000
Debt repaid (507 000 000) FY 2024 282 800 000
Closing balance – 28 February 2021 958 000 000 FY 2025 211 750 000
FY 2026 107 500 000
FY 2027 53 750 000
334 LOOKING FORWARD
What does Calgro M3 have to work with?

                            ▪   Housing shortage remains high
                            ▪   66,5% housing market in Gauteng and Western Cape
                            ▪   Strong pipeline to capitalise on
                            ▪   Deep, strong market presence

                            ▪   Current grave shortage for next 15 – 20 years ± 8 million
                            ▪   Funeral insurance industry growing in excess of 10% pa
                            ▪   Deep, strong market presence
                            ▪   Increasing Memorial Park’s market share and
                                consistency in cashflow

                            ▪ Strong cashflow and cash from both business operations and sale
•   Current grave shortage for next 15
    – 20 years ±
                                  of non-core projects
    8 million                  ▪ Limited long-term investment necessary in both businesses,
•   Funeral insurance industry    however:
    growing 12% pa
                                     ▪ Cash from operations and facilities to be utilised during next
•   Deep, strong market
•    presence                          6 – 9 months to capitalise and provide momentum
•   Increasing Memorial Parks ▪   Well-located projects and risk-mix between projects and clients
                               market                                                                 35
                               ▪ Lean business
    share and consistency in cashflow
Take away – what lies ahead?
▪ Debt down R119 million in 2020
▪ Needs to reduce further to meet 0.9:1 target by
2022
▪ May increase during year though
▪ Conclude sale of Eastern Cape and
KwaZulu-Natal land
▪ Sale, transfer and cash in bank of old rental
properties and first commercial/retail stands
▪ Utilisation of proceeds:
▪ Settle debt further
▪ Free-up more working capital and retain higher
cash balance
▪ Share buybacks
▪ 4,650 units under construction (2020: 2,393)
▪ Sell houses and drive production
▪ Hand-over and transfer process needs to be
profitable and turn cash
▪ Drive Memorial Parks for market share growth
36Thank you
Wikus Lategan (CEO) Email: wikus@calgrom3.com
Waldi Joubert (FD) Email: waldi@calgrom3.com
Tel: +27 11 300 7500
www.calgrom3.com
Keyter Rech Investor Solutions – Vanessa Rech
Tel: 083 307 5600
Email: vrech@kris.co.za
Available on website:
▪ ESG Report 2021
▪ Corporate Governance Report 2021
▪ Integrated Annual Report and Annual
Financial Statements 2021
▪ King IV™ Application Register
▪ Notice of AGM 2021Disclaimer Calgro M3 has acted in good faith and has made every reasonable effort to ensure the accuracy and completeness of the information contained in this presentation, including all information that may be defined as 'forward- looking statements'. Forward-looking statements may be identified by words such as 'believe', 'anticipate', 'expect', 'plan', 'estimate', 'intend', 'project', 'target', 'predict' and 'hope'. By their nature, forward-looking statements are inherently predictive, speculative and involve risk and uncertainty because they relate to events and depend on circumstances that will occur in the future, involve known and unknown risks, uncertainties and other facts or factors which may cause the actual results, performance or achievements of the Group, or its sector to be materially different from any results, performance or achievement expressed or implied by such forward-looking statements. Forward-looking statements are not guarantees of future performance and are based on assumptions regarding the Group’s present and future business strategies and the environments in which it operates now and in the future. No assurance can be given that forward-looking statements will prove to be correct and undue reliance should not be placed on such statements. Calgro M3 does not undertake to update any forward-looking statements contained in this document and does not assume responsibility for any loss or damage whatsoever and howsoever arising as a result of the reliance by any party thereon.
5
APPENDIX
Business model

                 40
Business model
41Board composition
You can also read