INVESTOR PRESENTATION Q2 FY20 RESULTS NOVEMBER 2019 - TBZ

Page created by Brian Russell
 
CONTINUE READING
INVESTOR PRESENTATION Q2 FY20 RESULTS NOVEMBER 2019 - TBZ
INVESTOR PRESENTATION
Q2 FY20 RESULTS
NOVEMBER 2019
INVESTOR PRESENTATION Q2 FY20 RESULTS NOVEMBER 2019 - TBZ
DISCLAIMER

This presentation has been prepared by Tribhovandas Bhimji Zaveri Limited (“TBZ”) for informational purposes only and does not
constitute or form any part of any offer, invitation or recommendation to purchase or subscribe for any securities in any jurisdiction,
and no part of it shall form the basis of, or be relied upon in connection with, any contract or commitment on the part of any person to
proceed with any transaction.

The information contained in this presentation has not been independently verified. No representation or warranty, express or implied,
is made and no reliance should be placed on the accuracy, fairness or completeness of the information presented or contained in these
materials.

Any forward-looking statements in this presentation are subject to risks and uncertainties that could cause actual results to differ
materially from those that may be inferred to being expressed in, or implied by, such statements. Such forward-looking statements are
not indicative or guarantees of future performance. Any forward-looking statements, projections and industry data made by third
parties included in this presentation are not adopted by the Company and the Company is not responsible for such third party
statements and projections.

This presentation may not be all inclusive and may not contain all of the information that you may consider material. The information
presented or contained in these materials is subject to change without notice and its accuracy is not guaranteed. Neither the Company
nor any of its affiliates, advisers or representatives accepts liability whatsoever for any loss howsoever arising from any information
presented or contained in these materials. This presentation cannot be used, reproduced, copied, distributed, shared or disseminated
in any manner. No person is authorized to give any information or to make any representation not contained in and not consistent with
this presentation and, if given or made, such information or representation must not be relied upon as having been authorized by or on
behalf of TBZ.

                                                                                                                                           2
INVESTOR PRESENTATION Q2 FY20 RESULTS NOVEMBER 2019 - TBZ
DISCUSSION SUMMARY
•   Q2 FY20 Results Update
•   About Us
•   Operational Summary
•   Business Model
INVESTOR PRESENTATION Q2 FY20 RESULTS NOVEMBER 2019 - TBZ
Q2 FY20 RESULT HIGHLIGHTS

                                                                                                                                                                        In Rs Mn

              REVENUES & GROSS MARGIN                                                EBITDA & EBITDA MARGIN                                      PAT & PAT MARGIN

               15.3%                        13.9%                                    4.6%                        5.5%
                                                                                                                                           0.5%                0.2%
                                                                                                                  217
               3,457                        3,932
                                                                                     158

                                                                                                                                            17                   9

             Q2 FY19                       Q2 FY20                                  Q2 FY19                    Q2 FY20                    Q2 FY19             Q2 FY20

                     OPERATING COSTS (% of Total Revenue)                                                    REVENUE ANALYSIS

                                                                                                             Total Revenue Growth %
                                                                                                                                                                13.7%
                                                                                                             - Q2 FY20
     Q2
                           5.0%                   1.3%              2.0%
    FY20
                                                                                                             Same Store Sales Growth %
                                                                                                                                                                12.5%
                                                                                                             - Q2 FY20
     Q2
                           4.9%                  1.4%        1.9%            2.5%
    FY19
                                                                                                             Share of Diamond Jewellery
                                                                                                                                                             25.2%(20.7%)
                                                                                                             - Q2 FY20 (Q2 FY19)
         Manpower               Advertisment             Rentals           Other Overheads

On comparable basis (before taking into account IND AS 116) Q2 FY 20 EBITDA Margins are 3.7%, Rentals are 1.9% of total revenue                                                    4
INVESTOR PRESENTATION Q2 FY20 RESULTS NOVEMBER 2019 - TBZ
H1 FY20 RESULT HIGHLIGHTS

                                                                                                                                                                        In Rs Mn

            REVENUES * & GROSS MARGIN                                               EBITDA & EBITDA MARGIN                                       PAT & PAT MARGIN

               15.1%                        14.6%                                                               5.8%
                                                                                    3.9%
                                                                                                                                           0.4%                0.5%
                                            8,230                                                                       474
               7,566
                                                                                     297

                                                                                                                                                                39
                                                                                                                                            30

             H1 FY19                       H1 FY20                                H1 FY19                      H1 FY20                    H1 FY19             H1 FY20

                         OPERATING COSTS (% of Total Revenue)                                                REVENUE ANALYSIS

                                                                                                             Total Revenue Growth %
                                                                                                                                                                8.8%
                                                                                                             - H1 FY20
     H1
                          4.6%                   2.1%           2.1%
    FY20
                                                                                                             Same Store Sales Growth %
                                                                                                                                                                4.6%
                                                                                                             - H1 FY20
     H1
                          4.5%                     2.6%           1.8%          2.3%
    FY19
                                                                                                             Share of Diamond Jewellery
                                                                                                                                                             23.9%(22.4%)
                                                                                                             - H1 FY20 (H1 FY19)
         Manpower               Advertisment              Rentals          Other Overheads

On comparable basis (before taking into account IND AS 116) H1 FY 20 EBITDA Margins are 4%, Rentals are 1.8% of total revenue                                                      5
INVESTOR PRESENTATION Q2 FY20 RESULTS NOVEMBER 2019 - TBZ
Q2 FY20 BALANCE SHEET UPDATE

                                                                                                                                                In Rs Mn

                           LEVERAGE ANALYSIS                                                               TOTAL DEBT BREAKUP

                  1.14                              1.06                                           6,054                               5,558

                         5,657
         4,941                              4,821          5,105                                   3,000                               1,828

                                                                                                   3,054                               3,730

                 Mar-19                           Sept-19                                         Mar-19                              Sept-19

            Equity               Net Debt         Net Debt/Equity                                Working Capital Debt                Gold on Loan

Notes:

1) Gold on Loan is shown as part of short term borrowings, while some of the listed peers show it under current liabilities / trade payables.

2) Out Of Total Gold inventory as on 30th Sept 2019 Gold on Loan is 34.1% as compared to 57.2% as on 31st March 2019

                                                                                                                                                           6
INVESTOR PRESENTATION Q2 FY20 RESULTS NOVEMBER 2019 - TBZ
Q2 FY20 - KEY RESULT TAKEAWAYS

 REVENUE & MARGIN:

 • Revenue for Q2 FY20 Increased by 13.7% YoY mainly due to higher sales of diamond
    jewellery (25.2% versus 20.7%)

 • Gross Profit Margins for Q2 FY20 were lower on account of promotional/tactical offers.

 • Finance cost shows increase due to impact of IND AS116 , without IND AS 116 finance
    cost remained stable.

 BALANCE SHEET & CASH FLOW:

 • Efficient working capital management led to reduction in Net Debt by Rs358 Mn (QoQ),
    and Rs. 858 Mn (YoY)

 • Net Debt to Equity Ratio has improved from 1.24x in Q2 FY19 to 1.06x in Q2 FY20.

 • FCF* improved on account of better working capital management. Cash flow from
    operations were at Rs 957Mn against Rs (338Mn) in H1FY19

FCF* = Operating cash Flows – Capex – Finance Cost
                                                                                            7
INVESTOR PRESENTATION Q2 FY20 RESULTS NOVEMBER 2019 - TBZ
Impact of IND AS 116

 IND AS 116 (Accounting for leases) was mandated from 1st April 2019

 This Ind-AS has the following impact:

 1) On Profit & Loss: Lease Rental expenses is replaced by Depreciation and Interest Expenses.
 2) On Balance sheet: The Accounting Standard essentially brings all the leases into the balance sheet as a “Right to use” on asset side
 with a corresponding “Lease obligation” on Liability Side.

 The Company has opted to adopt “Modified Retrospective approach”, by which we go back to the start of the leases and arrive at
 the “Right to use” assets and the “Lease obligation” on 1st April 2019 and the difference between the liabilities and assets is
 reduced from the opening net worth as on 1st April 2019.

 The actual impact of adoption of Ind-AS is as follows: -

 For quarter ending 30th Sept 2019, Rent expenses has decreased by Rs.73Mn offset by increase in depreciation by Rs.54Mn and
 interest expense by Rs.24Mn resulting into higher EBITDA by Rs.73Mn lower PBT by Rs.5Mn.

 As at 1 April 2019 we recognised Right to use assets of Rs.794Mn and Lease liability of Rs.956Mn and the difference of Rs.106Mn
 (net of deferred tax of Rs.56Mn.) has been adjusted in retained earnings.

                                                                                                                                           8
INVESTOR PRESENTATION Q2 FY20 RESULTS NOVEMBER 2019 - TBZ
BRAND BUILDING & MARKETING INITIATIVES

•   TBZ has been making consistent investments in its
    marketing activities to widen its customer base and
    promote the brand in India

•   Recently TBZ appointed Bollywood actress Sara Ali
    Khan as new brand ambassador

•   Sara Ali Khan will feature in several brand campaigns
    endorsing the ‘TBZ-The Original’ brand across India

•   Launched Sitara – Affordable diamond jewellery
    collection range with Sara Ali Khan

•   Launched Tatva- Affordable gold, jewellery collection
    with Sarah Ali Khan

                                                            9
INVESTOR PRESENTATION Q2 FY20 RESULTS NOVEMBER 2019 - TBZ
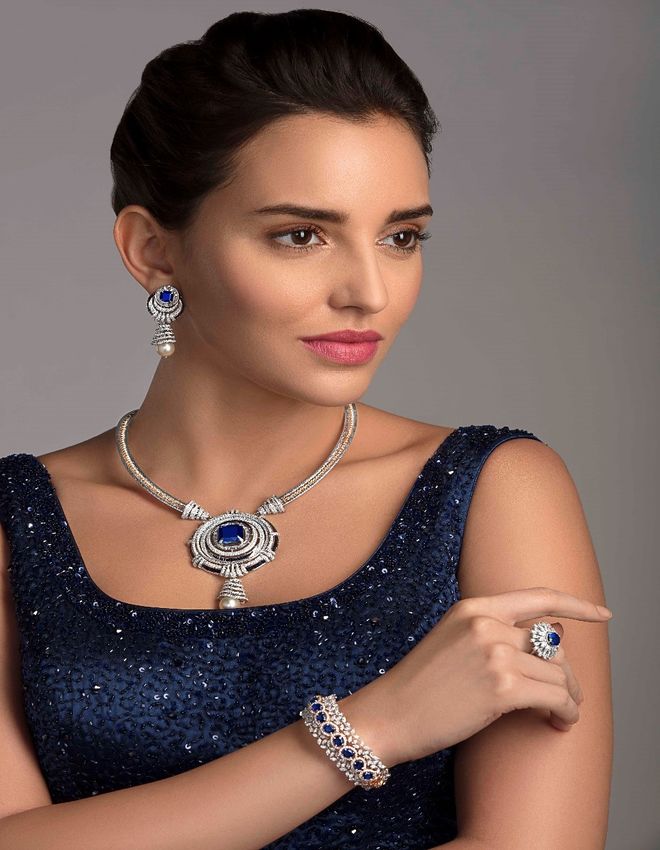
NEW LAUNCHES & COLLECTION

                            10
LATEST JEWELLERY DESIGNS & COLLECTIONS

                                         11
CONTEMPORARY JEWELLERY DESIGNS & COLLECTIONS

                                               12
CONTEMPORARY JEWELLERY DESIGNS & COLLECTIONS

                                               13
CONTEMPORARY JEWELLERY DESIGNS & COLLECTIONS

                                               14
CONTEMPORARY JEWELLERY DESIGNS & COLLECTIONS

                                               15
Q2 FY20 - PROFIT & LOSS STATEMENT

Particulars (In Rs Mn) –
                                    Q2 FY20    Q2 FY19     YoY %     H1 FY20    H1 FY19    YOY %      FY19
Standalone
Net Revenues                           3,932      3,457     13.7%       8,230      7,566      8.8%   17,638
COGS                                   3,387      2,925      15.7       7,026      6,422      9.4%   15,149
Gross Profit                            545        531       2.55       1,204      1,144      5.3%    2,489
Gross Margin (%)                      13.9%      15.4%    -151 bps     14.6%      15.1%    -48 bps   14.1%
Personnel Expenses                      195        170       14.8        381        343      11.1%     732
Other Expenses (refer slide 8)          132        203       -35.0       349        504     -30.8%    1,019
EBITDA                                  217        158       37.7        474        297      60.0%     738
EBITDA Margin (%)                      5.5%       4.5%     96 bps       5.8%       3.9%    184 bps    4.2%
Depreciation (refer slide 8)             74         23     220.9%        155         44     251.5%      99
Other Income                             14          7      89.6%         28         18      59.1%      56
Interest Expenses (refer slide 8)       145        116      24.2%        286        224      27.3%     464
Profit Before Tax                        13         26     -51.0%         62         46      35.3%     231
Tax                                       4          9     -52.4%         23         16     44.6%       78
PAT                                     8.50      17.09    -50.2%         39         30      30.4%     153
PAT Margin (%)                        0.22%       0.5%     -28 bps      0.5%       0.4%      8 bps    0.9%
Q2 FY20- BALANCE SHEET

Particulars (In Rs Mn) – Standalone      Sept-19    June-19    March-19
Shareholders Funds (refer slide 8)         4,821      4,878       4,941
Loan Funds                                 5,558      5,953       6,054
          Gold on Loan                     1,828     2,853        3,000
          Working Capital Loan             3,730     3,100        3,054
          Lease Liability                    589       635            -
Other Long Term Liabilities                   64        358         77
Other Financial Liabilities                   4.6        4.6          -
Sources of Funds                          11,037    11,829       11,073
Net Block (refer slide 8)                  1,742     1,797        1,075
Other Long Term Assets (refer slide 8)       206       247         219
Inventory                                 11,666    11,901       11,869
Debtors                                       84       103         259
Cash and Bank Balance                        453       490         397
Other Current Assets                         494       495         492
Current Liabilities                        3,609     3,204        3,239
Net Current Assets                         9,089     9,785        9,778
Application of Funds                      11,037    11,829       11,073
                                                                          17
DISCUSSION SUMMARY
•   Q2 FY20 Results Update
•   About Us
•   Operational Summary
•   Business Model
WHY IS TBZ DIFFERENT ?

                                                 Pedigree                                                  Strong Brand Value

                           •      150+ years in jewellery business                         •      Healthy sales productivity
                           •      First jeweller to offer buyback guarantee in             •      High footfalls conversion - 80%
                                  1938                                                     •      High ticket size - Gold – Rs 89 k, Diamond –
                           •      Professional organisation spearheaded by                        Rs 103 k
                                  5th generation of the family

              Scalability & Reach                                                                                                   Specialty Wedding Jeweller

•    41 stores (120,595sq. ft.)                                                    TBZ                                 •       ~ 65% of sales are wedding & wedding
•    Presence – 29 cities, 14 states                                                                                           related purchases
Expansion Plan -                                                SUSTAINABLE COMPETITVE ADVANTAGES                      •       Compulsion buying
•    ~150,000 sq. ft.                                                                                                  •       Stable fixed budget purchases by customers

                                                                             Design Exclusivity

                                                            •     29 designers (incl. 14 CAD)
                                                            •     8 - 10 new jewellery lines/year
                                                            •     In-house diamond jewellery production
                                                            •     Customer loyalty
                                                            •     Premium pricing

                                                                                                                                                                       19
KEY MILESTONES

                                                  STRONG LEGACY OF MORE THAN 150 YEARS BUILT ON TRUST

                                                                                           Retail footprint
 Flagship store                              Introduced 100% pre- Diamond facility
                                                                                          crosses 84k sq ft                            2nd Franchise
opened in Zaveri                              hallmarked jewellery expansion - ~6k to                              1st Franchise
                                                                                           across 20 cities                          store opened at
Bazaar, Mumbai                                                         ~24k sq ft                                store opened at
                                                                                                                                      Patna, Bihar in
                                                                                                                     Dhanbad,
                                                                                          Sales crossed Rs                                Aug-16
                   First to launch light                                                                           Jharkhand in
                                                                                        16,000 mn, PAT of Rs                                          Opened store in
                    weight jewellery                     Turnover crossed                                             Nov-15
                                                                                              850 mn                                                  Lucknow in
                                                          Rs 5,000 mn in
                                                               FY09                                                                                   Mar-19

1864         1938         1995             2001      2004        2009       2011        2012       2013        2014        2015       2016        2017         2019

                                                                                                                              3 franchise stores opened in
                                                                                                       Recommended            Ranchi, Jharkhand in Mar-17,
          First to offer                                                     Listed on BSE & NSE
                                                                                                     special dividend of    Jamnagar, Gujarat in Apr-17, and
       buyback guarantee                                                          with IPO of
                                                                                                     7.5% on the special     Bhopal, Madhya Pradesh in Oct-
                                                                                 Rs 2,000 mn                                                17
                                                                                                      occasion of 150th
                                 Mr Shrikant Zaveri                Implementation of                year of the company
                                                                                                                                3 exclusive brand outlets
                               took over the business               Oracle ERP Suite                                            opened in Malls – R-City,
                                                                                                                             Seawoods in Sep-17 and High
                                                                                                                             Street Phoenix – in Mumbai in
                                                                                                                                         Nov-17
                                                                                                                                                                        20
RETAIL PRESENCE

                                                            PAN-INDIA PRESENCE WITH 41 STORES
                                                             WITH A RETAIL SPACE OF ~120,595
                                                                  SQ. FT. SPREAD ACROSS
                  Present across 29 cities                         29 CITIES IN 14 STATES
                       in 14 states

                                             NUMBER OF STORES                               TILL DATE

                                             Large Format (> 2,000 sq. ft.)                     31

                                             Small Format (
RETAIL FOOTPRINT EXPANSION

                                                                                       1,20,699
                                                                            1,10,666
                                                             1,02,930
                                          98,200
                                                                                         41
                       91,058
            88,093                                                            37
 82,368
                                                                32
                                               30
             27          28
  25

  FY13       FY14      FY15                FY16                FY17          FY18        FY19

                       No. of Retail Outlets        Carpet Area (sq. ft.)

                                                                                                  22
DISCUSSION SUMMARY
•   Q2 FY20 Results Update
•   About Us
•   Operational Summary
•   Business Model
OPERATIONAL SUMMARY

                                                                    GOLD & DIAMOND VOLUMES

                                         52,010
                                                                                                                    45,111                    44,913
                                                                 39,958                    40,762
                                 4,706
                                                        4,216                                               3,931                     4,027
                                                                                   3,738

                                 FY15                    FY16                      FY17                     FY18                       FY19
                                                                Gold Sales (kgs)           Diamond Sales (cts)

                              SSSG - TOTAL (%)                                                                   AVERAGE TICKET SIZE (RS ‘000)

                                                                                                      139
                                                                                                                      122                             129
       4.0                                                                                                                            115
                                                  0.1                                                                                                            103
                                                                                                 85                                              91         89
                                                                                                                 73             80
                                      -2.1                          -0.4

                      -16.5

      FY15            FY16            FY17        FY18              FY19
                                                                                                    FY15           FY16             FY17         FY18       FY19
SSSG: Same store sales value growth
                                                                                                                             Gold      Diamond

                                                                                                                                                                       24
DISCUSSION SUMMARY
•   Q2 FY20 Results Update
•   About Us
•   Operational Summary
•   Business Model
BUSINESS MODEL: MANUFACTURING

                                                Gold
PROCUREMENT

                   •   Raw Material - Bullion
                   Sources:
                   •   Exchange & purchase of old jewellery
                   •   Bullion dealers
                   •   Banks - imported gold
                   •   Banks - domestic gold (gold deposits) on loan

                   •   Gold jewellery manufacturing is outsourced.
                   •   Vast nation-wide network of 150 vendors
                   •   Each vendor has an annual gold processing capacity of
MANUFACTURING

                       more than 100 kg.
                   •   These vendors are associated with TBZ since generations
                       and are experts in handmade regional jewellery designs.

                                                                                 26
BUSINESS MODEL: MANUFACTURING

                                             Diamond
PROCUREMENT

                   •   Raw Material - Cut & polished diamonds
                   Sources:
                   •   DTC site holders

                   •   In-house diamond jewellery manufacturing leading to
                       exclusive designs, lower costs, and higher margins
                   •   Manufacturing facility at Kandivali, Mumbai spread over
                       ~24,000 sq ft with capacity of ~200,000 cts (on dual
MANUFACTURING

                       shift basis).
                   •   The facility also has capacity for 4,000 kg of gold refining
                       and 4,500 kg of gold jewellery components
                       manufacturing.

                                                                                      27
BUSINESS MODEL: RETAIL

         EFFICIENT INVENTORY MANAGEMENT

        HUB & SPOKE MODEL - ROI OPTIMISATION

                                                                                SMALL STORES

                                                       •    2,000 sq ft
                                                       •   Standalone high street - heart of city
                                                       •   Wider range
                                                       •   Higher price points
                                                           (up to Rs 2,000k)

                     SMALL
                     STORE

                                                                                                    28
BUSINESS MODEL: SCALABILITY

•      TBZ has an expansion plan to increase its retail space from 120,595 sq. ft. at present to around 1,50,000 sq. ft.
       over near term.

•      TBZ plans to carry out the expansion through mix of franchisee route and addition of its own stores.

•      All the prospective expansion locations have already been identified backed by 2 years of extensive market
       research.

                                            FY12                            Till Date                          Target

    Number of Stores                         14                                41

    Retail Sq ft                           ~48,000                          ~120,595                          ~1,50,000

    Number of Cities                         10                                29

                                                                                                                           29
GOLD METAL LOAN: EFFICENT SOURCING CHANNEL

                GOLD METAL LOAN ORIGINATION                                             GOLD METAL LOAN REPAYMENT

•   TBZ takes 10 kg gold from a bank on lease on day 0.                •   TBZ repays the gold daily based on actual sales of gold
•   The contract for gold lease is 180 days.                               jewellery.
•   TBZ provides a bank guarantee worth 110% of gold leased.           •   The bank converts 1 kg of gold on lease as a sale to TBZ at a
                                                                           reference rate set by them as on day 1.
•   Total Financing cost (interest on gold lease plus bank guarantee
    commission) to TBZ is ~3.5% p.a.                                   •   TBZ books a purchase of 1 kg of gold.
                                                                       •   The balance 9 kg worth of gold continues to remain on lease.
                                                                       •   TBZ again replenishes the inventory by taking 1 kg of gold on
                                                                           lease from bank on day1.
                                                                       •   Since TBZ’s gold jewellery inventory turns 2-3 times, it repays
                                                                           the gold lease before 180 days.

                 GOLD METAL LOAN ADVANTAGES                                             GOLD METAL LOAN LIMITATIONS

•   Interest Cost Savings: Borrowing cost on gold lease is             •   Sharp increase in gold prices: Gold lease is marked to market
    significantly lower compared to working capital borrowing cost.        on a daily basis. So any increase in gold price will cause TBZ to
                                                                           top up its bank guarantee.
•   No Commodity Risk: Since gold is taken on lease, there is no
    gain if gold prices increase or loss if gold prices decrease.      •   Bank Guarantee limitations: Bank guarantee issued by the bank
                                                                           to TBZ is based on the drawing power enjoyed by TBZ.
                                                                       •   Contract Period: If TBZ is unable to sell the gold on lease within
                                                                           180 days, then they will have to convert the balance unutilized
                                                                           gold to purchase.

                                                                                                                                                30
AWARDS & RECOGNITION

•   “CONTEMPORARY DIAMOND JEWELLERY AWARD” & “TREASURE
    OF THE OCEAN “
    GJC’S NATIONAL JEWELLERY AWARD 2018

•   “DIAMOND VIVAH JEWELLERY OF THE YEAR”
    Retail Jeweller India Awards - 2018

•   “INDIA’S MOST PREFERRED JEWELLERY BRAND”
    UBM India - 2017

•   “BEST RING DESIGN OVER Rs. 2,50,000”
    JJS-IJ Jewellers Choice Design Awards - 2016

•   “TV CAMPAIGN OF THE YEAR”
    12th Gemfields Retail Jeweller India Awards - 2016

•   “DIAMOND JEWELLERY OF THE YEAR”
    12th Gemfields Retail Jeweller India Awards - 2016

•   “BEST NECKLACE DESIGN AWARD– 2016 ”
     JJS-IJ Jewellers’ Choice Design Award - 2016

•   “ASIA’S MOST POPULAR BRANDS – 2014 ”
    World Consulting & Research Corporation (WCRC) - 2014

•   “BEST JEWELLERY COMPANY AWARD”
    Gems & Jewellery Trade Council of India Excellence Awards -
    2014
                                                                  31
Saurav Banerjee                      Manasi Bodas / Chintan Mehta
Chief Financial Officer              IR Consultant
Tribhovandas Bhimji Zaveri Limited   Dickenson
+91 022 30735000                     +91 9821043510 /9892183389
saurav.banerjee@tbzoriginal.com      tbz@dickensonworld.om

                                                                    32
You can also read