Q3 2021 Results Orri Hauksson, CEO Óskar Hauksson, CFO 26 October 2021 - Sign in
←
→
Page content transcription
If your browser does not render page correctly, please read the page content below

Q3 2021 Results
Orri Hauksson, CEO
Óskar Hauksson, CFO
26 October 2021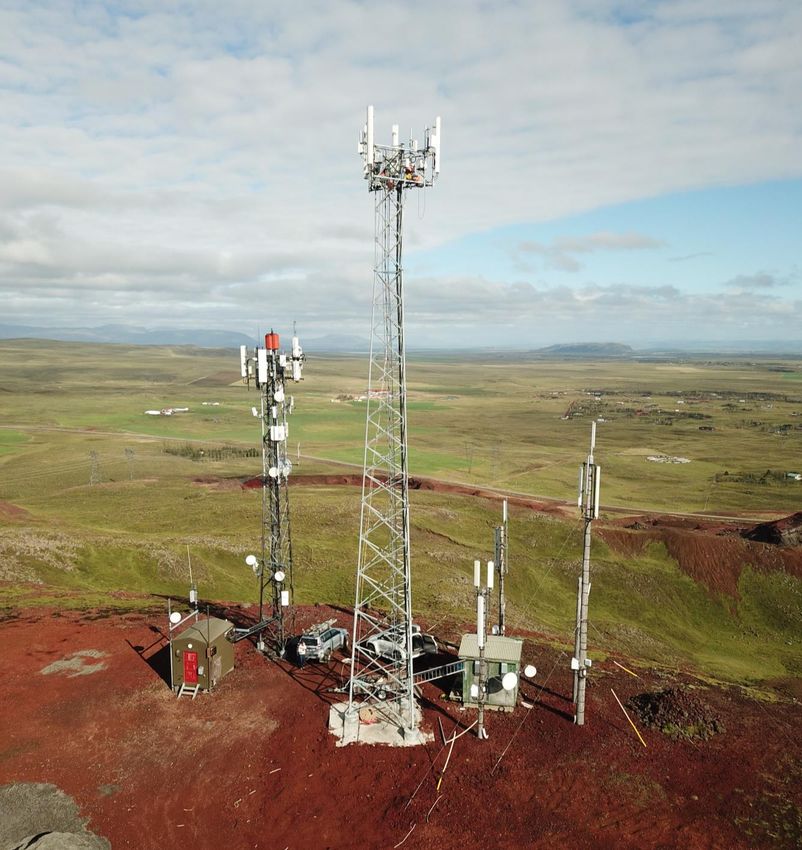
Highlights in Q2 and 1H 2021
                                                                                              Q3 2021
                       Q3 2021                              9M 2021                         • Extremely strong performance in Q3, with
                                                                                              EBITDA increasing by 6% between periods
 Revenue              6.381 m.kr.                           19.141 m.kr.                      and EBIT by 14%.
                    Q3 2020: 6.420 m.kr.              9M 2020: 18.943 m.kr.
                                                                                            • Optimization measures from last year result in
                      2.974 m.kr.                           8.071 m.kr.                       a 4.5% reduction in costs from Q3 last year.
 EBITDA *
                    Q3 2020: 2.805 m.kr.               9M 2020: 7.743 m.kr.                 • Revenues from mobile services increase by
                                                                                              over 11% due to increase in roaming income
EBITDA % *                46,6%                                42,2%                          of foreign tourists and the success of Þrenna
                      Q3 2020: 43,7%                        9M 2020: 40,9%                    among other things.

                      1.526 m.kr.                           3.774 m.kr.                       - Since the first quarter of this year, revenue
   EBIT *                                                                                       from mobile services has increased by 200
                    Q3 2020: 1.338 m.kr.               9M 2020: 3.364 m.kr.
                                                                                                m.kr.

  CAPEX               1.098 m.kr.                           3.689 m.kr.                     • Equipment sales are declining, which is
                    Q3 2020: 1.013 m.kr.               9M 2020: 4.129 m.kr.                   explained by increased travel by Icelanders
                                                                                              abroad.
NIBD / 12M                                                            Cash generated by     • Revenues from Internet and Network
                      Cash                 Equity Ratio                   operation
 EBITDA *                                                                                     decreases, but a turnaround in Q4 is
                                                                                              expected.
   2,45          6.952 m.kr.                  45,0%                    2.968 m.kr.
Q4 2020: 1,94   Q4 2020: 735 m.kr.         Q4 2020: 57,2%            Q3 2020: 2.213 m.kr.                               * Without government fine in Q2/Q4 2020
Operation
Income Statement
Income statement                                   Q3                           9M                      Operation Q3 2021
                                          2021      2020       %        2021         2020      %
Net sales                               6.381      6.420     -0,6%   19.141      18.943       1,0%   • Operating income increases by 1% in the first
Cost of sales                          ( 2.993)   ( 3.143)   -4,8%   ( 9.360)   ( 9.295)      0,7%     9 months of the year compared to the same
Operating expenses                     ( 1.862)   ( 1.939)   -4,0%   ( 6.007)   ( 6.784)    -11,5%     period in 2020
EBIT                                    1.526      1.338     14,1%    3.774       2.864      31,8%
                                                                                                       - Revenues from mobile services increases by over
Net financial items                     ( 218)     ( 143)    52,4%    ( 720)      ( 561)     28,3%
                                                                                                         6%, mainly due to success of the prepaid service
Income tax                              ( 251)     ( 233)     7,7%    ( 619)      ( 565)      9,6%       Þrenna and increased revenues from value-
Net profit from continuing operation    1.057        962     9,9%     2.435       1.738     40,1%        added services. Roaming income remains the
Discontinued operation                       0         52             2.124          123                 same between years.
Net profit                              1.057      1.014     4,2%     4.559       1.861     145,0%
                                                                                                     • Performance improvement from 2020
EBITDA                                  2.974      2.805      6,0%    8.071       7.243      11,4%
EPS                                      0,15       0,11     36,4%     0,59          0,21   181,0%     - Adjusted for 500 m.kr. Government fine in Q2
                                                                                                         2020, EBITDA increases by over 4%, EBIT by over
                                                                                                         12% and profit from continuing operations by
                                                                                                         almost 9%.
                                                                                                       - Financial expenses increase due to increased
                                                                                                         Míla indebtedness and the cost of refinancing
                                                                                                       - The cost of the Míla sales process is booked as a
                                                                                                         prepaid expense in the balance sheet

                                                                                                                                * Without government fine in Q2/Q4 2020
Revenue by segments

Segments                        Q3                               9M
                     2021    2020 Change      %      2021     2020 Change       %
Mobile               1.563   1.406   157   11,2%     4.362    4.110   252     6,1%
Fixed voice           382     423    -41    -9,7%    1.181    1.299   -118    -9,1%
Internet & network   2.199   2.227   -28    -1,3%    6.645    6.600    45     0,7%
TV                   1.540   1.531     9    0,6%     4.728    4.614   114     2,5%
Equipment sales       478     567    -89   -15,7%    1.509    1.482    27     1,8%
Other revenue         219     266    -47   -17,7%     716      838    -122   -14,6%
Total revenue        6.381   6.420   -39    -0,6%   19.141   18.943   198     1,0%
Operation in 9M 2021
Good results are largely due to cost reductions

• Costs decrease between years despite considerable inflation.
     • Wage expenses decrease by 355 m.kr. or almost 8%, which is due to the reduction of FTEs in 2020 and outsourcing of
       software development.
     • Outsourcing has not, however, resulted in an increase in IC expenses.
     • Marketing expenses have been increased to boost future revenue
• Expectations of revenue growth in key products have materialized so far this year.
     • Revenue from Internet and Network is expected to increase in Q4 after a small decrease in Q3.
     • TV services with steady but declining revenue growth.
          • In particular, the Premium product is behind the growth and Síminn Sport is growing as well.
          • Competition is intensifying due to changes in the focus of many direct-to-consumer DTC producers.
          • Declining revenue in foreign TV stations and VOD service.
     • The shortage of TV content due to COVID-19 has less effect today, which strengthens the TV content that Síminn can
       offer. In addition, there is a lot of exciting Icelandic content in the pipeline.
• The exchange rate loss in the first 9 months of the year is due to a final settlement of an older TV content
  rights in Q1 2021.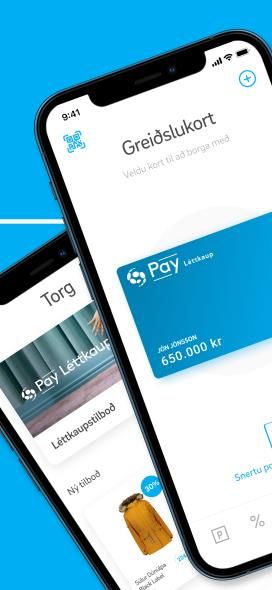
Balance Sheet and Cash Flow
Balance Sheet
Assets                                                                        30.09.2021   31.12.2020   Equity and liabilities                                                        30.09.2021   31.12.2020

Non-current assets                                                                                      Equity
Property, plant and equipment..................................                  19.273       18.991    Total equity...............................................................      31.301        37.298
Right-of-use assets....................................................           5.051        5.378
                                                                                                        Non-current liabilities
Intangible assets........................................................        31.725       32.544
                                                                                                        Borrowings................................................................       24.878        14.289
Other non-current assets...........................................                 624          544
                                                                                                        Finance lease.............................................................        4.790         5.066
                                          Non-current assets                     56.673       57.457
                                                                                                        Deferred tax liabilities...............................................             343           670
Current assets                                                                                                                                  Non-current liabilities                  30.011        20.025
Inventories................................................................       1.288        1.127
                                                                                                        Current liabilities
Accounts receivables.................................................             2.464        3.147
                                                                                                        Bank loans.................................................................       1.518           500
Other current assets..................................................            2.108          834
                                                                                                        Accounts payables.....................................................            2.392         2.554
Cash and cash equivalents.........................................                6.952          735
                                                                                                        Current maturities of borrowings...............................                   1.286         1.663
Assets held for sale....................................................              0        1.906
                                                                                                        Other current liabilities.............................................            2.977         2.390
                                                   Current assets                12.812        7.749
                                                                                                        Liabilities held for sale...............................................              0           776
                                                                                                                                                         Current liabilities              8.173         7.883

                                                        Total assets             69.485       65.206                                          Total equity and liabilities               69.485        65.206

                                                                                                                                                                                                     * Without government fine in Q2/Q4 2020
                                                                                                                                                                                                            Lease liabilities included from 2019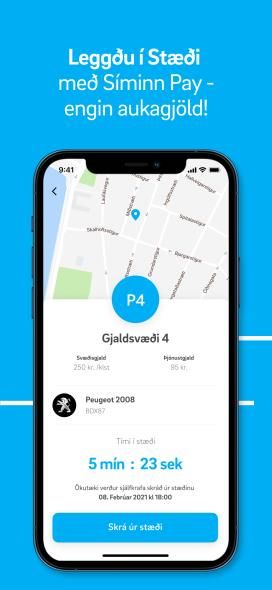
Cash Flow
                      Cash Flow                                                                                              9M 2021     9M 2020
                      Cash flow from operating activities
                         Operating profit ................................................................................     3.774       2.864
                         Operational items not affecting cash flow:
                         Depreciation and amortisation...........................................................              4.297       4.379
                         Other items not affecting cash flow....................................................                  ( 1)        ( 4)
                                                                                                                               8.070       7.239

                         Changes in current assets and liabilitites............................................                  625       1.250
                                                                  Cash generated by operation                                  8.695       8.489

                         Net interest expenses paid during the period....................................                      ( 718)      ( 546)
                         Payments of taxes during the period..................................................                 ( 590)      ( 499)
                                                           Net cash from operating activities                                  7.387       7.444
                      Investing activities
                        Net investment in property, plant and equipments............................                         ( 3.689)    ( 4.129)
                        Other investment..............................................................................         ( 606)      ( 118)
                        Sale of subsidiary and discontinued operation...................................                       2.648         454
                                                                                          Investing activities               ( 1.647)    ( 3.793)
                      Financing activities
                         Dividend paid....................................................................................     ( 500)      ( 500)
                         Purchase of own shares......................................................................        ( 2.088)    ( 1.433)
                         Share capital reduction......................................................................       ( 7.968)          0
                         Payment of long term lease...............................................................             ( 363)      ( 420)
                         Net Financing activities......................................................................       11.389       ( 792)
                                                                                              Financing activities               470     ( 3.145)

                   Increase (decrease) in cash and cash equivalents ...............................                            6.210         506
                   Translation effects on cash.................................................................                    7          ( 9)
inning of the year Cash and cash equivalents at the beginning of the year......................                                  735         217

                         Cash and cash equivalents at the end of the period............................                        6.952         714     * Free cash flow consists of cash from operations before interest less investing activities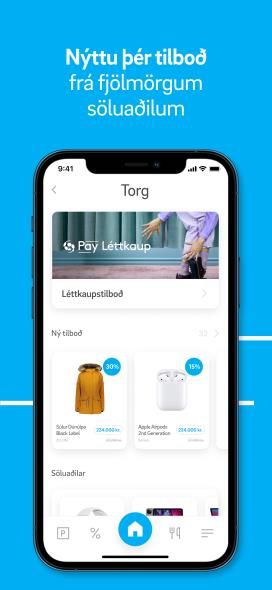
CAPEX
CAPEX

        Guidance

                   * Restated according to changes made to treatment of TV rights.
Highlights
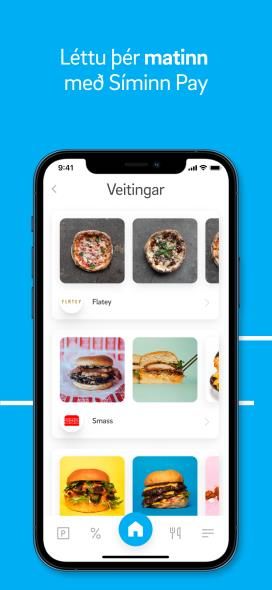
Síminn Pay
• Diverse app with many possibilities                        • Today there are 55,000 registered users
     • Loans - 14 days payment deadline or installment            • Half of the users are Síminn’s customers
       can be distributed up to 36 months                         • The average age of users is 36 years
     • Food hall - Order food at about 30 restaurants
                                                             • On average, there is a 10% increase in lending per
     • Parking - Registration of vehicles in a parking lot
                                                               month this year
     • Marketplace - Marketplace for retailers
Síminn
• Icelandic programming has never been more diverse
• Síminn is at the forefront of diverse and popular
Icelandic TV content.
• A number of new Icelandic series are already on Síminn
Premium TV for all age groups and new ones await
publication
• Birta
• Venulegt fólk
• Brúðkaupið mittSíminn
• A new sustainability policy was adopted this summer
• Environmentally friendly supply chain and an active
circular economy
• Equality and labor force training
• Cyber security and language technology
• Good corporate governance and business ethics
• Síminn has prioritized three Sustainable Development
Goal
• Satisfied customers
• Síminn has set the goal of having the most satisfied
customers in 2022. Síminn
• All operations take this goal into account, both for
employees who are in direct contact with customers as All
well as other employees.
Quarterly development of Síminn's customer image index since the beginning of 2017.
• Measurements over the past few months show that Gallup
Síminn is on the right track, both in terms of image and
NPS measurements.Míla
• Fiber installation of homes in Iceland
• In September, fiber-optic-connected spaces in the country
reached 103,600. Of these, 78,500 are in the capital area.
• Increased emphasis has been placed on the installation
of fiber-optic cables in urban areas throughout the
country.
• Work was done on laying fiber-optic cables in
Reykjanesbær, Grindavík, Súðavík, Ísafjörður, Akureyri,
Húsavík, Akranes, Vestmannaeyjar, Hofsós, Höfn in
Hornafjörður, Reyðarfjörður, Eskifjörður, Fáskrúðsfjörður,
Neskaupsstaður and Egilsstaðir.
• In some places, a start-up fee is being charged.
• Mobile RAN
• The Installation of the 5G mobile network is in full swing
and there are now 19 5G mobile sites in use and their
number is steadily increasing.
• Míla built a new 30-meter mast at Seyðishólar which
increases services for cottage owners in Grímsnes, e.g.
with powerful 5G service.
Seyðishólar in GrímsnesMíla
• Renewal of the DWDM
• Míla has completed the selection of supplier for the
renewal of the DWDM system.
• Preparation has begun and it is estimated that work will be
done on replacing the system throughout next year.
• Following the replacement of the system, domestic
transmission capacity and flexibility will increase
significantly, which will support other upgrades to Míla’s
systems, e.g. fiber-optic installation and the development
of 5G nationwide.
• The power backup project
• Míla participated in the power backup project together
with Neyðarlínan and other telcos. The project involved
improving reserve power in rural areas to ensure better
uptime for telecommunications in the event of a prolonged
power outage.
• Power stations have been set up in many parts of the
country, as well as new and better batteries have been
installed. Connections have been installed in equipment
spaces for portable power stations that facilitate operation
in the event of a power outage.
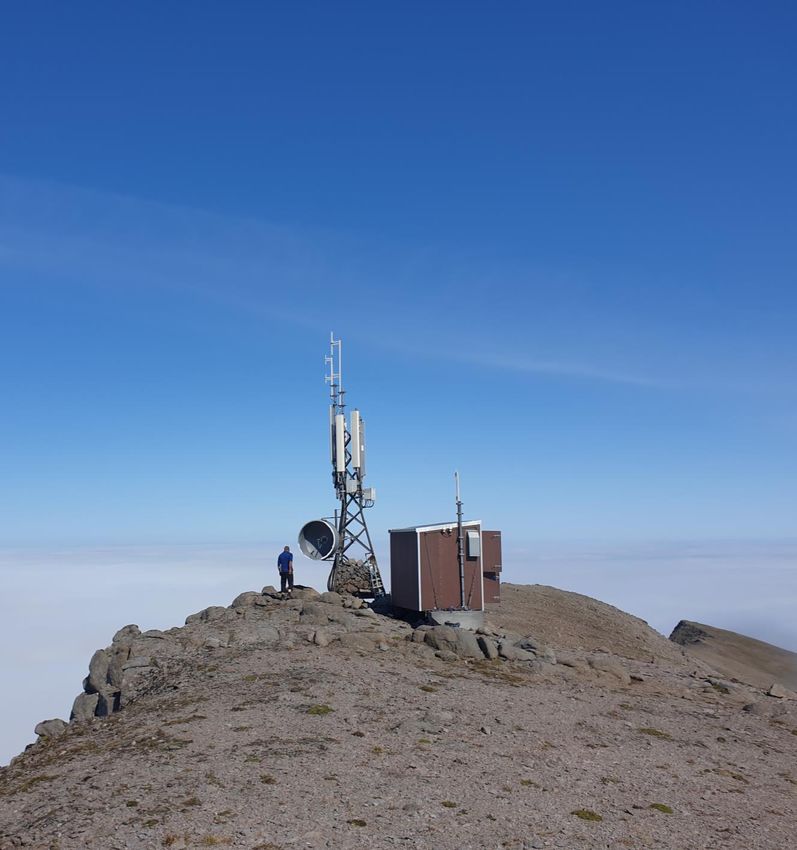
FinnbogastaðafjallSale of Míla to Ardian
Ardian acquires Míla

• At the beginning of the year, Síminn hired the investment bank Lazard and Íslandsbanki to advise on future
  possibilities and Míla policies considering international developments in the composition of telcos.
    • Future ownership of Míla would be examined.
    • The aim of the work was to maximize the value of Síminn's assets for shareholders.
• On 23 October Síminn signed an agreement for the sale of all holdings in Míla to Ardian.
    • The sale is subject to the normal conditions such as the Competition Authority's approval.
    • The EV is ISK 78 billion which is 17,1x EBITDAaL.
    • Síminn will be paid ISK 44 billion on the closing day in cash and ISK 15 billion in the form of a bond that Síminn lends
      to the buyer for three years. The bond is a one-off bond, bears market interest rates, is secured by shares in Míla and
      is transferable.
    • Estimated profit is just over ISK 46 billion considering the cost of the transaction.
• A 20-year wholesale agreement between Síminn and Míla
    • Detailed agreement for duration but based entirely on the companies' current business relationship.
    • The majority of Síminn's and Míla’s transactions are based on Fjarskiptastofa's price decisions.
    • Contracts for services that are outside the set of rules are mainly related to mobile and network operations that Míla
      purchased from Síminn earlier this year.
Ardian is a leading infrastructure investor in Europe
• Considerable investment in the Nordic countries
• Com Hem
• Nevel
• ISS
• ENordic
• Andberg Vind
• Lyrestad Holding
• Work closely with pension funds in the countries in
which they operate
• Long-term investment focus
• Accelerated investments
• Ardian has announced that it intends to accelerate
the installation of fiber-optic cables in rural areas.
• 5G deployment in Iceland will be faster than
previously planned.Ardian's $18 billion infrastructure fund has a threefold focus
Sale of Míla changes the Balance Sheet for the parent company

• Sale of Míla changes the balance           Síminn parent                                 2019     2020    09 2021 Míla sale 09 2021 PF
  sheet dramatically                         Non-current assets...............            58.001   58.453    34.485     4.607    39.092
    • Cash position will be strong           Current assets.......................         5.417    5.294    11.359    41.809    53.168
    • Opportunities for internal and         Assets....................................   63.418   63.747    45.844    46.416    92.260
      external growth                        - thereof Cash                                 165      708      5.888     41.809    47.697
    • Book value of Míla is ISK 11 billion
                                             Equity....................................   36.827   37.448    31.573    47.107    78.680
• Bond of ISK 15 billion among Non-
  current assets                             Non-current liabilities...........           19.265   18.790     7.283         0     7.283
                                             Current liabilities..................         7.326    7.509     6.988      -691     6.297
    • Bond is in ISK and can be cashed in
                                             Equity and liabilities...........            63.418   63.747    45.844    46.416    92.260
• Sale of Míla has no changes for            - therof lease liabilities                    4.643    4.802     1.520                1.520
  Síminn‘s operating profit
    • EBITDA forcast for Síminn (parent)     Equity ratio                                 58,1%    58,7%     68,9%                85,3%
      for the year 2021 is ISK 5,4 – 5,6
      billion
Outlook for 2021
Outlook 2021
Good outlook for the rest of the year

• The operating result for the year has been good and strengthened as the year progresses.
• Innovations in TV services, sales over GR's networks and stability in the coming years in EPL TV rights form a
  good basis for the sales operations in coming months.
• Good cost control – Exchange rate stability is important considering the increasing importance of
  outsourcing abroad.
• Míla will be part of the group in the coming months.
• The EBITDA result for the year is likely to be at the upper limit of the earnings forecast.
• Investments will be within the forecast range this year.
Guidance for 2021

                         2021

            EBITDA                         ISK 10,2 - 10,6 billion

                         2021

            CAPEX                            ISK 5,1 – 5,4 billion

                     Consolidated EBITDA excl. Sensa and ISK 200 million fine was ISK 10.156 million in 2020
                     Consolidated CAPEX excl. Sensa was ISK 5.643 million in 2020
Shareholders
Shareholders
                                                             Shareholders
                                                           • Share buyback
                                                             - The Board has agreed to purchase for up to ISK 2
                                                               billion with share buyback.
                                                             - The buyback program began at the beginning of
                                                               May and just over ISK 1,5 billion has already
                                                               been purchased.

                                                           • Around 1.150 shareholders

Shareholders 20.10.2021               Position    % O/S      - Number of shareholders has increased by a third
                                                               so far this year.
Stoðir hf.                        1.162.220.631   15,41%
Lífeyrissjóður verzlunarmanna       868.257.927   11,52%   • Síminn’s share price has increased by 50%
Lífeyrissj.starfsm.rík. A-deild     744.000.000    9,87%
Gildi - lífeyrissjóður              612.192.195    8,12%
                                                             since the beginning of 2021.
Íslandsbanki hf,safnskráning 2      396.693.435    5,26%
Brú Lífeyrissjóður starfs sveit     305.650.161    4,05%
Stapi lífeyrissjóður                300.051.432    3,98%
Birta lífeyrissjóður                276.946.563    3,67%
Lífeyrissj.starfsm.rík. B-deild     261.618.000    3,47%
Söfnunarsjóður lífeyrisréttinda     251.575.320    3,34%
Top 10 shareholders               5.179.205.664   68,69%
Other Shareholders                2.199.192.406   29,17%
Shares outstanding                7.378.398.070   97,86%
Own shares                          161.601.930   2,14%
Total number of shares            7.540.000.000    100%
Appendix
Business segments • Mobile: Revenue from mobile services in Iceland and abroad, whether traditional GSM service, satellite service or other mobile service. • Fixed voice: Revenue from fixed voice service (fees and traffic). • Internet & network: Revenue from data service, incl. xDSL service, GPON, Internet, IP net, core network, local loop and access network. • TV: Revenue from TV broadcast and distribution and Síminn TV (fees, traffic and advertisement). • Equipment sales: Revenue from sale of telco equipment. • Other revenue: Revenue from i.e. sold telco service, IT and hosting.
Disclaimer

Information contained in this presentation is based on sources that Síminn hf. (“Síminn” or the “company”)
considers reliable at each time. Its accuracy or completeness can however not be guaranteed. This report contains
forward-looking statements that reflect the management’s current views with respect to certain future events and
potential financial performance. Although the management believe that the expectations reflected in such forward-
looking statements are reasonable, no assurance can be given that such expectations will prove to have been correct.
The forward-looking information contained in this presentation applies only as at the date of this presentation.
Síminn does not undertake any obligation to provide recipients of this presentation with any further information
on the company or to make amendments or changes to this publication should inaccuracies or errors be discovered
or opinions or information change. Other than as required by applicable laws and regulation.
This presentation is solely for information purposes and is not intended to form part of or be the basis of any
decision making by its recipients. Nothing in this presentation should be construed as a promise or recommendation.
Statements contained in this presentation that refer to the company’s estimated or anticipated future results
or future activities are forward looking statements which reflect the company’s current analysis of existing
trends, information and plans. Forward-looking statements are subject to a number of risks and uncertainties that
could cause actual results to differ materially depending on factors such as the availability of resources, the timing
and effect of regulatory actions and other factors.
By the receipt of this presentation the recipient acknowledges and accepts the aforesaid disclaimer and restrictions.
You can also read