CM CIC Market Solutions Forum May 20, 2021 - TAKKT AG

Page created by Julian Becker
 
CONTINUE READING
CM CIC Market Solutions Forum May 20, 2021 - TAKKT AG
CM CIC Market Solutions Forum
May 20, 2021
CM CIC Market Solutions Forum May 20, 2021 - TAKKT AG
Agenda

               1. Organization and business models
               2. Vision
               3. Strategy
               4. Financials first quarter 2021
               5. Outlook for 2021
               6. TAKKT dividend policy, share and equity story

TAKKT AG    May 2021                 CM CIC Market Solutions Forum   2
CM CIC Market Solutions Forum May 20, 2021 - TAKKT AG
Organization and business models

TAKKT AG   May 2021    CM CIC Market Solutions Forum   3
CM CIC Market Solutions Forum May 20, 2021 - TAKKT AG
TAKKT Group specializes in B2B distance selling for business equipment

TAKKT AG       May 2021               CM CIC Market Solutions Forum         4
CM CIC Market Solutions Forum May 20, 2021 - TAKKT AG
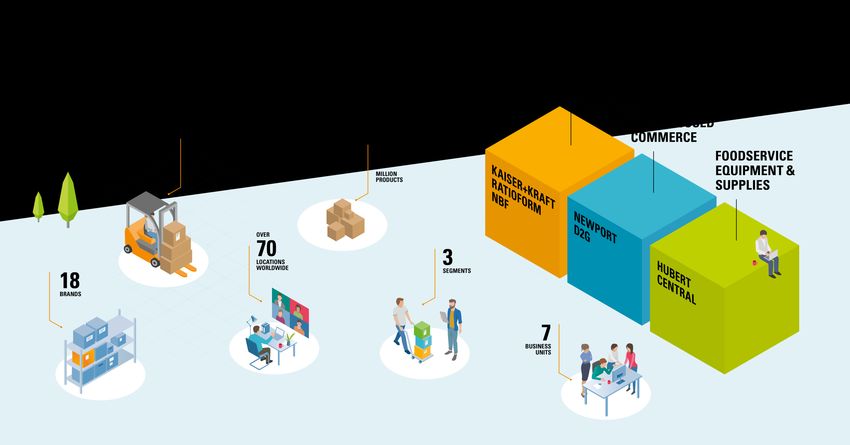
TAKKT Group structure

TAKKT AG      May 2021     CM CIC Market Solutions Forum   5
CM CIC Market Solutions Forum May 20, 2021 - TAKKT AG
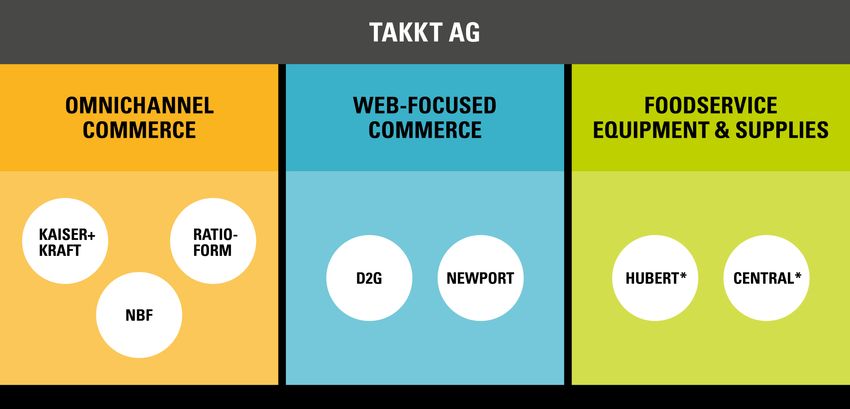
Our business units are product specialists and sell equipment and specialties with an
   overall average order value of 425 EUR
                                                                                          Foodservice Equipment &
             Omnichannel Commerce                       Web-focused Commerce
                                                                                                  Supplies

       Kaiser+
                     ratioform       NBF                Newport                 D2G         Hubert        Central
        Kraft

        plant,         packaging     office             new business            display   merchandising   restaurant
    warehouse and      solutions   equipment             models and            products     and food      equipment
        office                                            start-ups                        equipment
     equipment

TAKKT AG            May 2021                   CM CIC Market Solutions Forum                                           6
Our segments are positioned with a clear focus on two distinct customer types

            Typical customers                             Customer & segment characteristics
                                                             Omnichannel Commerce → Value add service

                                       Customer requirements:                          Omnichannel positioning:
                                       • More complex requirements                     • Comprehensive range of services
                                       • Very efficient procurement process            • Personalized purchasing advice
                 Corporates            • Excellent product quality and                 • Carefully curated product range
                                         comprehensive service                         • Customer-specific solutions
                                       • Looking for reliable and established          • Mix of marketing channels
                                         partner for procurement                         (online, print, sales reps)
                Small- and
               medium-sized                                → High share of business with existing customers
                enterprises
                                                              Web-focused Commerce → Value for money

                                       Customer requirements:                         Web-focused positioning:
                                       • Less complex requirements                    • Entry-level priced products
                                       • More price-conscious                         • Quick and easy digital searching
                  Businesses           • Entry level products are often                 and ordering process
           with less complex needs       sufficient                                   • Focus on online marketing

                                                                → High share of new customer business

TAKKT AG         May 2021             CM CIC Market Solutions Forum                                                        7
Vision

TAKKT AG   May 2021   CM CIC Market Solutions Forum   8
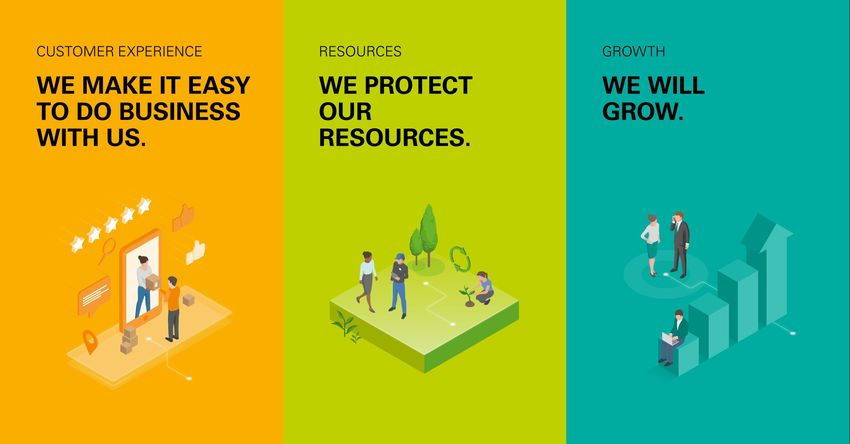
TAKKT AG   May 2021   CM CIC Market Solutions Forum   9
TAKKT AG   May 2021   CM CIC Market Solutions Forum   10
Strategy

TAKKT AG   May 2021     CM CIC Market Solutions Forum   11
TAKKT has set new ambitions in certain areas to be achieved by 2025

           Grow profitably             Transform the business model                   Act sustainably

  • Long-term organic sales growth   • Organizational realignment with      • Share of women in top
    of around 5% per year              focus on two business models           executive positions of at least
                                                                              30 percent
  • Additional growth through        • Above-average organic
    acquisitions                       e-commerce growth                    • Share of sustainable products of
                                                                              over 20 percent
  • Sustainable increase in EBITDA   • Consistently high
                                       recommendation in customers          • 100 percent carbon-neutral
                                       and employees (cNPS and eNPS)          print advertising and shipping
                                                                              processes

TAKKT AG          May 2021                  CM CIC Market Solutions Forum                                        12
Grow profitably:
   Organic growth and profitability ambitions differ between the three segments

                                       Long-term organic growth target
            3-5% p.a.               6-8% p.a.                               3-5% p.a.         5% p.a.
                                          Long-term EBITDA target
           around 15%              around 10%                          more than 10%    sustainable increase
                                                                                             in EBITDA

TAKKT AG                May 2021            CM CIC Market Solutions Forum                                      13
Grow profitably:
   Distance sellers gradually gaining market share

                                             omnichannel models         TAKKT companies either run a
                                                                        omnichannel or a web-focused
                                             web-focused models         model
           70-90%              10-30%

                                                                        TAKKT companies partially use
                                             platform models
                                                                        marketplaces as an additional sales
                                             (marketplaces)
                                                                        channel

           Local businesses                  Distance sellers

TAKKT AG            May 2021            CM CIC Market Solutions Forum                                         14
Grow profitably:
   M&A is an essential part of TAKKT´s growth story and focuses on two areas

           Strengthening of existing businesses                                     Expansion of the value proposition

  • Looking for additional product specialists in                       • Acquisition of smaller companies offering products
    attractive niche markets for an integration into                      or services that expand the existing range of
    one of the two segments                                               products or services for customers

  • Exploit synergies and improve the Group’s                           • For example solutions for manufacturing, refining or
    market position                                                       adapting products and enhanced service offerings

  • Primary goal is to have a positive development of                   • Primary goal is to improve the customer experience
    the business-specific value and growth drivers                        before, during or after the sale

 New organizational model with stronger integration of functions at the segment level (i.e. logistics, purchasing, IT) will
 lead to increased benefits for acquired companies and higher value generation than before

TAKKT AG            May 2021                        CM CIC Market Solutions Forum                                                15
Transform the business model:
   Continue with implementation of TAKKT 4.0

    Two business models for two different customer types

 Focus on a specific business model allows brands to better fulfill
 the requirements of their respective customer type.

                                            Reallocation of functions and responsibility

                                   Establish segment functions (Logistics, IT infrastructure and data &
                                   analytics) in WFC and OCC and Group finance function in 2021.

                                                                                          Strengthen the operational excellence

                                                                           Steering with a new operating model which defines core
                                                                           behaviors and processes across the Group.

TAKKT AG              May 2021                            CM CIC Market Solutions Forum                                             16
Transform the business model:
   Continue to push for above-average organic e-commerce growth

 Organic e-commerce growth (in percent)                                 Share of e-commerce in order intake (in percent)
                                   11.6%
    10.6%
                                                                                                                            60.0%
                 7.9%                                                                                 52.1%         55.0%
                                                                           43.9%        46.8%
                                           2.0%

                                                  -3.6%
    2016         2017              2018    2019   2020                      2016         2017         2018          2019    2020

TAKKT AG                May 2021                   CM CIC Market Solutions Forum                                                    17
Act sustainably:
   TAKKT has set new targets for 2025

                                                               • TAKKT achieved most of its sustainability
                                                                 goals for 2020

                                                               • Interim sustainability report gives an update
                                                                 on the Group’s progress and sets new targets
                                                                 for 2025

TAKKT AG       May 2021                 CM CIC Market Solutions Forum                                            18
Financials first quarter 2021

TAKKT AG   May 2021     CM CIC Market Solutions Forum   19
TAKKT showed good growth towards the end of the first quarter

 Sales (in EUR million)                                                EBITDA (in EUR million) and margin (in %)
             285.0                                                                                             26.5
                                     266.4                                       24.3

                                                                                        8.5%                          9.9%

             Q1/20                   Q1/21                                         Q1/20                           Q1/21

 • Sales decrease by 6.5% with negative effects from currency          • Earnings in Q1/20 negatively impacted by one-time expenses
   fluctuations (-3.2%), primarily from a weaker US-Dollar               for the implementation of TAKKT 4.0 (EUR 7.6 million)
 • Organic sales decline of 3.3%                                       • EBITDA was EUR 26.5 (24.3) millions, EBITDA margin at 9.9%
 • Order intake with a better development than sales and                 (8.5%)
   showing organic growth in Q1
 • Performance of the individual business units continued to
   vary due to the different impact of the pandemic

TAKKT AG                  May 2021                     CM CIC Market Solutions Forum                                                  20
Organic development at Omnichannel Commerce almost flat

 Sales (in EUR million)                                                EBITDA (in EUR million) and margin (in %)
                                                                                                               26.5
             175.1                   169.8
                                                                                 21.0
                                                                                                                      15.6%
                                                                                        12.0%

             Q1/20                   Q1/21                                         Q1/20                           Q1/21

 • Sales decrease by 3.1%; negative currency effects of 2.1%           • In Q1/20, one-time expenses for TAKKT 4.0 had a negative
 • Organic sales development at minus 1.0% only slightly                 impact on earnings (EUR 7.6 million)
   negative                                                            • EBITDA increased to EUR 26.5 (21.0) millions, EBITDA margin
 • ratioform with a strong performance and low double-digit              at 15.6% (12.0%)
   organic growth, KAISER+KRAFT and NBF still slightly
   negative with a low single-digit decline

TAKKT AG                  May 2021                     CM CIC Market Solutions Forum                                                   21
Very different development of business units in Web-focused Commerce continues

 Sales (in EUR million)                                                 EBITDA (in EUR million) and margin (in %)

              62.9                                                                 4.3
                                     57.4

                                                                                         6.9%
                                                                                                                    1.3
                                                                                                                          2.2%

             Q1/20                   Q1/21                                          Q1/20                           Q1/21

 • Sales decrease by 8.8% with negative effects from currency           • Decline in sales and a lower gross profit margin at D2G
   fluctuations (-3.2%)                                                   weighed on earnings
 • Organic sales decline of 5.6%, very different development of         • EBITDA was EUR 1.3 (4.3) millions, EBITDA margin at 2.2%
   the two business units continued                                       (6.9%)
 • Newport continues to show strong growth with double-digit
   organic increase, D2G with significant double-digit organic
   decline

TAKKT AG                  May 2021                      CM CIC Market Solutions Forum                                                22
Market environment in Foodservice Equipment & Supplies still impacted by the pandemic

 Sales (in EUR million)                                                EBITDA (in EUR million) and margin (in %)
                                                                                  2.7
              48.1                                                                                                 2.4
                                     40.3

                                                                                        5.6%                             6.1%

             Q1/20                   Q1/21                                         Q1/20                           Q1/21

 • Sales decrease by 16.2% with negative currency effects from         • Lower sales level results in slightly lower earnings
   a weaker US-Dollar (-7.5%)                                          • EBITDA was EUR 2.4 (2.7) millions, EBITDA margin at 6.1%
 • Organic sales decline of 8.7%, business environment in the            (5.6%)
   foodservice sector remained challenging due to the
   pandemic
 • Central with low single-digit organic decline, Hubert with
   double-digit organic decline

TAKKT AG                  May 2021                     CM CIC Market Solutions Forum                                                23
TAKKT cash flow on the same level as last year

 TAKKT cash flow (in EUR million) and margin (in %)                             in EUR million                       Q1/20   Q1/21
                                                                                profit                                 9.3   11.9
            22.1                                  22.4
                                                                                + depreciation                       +10.0   +9.3
                                                                                +/- deferred taxes expense/income     +0.7   +0.5
                                                                                +/- other non-cash expenses/income    +2.1   +0.7
                                                                                TAKKT cash flow                       22.1   22.4
                     7.8%                                 8.4%
                                                                                in EUR million                       Q1/20   Q1/21
                                                                                EBITDA                                24.3   26.5
              Q1/20                                   Q1/21                     - financial result                    -1.7    -1.4
                                                                                - current taxes                       -2.6    -3.4
                                                                                +/- other non-cash expenses/income    +2.1   +0.7
                                                                                TAKKT cash flow                       22.1   22.4

TAKKT AG                May 2021                              CM CIC Market Solutions Forum                                          24
Cash flow generation

 in EUR million                                    Q1/20               Q1/21

 TAKKT cash flow                                      22.1                22.4

 Change in net working capital as well as other
                                                     -11.2                +1.6    • Hardly any change in net working capital in
 adjustments
                                                                                    Q1/21. Last year, inventories increased by
 Cash flow from operating activities                  10.9                24.0      around EUR 9 million, in part due to
                                                                                    adjustment of product range to pandemic
 Capital expenditure in non-current assets            -3.9                 -3.0   • Capital expenditure slightly lower than prior
                                                                                    year
 Proceeds from disposal of non-current assets         +0.3                +0.1

 Free TAKKT cash flow
 (for acquisitions, payout to shareholders and         7.3                21.1
 loan repayments)

TAKKT AG             May 2021                     CM CIC Market Solutions Forum                                                     25
Balance sheet

 Net financial liabilities (in EUR million)                            Equity ratio (in %)
           75.4                                                                    64.7%                     65.4%

                                              56.7

           12/31/2020                     03/31/2021                           12/31/2020                  03/31/2021

 • Further decrease in net financial liabilities                       • Equity ratio increased slightly
 • Cash and short-term deposits of EUR 24.0 million

TAKKT AG                   May 2021                    CM CIC Market Solutions Forum                                    26
Outlook for 2021

TAKKT AG   May 2021    CM CIC Market Solutions Forum   27
Organic sales growth

 Organic growth                              Q1/20                  Q2/20                 Q3/20                     Q4/20   2020     Q1/21

 TAKKT Group                                -10.1%                 -21.2%                 -12.2%                    -3.6%   -11.8%   -3.3%

 Omnichannel Commerce*                      -10.3%                 -27.9%                 -14.6%                    -1.6%   -13.6%   -1.0%

 Web-focused Commerce                        -3.8%                  -9.2%                  -6.5%                    -5.6%   -6.3%    -5.6%

 Foodservice Equipment &
                                            -15.9%                 -13.1%                 -11.1%                    -8.3%   -12.2%   -8.7%
 Supplies*

* New segment structure implemented in 2021. The table shows the pro forma figures for 2020 in the new structure.

TAKKT AG             May 2021                                           CM CIC Market Solutions Forum                                        28
Outlook: TAKKT expects strong growth and significant earnings increase in 2021

           Economic environment                          Strategic focus                  Outlook for key financials

 •    Economic development still            •   Implementation of strategic
      dependant on course of the                initiatives to drive organic growth in     Organic sales growth of
      pandemic.                                 the business units.                       between 7 and 12 percent
 •    Substantial recovery expected with    •   Development of segment structures
      an increase in vaccinations in all        in OCC and WFC. In both segments,
      target markets. US will most likely       IT infrastructure, logistics and data &      EBITDA between
      show a faster pace than Europe.           analytics will be centrally               EUR 100 and 120 million
                                                coordinated and managed.

TAKKT AG               May 2021                      CM CIC Market Solutions Forum                                     29
TAKKT dividend policy, share and
             equity story

TAKKT AG   May 2021    CM CIC Market Solutions Forum   30
Dividend policy: Reliable and consistent payouts to shareholders

                                        Dividend policy                                                     Latest dividend

   •     Payout ratio within a corridor of 35 to 45 percent of the profit                       Dividend payment of EUR 0.55 for 2020 plus
                                                                                                previous year’s suspended base dividend of
   •     TAKKT aims for a consistent and reliable dividend stream                               another EUR 0.55.
   •     Willingness to return funds to shareholders via a special dividend when
         equity ratio is high and funds cannot be reinvested.

Dividend per share in Euro
                                                                                                                                      1.10
                     0.85                                                                                      0.85

                                                                        0.50             0.55      0.55

       0.32                         0.32       0.32       0.32

                                                                                                                          0.00

       2010          2011           2012       2013       2014          2015             2016      2017       2018        2019        2020

TAKKT AG                     May 2021                        CM CIC Market Solutions Forum                                                   31
TAKKT share performance, shareholder structure and analyst recommendations

 Total Shareholder Return: TAKKT and indices                                     Shareholder structure
150

                                                                                                                    Franz Haniel &
125                                                                                 49.8%              50.2%        Cie.
                                                                                                                    Free float

100

 75                                                                              Analyst recommendations

 50                                                                                       2
                                                                                                                      Buy
 25                                                                                                                   Hold
                                                                                                       6

                                TAKKT     DAX   MDAX            SDAX
                                                                                 Average price target of EUR 15.0

TAKKT AG             May 2021                    CM CIC Market Solutions Forum                                                   32
TAKKT equity story at a glance

                           TAKKT’s business units are B2B direct-marketing                   Gross profit margin > 40% (target)

                  specialists for business equipment in Europe and North America              38.5%       40.5%       41.4%         42.6%      39.7%

                   Business units are market-leaders in attractive market niches               1999        2003       2008          2015           2020

                                   with high operational margins                             EBITDA margin 12-15% (target)

                                                                                                                      14.3%         14.8%
                                                                                              11.2%       11.2%
                                                                                                                                               8.7%

           Growth opportunities through organic initiatives (Digitalization and TAKKT 4.0)
                               as well as upside from acquisitions                             1999        2003       2008          2015           2020

                                                                                             TAKKT cash flow margin > 8% (target)

                                                                                                                      10.4%         10.7%
                                                                                              7.4%         7.3%                                7.7%
                                   Sustainable increase in EBITDA
                                                                                               1999        2003       2008          2015           2020

                                                                                             Reliable dividend payouts (in EUR)
                                                                                                                               Dividend       EPS
                            Business model generates high free cash flows
                                                                                                                      1.47
                                and allows attractive dividend payouts                            1.24
                                                                                                            1.39                1.34
                                                                                                                                            1.14          1.10
                                                                                                                                0.85
                                                                                                  0.50      0.55      0.55                                0.57
                                                                                                                                            0.00

       Stable, long-term oriented shareholder structure with Franz Haniel & Cie. GmbH         2015       2016      2017      2018      2019        2020

                                   as majority shareholder

TAKKT AG                May 2021                       CM CIC Market Solutions Forum                                                                         33
TAKKT investor relations

                                 IR Contact                                                                    Upcoming Events
   Michael Loch / Benjamin Bühler                                                               June
   Phone:    +49 711 3465-8222 / -8223                                                          8 Erste Group Consumer Conference (virtual)
   Fax:      +49 711 3465-8100
   e-mail:   investor@takkt.de                                                                  July
                                                                                                29 Earnings Call Q2
   www.takkt.com
   TAKKT AG is headquartered in Stuttgart, Germany.

                         Basic data TAKKT share                                                  Historic share price development (Xetra)
   ISIN / WKN / Ticker    DE0007446007 / 744600 / TTK                                                                                                            16
                                                                                                                                                TAKKT AG
                                                                                                                                                                 14
   No. shares             65,610,331
                                                                                                                                                                 12
   Type                   No-par-value bearer shares
                                                                                                                                                                 10
   Share capital          EUR 65,610,331
                                                                                                                                                                 8
   Listing                September 15, 1999
                                                                                                                                                                 6
   Index                  SDAX, prime standard
                                                                                                                                                                 4
   Designated sponsors    Pareto Securities, Oddo Seydler, Hauck & Aufhäuser              May          Jul     Sep      Nov      Jan      Mar              May

TAKKT AG                   May 2021                                    CM CIC Market Solutions Forum                                                                 34
Appendix:
             Key performance figures and
             indicators

TAKKT AG   May 2021    CM CIC Market Solutions Forum   35
Overview of key performance figures and indicators

           Financial key figures                  Product range figures                 Digital agenda indicators
  •    Organic sales development            •   Share of private labels             •   Launched and completed measures
  •    Number of orders and average order   •   Share of direct imports             •   Newly created positions
       value                                                                        •   Additional personnel expenses
  •    Gross profit margin                                                          •   Other expenses
  •    EBITDA                                                                       •   Capital expenditure and start-up
  •    TAKKT cash flow                                                                  investments
  •    Free TAKKT cash flow                                                         •   Organic e-commerce growth
  •    Capital expenditure ratio                                                    •   Share of e-commerce in order intake

           Value-based figures                      Internal covenants                  Sustainability indicators
  •    TAKKT value added                    •   Equity ratio                        •   A total of 16 indicators across the six
  •    Return on Capital Employed (ROCE)    •   Debt repayment period                   focus areas sourcing, marketing,
                                            •   Interest cover                          logistics, resources & climate,
                                            •   Gearing (debt-equity ratio)             employees and society

TAKKT AG               May 2021                     CM CIC Market Solutions Forum                                                 36
Financial key figures

                                                      2016              2017    2018    2019    2020

 Organic sales development in percent                    5.2              0.4     3.4    -1.4   -12.0

 Number of orders in thousand                        2,409              2,465   2,676   2,642   2,535

 Average order value in EUR                             469              458     449     460     425

 Gross profit margin in percent                        42.6              42.5    41.5    41.3    39.7

 EBITDA in EUR million                               171.3              150.3   150.1   150.2    92.6

 TAKKT cash flow in EUR million                      125.6              109.1   120.8   120.4    82.0

 Free TAKKT cash flow in EUR million                 101.4               73.0    82.7   107.1   129.8

 Capital expenditure ratio in percent                    1.5              2.1     1.8     1.8     1.2

TAKKT AG              May 2021          CM CIC Market Solutions Forum                               37
Free cash flow with a more stable development than EBITDA

Development of EBITDA and free cash flow (in EUR million)

                                                                                                              •   High free cash flow in 2020
 160                                                                                                              due to release of cash from
                                                                                                                  net working capital and low
                                                                                                                  capex spending
 120
                                                                                                              •   Sale of real estate contributed
                                                                                                                  an additional EUR 22.6 million
                                                                                                                  to free TAKKT cash flow
  80

  40

    0
        2000   2002      2004    2006      2008   2010        2012        2014           2016   2018   2020
                                        EBITDA       Free cash flow

TAKKT AG              May 2021                           CM CIC Market Solutions Forum                                                          38
Product range figures

Share of private labels* (in %)                                                                      Share of direct imports* (in %)

                                                                                                                                                              22.0%            21.7%
                                                         24.1%             24.2%
                      20.7%             21.7%                                                                                               17.9%
     18.3%                                                                                                                 15.5%
                                                                                                         13.7%

     2016              2017             2018              2019              2020                          2016             2017              2018             2019              2020

* The figures have only been reported as shares of sales for 2019 and 2020. For prior years, they are shown as shares of order intake (private label) and purchase volume (direct imports)

TAKKT AG                        May 2021                                           CM CIC Market Solutions Forum                                                                             39
Digital agenda indicators

 Newly created positions filled                                                 Organic e-commerce growth (in percent)
                                                                                                         11.6%
                                                                                  10.6%
                                                                                                 7.9%
                           98
                                             85     87
              78
                                                                                                                  2.0%

   26

                                                                                                                            -3.6%
   2016       2017         2018          2019       2020                           2016          2017    2018     2019       2020

Launched and completed measures                                                  Share of e-commerce in order intake (in percent)
                                  157             162
                                                                                                                            60.0%
                                                    123                                                  52.1%   55.0%
                114                                                                              46.8%
   100                                                                            43.9%
                                        92

                      44
         27
                                                           Launched
                                                           Completed
    2017           2018           2019            2020                             2016          2017    2018     2019       2020

TAKKT AG                     May 2021                            CM CIC Market Solutions Forum                                      40
TAKKT invested around € 51 million until 2020 for the implementation of the digital
   agenda and additional € 11 million for start-up investments

 In EUR million                                                 2016            2017   2018   2019   2020
 Additional personnel expenses (year-on-year)                     0.6            3.9    2.9    0.7   -0.6
 Other expenses                                                   1.9            3.8    4.0    2.9    2.1
 Capital expenditure                                              1.4            8.7    8.4    6.0    4.7
 Digital agenda cost (investment view)                            3.9           16.5   15.3    9.6    6.2

 Personnel expenses (cumulative)                                  0.6            4.4    7.3    8.0    7.4
 Other expenses                                                   1.9            3.8    4.0    2.9    2.1
 Digital agenda cost (EBITDA impact)                              2.5            8.3   11.3   10.9    9.5

 TAKKT Start-up investments                                       1.0            4.5    2.3    3.0    0.3

TAKKT AG               May 2021                 CM CIC Market Solutions Forum                           41
Value-based figures

TAKKT value added (in EUR million)                                                     Return on Capital Employed (in %)

                                                                                          16.5%
                    50.4*                                                                             14.6%      14.0%
     46.8*
                     7.3            37.6 *                                                                                 11.1%
      8.5
                                     7.2
                                                     15.9*                                                                         5.6%
     38.3           43.1
                                    30.4              6.1
                                                      9.8     2020

     2016           2017            2018            2019      -18.7 *                      2016       2017        2018     2019    2020

 * Adjusted for amortization of intangible assets resulting    -4.5
 from acquisitions and the related tax impact.                -23.2

 •    Due to the significantly lower earnings during the pandemic, the value-based figures also decreased significantly

TAKKT AG                    May 2021                                  CM CIC Market Solutions Forum                                       42
Internal covenants within or exceeding the target range

 Equity ratio (in %)                                                              Debt repayment period (in years)
                                                                                                                                   Internal target value:
                                            64.7%
             61.2%     60.8%        58.5%                                                                                          < 5 years
  55.2%
                                                    Internal target range:
                                                    30 to 60 percent                 1.6                             1.7
                                                                                                  1.4    1.4                1.4

  2016        2017     2018     2019        2020                                    2016          2017   2018        2019   2020

 Interest cover                                                                   Gearing
                       23.8                                                                                                        Internal target value:
                                                                                                                                   < 1.5
   18.3
              16.3                  16.7

                                            11.0
                                                                                     0.3                             0.3
                                                                                                  0.2    0.2
                                                    Internal target value:                                                  0.1
                                                    >4

  2016        2017     2018     2019        2020                                    2016          2017   2018        2019   2020

TAKKT AG                 May 2021                                 CM CIC Market Solutions Forum                                                             43
Sustainability indicators

 Focus area*     Key figure                                                                                 2017    2018    2019     2020
                 Share of sourcing volume from certified suppliers                                          46.8%   44.2%   51.6%    49.1%
 Sourcing        Share of direct imports sourcing volume from certified suppliers                           39.8%   39.3%   60.2%    54.2%
                 Share of sales from sustainable product ranges                                              9.3%    9.5%    9.5%    10.8%
                 Carbon-neutral web shops for major companies                                                  7      12      17       15
 Marketing       Paper consumption print advertising materials per order                                    5.4kg   4.2kg   3.0kg    2.8kg
                 Share of carbon-neutral advertising materials                                              12.1%   19.9%   60.5%   100.0%
                 Share of carbon-neutral parcel delivery                                                    91.4%   93.5%   92.2%    93.5%
 Logistics
                 Share of carbon-neutral general cargo delivery                                             44.7%   48.9%   54.8%    87.1%
                 Major companies with carbon footprint                                                        13      13      16       16

 Resources       Major companies with a certified environmental mgmt. system                                   6       6       9       10
 and Climate     Major companies with a certified energy management system                                     4       4       4        6
                 Energy consumption at GER / US locations per order in megajoule                             70.6    66.7    71.3     51.0
                 Share of retained „digital talents“                                                        90.9%   89.9%   65.9%    61.7%
 Employees
                 Share of women in top executive positions                                                  10.5%   12.3%   15.1%    14.0%
                 Percentage of employees who have the opportunity to take a paid
                                                                                                            65.7%   70.2%   68.8%    86.1%
 Society         leave for local volunteer involvement
                 Percentage of employees who took part in local volunteer projects                          15.1%   18.0%   14.7%     9.5%

 * The Newport companies are only included in the focus area employees for the sustainability indicators.

TAKKT AG                       May 2021                                          CM CIC Market Solutions Forum                               44
You can also read