Full year results presentation Year ended 31 March 2018 - 7 June 2018
←
→
Page content transcription
If your browser does not render page correctly, please read the page content below
Full year results
presentation
Year ended 31 March 2018
7 June 2018

Disclaimer

Not for publication, transmission, distribution or release, directly or indirectly, in or into any jurisdiction in which the publication, transmission, distribution or release of this document would be
unlawful. By attending the meeting where this presentation is made or by reading this document, you agree to be bound by the limitations set out below.
This presentation is being communicated only to and is only directed at those persons (i) in the United Kingdom that are (a) investment professionals falling within Article 19(5) of the Financial
Services and Markets Act 2000 (Financial Promotion) Order 2005 (the “Order”), or (b) high net worth entities or other persons falling within Articles 49(2)(a) to (d) of the Order, or (ii) to whom it
would otherwise be lawful to distribute it, and should not be relied upon by any other person. The information contained herein is for those persons attending this presentation (and to whom this
presentation is directed) only, and is solely for their information and may not be reproduced, further distributed or passed on, directly or indirectly, to any other person or published in whole or
in part for any purpose.
This presentation does not constitute or form part of and should not be construed as an offer of securities for sale or subscription of or a solicitation of any offer to purchase securities in the
United States. Securities may not be offered or sold in the United States absent registration under the US Securities Act of 1933, as amended (the "US Securities Act") or pursuant to an exemption
from, or in a transaction not subject to, the registration requirements of the US Securities Act. Auto Trader Group plc (the "Company") does not intend to register any securities under the US
Securities Act or with any state or other jurisdiction of the United States, and it does not intend to offer any securities to the public in the United States.
This presentation is for information only. This presentation does not constitute or form part of and should not be construed as an offer for sale or subscription of, or solicitation of any offer to
buy or subscribe for, any securities of the Company in any jurisdiction nor is it an inducement to enter into investment activity nor should it form the basis of or be relied on in connection with any
contract or commitment or investment decision whatsoever. It does not constitute a recommendation regarding any securities. Past performance, including the price at which the Company’s
securities have been bought or sold in the past and the past yield on the Company’s securities, cannot be relied on as a guide to future performance. Nothing herein should be construed as
financial, legal, tax, accounting, actuarial or other specialist advice.
The information and opinions provided in this presentation are provided as of the date of this presentation. Certain statements in this presentation constitute forward looking statements
(including beliefs or opinions). Any statement in this presentation that is not a statement of historical fact including, without limitation, those regarding the Company’s future expectations,
operations, financial performance, financial condition and business is a forward looking statement. Such forward looking statements are subject to risks and uncertainties that may cause
actual results to differ materially from those expressed or implied by such forward looking statements. These risks and uncertainties include, among other factors, changing economic,
financial, business or other market conditions. These and other factors could adversely affect the outcome and financial effects of the plans and events described in this presentation. As a
result you are cautioned not to place reliance on such forward looking statements. Nothing in this presentation should be construed as a profit forecast.
No reliance may be placed for any purposes whatsoever on the information contained in this presentation, or on its completeness, accuracy or fairness. No representation, warranty or
undertaking, express or implied, is or will be made or given by or on behalf of the Company or any of its directors, officers, advisers, agents or employees or any other person, as to the
accuracy, fairness or completeness of the information or opinions contained in this presentation and, to the extent permitted by law, no liability whatsoever (in negligence or otherwise) is
accepted by the Company or any of its respective directors, officers, advisers, agents or employees, or any other person, for any loss, howsoever arising, directly or indirectly, from any use of
such information or opinions or otherwise arising in connection therewith. In particular, no representation or warranty is given as to the achievement or reasonableness of, and no reliance
should be placed on, any projections, targets, estimates or forecasts contained in this presentation and nothing in this presentation is or should be relied on as a promise or representation as to
future events. Any reliance you place on the information contained in this presentation will be at your sole risk. The information set out herein may be subject to updating, completion, revision,
verification and amendment and may change materially. None of the Company, its directors, officers, advisers, agents or employees or any other person undertakes to or is under any
obligation to update or keep current the information in the presentation or to provide recipients with any additional information.

Financial highlights*

    +   7%    Revenue: up 7% to £330.1 million (2017: £311.4 million)

    +   10%   Operating profit: up 10% to £220.6 million (2017: £203.1 million)

    67%       Operating profit margin: up 2% points to 67% (2017: 65%). Operating cost growth of 2%, much of which relates to the
              acquisition of Motor Trade Delivery (‘MTD’) in April 2017

    +   15%   Earnings and distribution: basic EPS up 15% to 17.76p (2017: 15.64p); proposed final dividend of 4.0p per share plus
              interim of 1.9p means total dividend of 5.9p (2017: 5.2p)

+   £13m      Cash generated from operations: up £13.2 million to £226.1 million (2017: £212.9 million)

1.46x         Net external debt: down £16.3 million to £338.7 million (2017: £355.0 million) with leverage at 1.46x (2017: 1.65x). Debt
              repayments of £20.0 million (2017: £40.0million)
              Cash returned to shareholders: £148.4 million cash returned to shareholders (2017: £128.7 million) through £96.2 million
£148m         of share buy-backs (2017: £102.1 million) (26.8 million shares at an average price of 359p) plus dividends paid of £52.2
              million (2017: £26.6 million)

                     * As the 2017 financial year was four days longer than the 2018 financial year, year-on-year percentages
                     for revenue, costs, profit and EPS have been adjusted to reflect like-for-like growth                                2
Key drivers

+£149         ARPR: up £149 to £1,695 on average per month (2017: £1,546), with growth from product, price and stock

     +   1%   Physical car stock on site: up 1% to 453,000 cars (2017: 450,000) on average

     -   1%   Retailer forecourts: the average number of forecourts in the period was 13,213 (2017: 13,296) with stock per forecourt
              increasing

246m          Advert views: consistent at 246 million per month on average (2017: 247 million)

618m          Cross platform minutes: up 6% to 618 million per month on average (2017: 582 million)

 824          Number of employees and contractors (FTEs): flat at 824 on average during the year (2017: 824)

                                                                                                                                       3
Revenue Number of retailer forecourts (1)
YoY% 0% (2%) (1%)
Revenue (£m)
Year ended March 2018 is shown as 2018
10% 9% 7%
330.1 10%
311.4
Average Revenue Per Retailer (ARPR) (£) (1) (2)
281.6
(5%)
YoY £132 £162 £149
£ pcm
+12% +9%
8%
Retailer revenue (£m)
YoY% 11% 10% 9%
Trade revenue comprises: Consumer services revenue comprises
2018: Retailer (£268.7m); Home Trader (£11.4m); Other (£1.1m) 2018: Private (£21.6m); Motoring services (£8.2m)
2017: Retailer (£250.1m), Home Trader (£12.0m) ; Other (£nil) 2017: Private (£24.4m); Motoring services (£7.4m)
2016: Retailer (£224.5m); Home Trader (£11.5m); Other (£0.4m) 2016: Private (£23.3m); Motoring services (£7.0m)
Note: Year-on-year percentages have been adjusted to give like-for-like growth
rates irrespective of the number of trading days in the year. (1) Average monthly metric
4
(2016: 364 days; 2017: 369 days; 2018: 365 days) (2) Year-on-year growth rates for ARPR have been adjusted for days in 2018 (2016:364 day ARPR, 2017: 364 day
ARPR, 2018: 365 day ARPR)ARPR growth underpinned by new packages and prominence products
ARPR levers Physical car stock and retailer forecourts
Growth in Average Revenue Per Retailer per month (£)
YoY average 2% 0% (2%) (1%)
retailers
(£) £71 £132 £162 £149 YoY average live 7% 3% 3% 1%
physical car stock
Inflated due to
timing of price
initiatives
5Costs FTEs (including contractors)(2)
YoY% (6%) (4%) -
Costs (£m)
Year ending 31 March 2018 is shown as 2018
859 824 824
Year-on- (9%) (5%) 2%
year growth
2016 2017 2018
112.0 109.5 (17%) Marketing as a % of revenue
108.3
2.5 3.7
10.6 4.5
8.0 7.1 (10%)
32.5 30.7 31.3 5.6%
3% 5.1% 4.9%
15.7 16.0 16.3
3%
2016 2017 2018
51.5 49.5 51.1 4%
Capital expenditure (excluding acquisitions) (£m)
(0.8) (0.4)
2016 2017 2018
People costs Marketing spend
(1)
Other costs Depreciation and amortisation
Exceptional items Share-based payments
Note: Year-on-year percentages have been adjusted to give like-for-like growth
rates irrespective of the number of trading days in the year. (1) Other costs include: property, IT & comms, data services and other corporate overheads
6
(2016: 364 days; 2017: 369 days; 2018: 365 days) (2) Average monthly metricProfit and cash flow
Operating profit (£m) Cash generated from operations (£m)
Year ended 31 March 2018 is shown as 2018 Year ended 31 March 2018
Year-on- 27% 18% 10%
year growth
300 80%
3.3 4.9
67% 7.1
65% 70%
250 60%
60%
200
50%
150 40%
226.1
220.6 30% 220.6
100 203.1
169.6
20%
50
10%
0 0%
2016 2017 2018 Operating Depn & Amort. SBP (exc NI) Working Cash
profit capital generated
Operating profit Operating profit margin from ops
Note: Year-on-year percentages have been adjusted to give like-for-like
growth rates irrespective of the number of trading days in the year.
(2016: 364 days; 2017: 369 days; 2018: 365 days) 7Income statement
Year ended Year ended Year-on-year
March 2018 March 2017 % growth*
Revenue 330.1 311.4 7%
Administrative expenses (109.5) (108.3) (2%)
Operating profit 220.6 203.1 10%
Finance costs – net (9.8) (9.7) (2%)
Profit before taxation 210.8 193.4 10%
Taxation (39.5) (38.7) (3%)
Profit for the year attributable to equity 171.3 154.7 12%
owners of the parent
Earnings per share (pence)
Basic 17.76 15.64 15%
Diluted 17.70 15.60 15%
Dividend per share (pence) 5.9 5.2 15%
*Year-on-year percentages have been adjusted to give like-for-like growth rates irrespective of the number of trading days in the year.
(2017: 369 days; 2018: 365 days) 8Net external debt and capital allocation
Reconciliation of net external debt (1) (£m) Capital allocation
1.65x Leverage (2) 1.46x • On 6 June 2018, the Group’s Syndicated Term Loan, which was due to
mature in March 2020, was refinanced as the Group signed into a new
5 year £400 million revolving credit facility.
355.0 226.1 (2.9) (6.7) (39.4) (11.9) (52.2) (96.7) 338.7
• Alongside the refinancing of the Group, we have reconsidered our
capital allocation policy and it remains unchanged from that disclosed
in 2017. We will continue to invest in the business enabling it to grow
whilst returning around one third of net income to shareholders in the
form of dividends. Any surplus cash following these activities will be
used to continue our share buy-back programme and reduce gross
indebtedness.
• In line with the policy outlined above, a final dividend of 4.0p has been
recommended which together with the interim dividend of 1.9p per
share will give a total dividend of 5.9p per share.
Gross £363m £343m
£20m repayment of gross borrowings in the period
debt • During the year 26.8m shares were repurchased at an average price of
359p for consideration of £96.2m plus costs of £0.5m. All of the shares
(1) Net external debt represents gross external borrowings before amortised debt costs less cash acquired in the year have been cancelled.
(2) Leverage is net external debt as a multiple of Adjusted underlying EBITDA (AUEBITDA).
AUEBITDA is earnings before interest, tax, depreciation, amortisation, share-based payments
and associated NI and exceptional items
9UK car market
The number of used car transactions remains near record highs but there
has been a slowdown over the past 12 months
New car registrations (1) Used car transactions (2)
9.0 35%
3.0 50%
8.0 30%
2.8 40%
Number of used car transactions (m)
25%
Number of new car registrations (m)
2.6 30% 7.0
YoY growth for the month
20%
YoY growth for the month
2.4 20% 6.0
2.2 10% 15%
5.0
2.0 - 10%
4.0
1.8 (10%) 5%
3.0
1.6 (20%) -
2.0
1.4 (30%) (5%)
1.2 (40%) 1.0 (10%)
1.0 (50%) - (15%)
Aug
Aug
Aug
Oct
Oct
Oct
Jul
Nov
Jul
Nov
Jul
Nov
Jun
Sep
Jun
Sep
Jun
Sep
Mar
Feb
Mar
Feb
Apr
May
Dec
Apr
May
Feb
Mar
Apr
May
Dec
Dec
Jan
Jan
Jan
Aug
Aug
Oct
Aug
Oct
Oct
Jul
Nov
Jul
Nov
Jun
Sep
Jul
Nov
Jun
Sep
Mar
Feb
Mar
Jun
Sep
Mar
May
Feb
Apr
May
Dec
Apr
May
Feb
Apr
Dec
Jan
Dec
Jan
Jan
2016 2017 2018 2016 2017 2018
5.9% 2.6% (11.0%) 7.1% 4.9% (3.1%)
(1) Society of Motor Manufacturers & Traders (SMMT) – 12 month rolling total (2) DVLA transaction data – 12 month rolling total
11We expect marginal declines in used car volumes for 2018
Used car transactions
8.5
Used car transactions (million)
8.0 8.1
8.0
7.9 7.9 7.9
7.5 7.7
7.5
Likely expectation
7.3 is for a 1-3% decline
7.0 7.2 in 2018
7.1
7.0 7.0
7.0
6.9
6.5
6.0
2007 2008 2009 2010 2011 2012 2013 2014 2015 2016 2017 2018 2019 2020
Calendar year
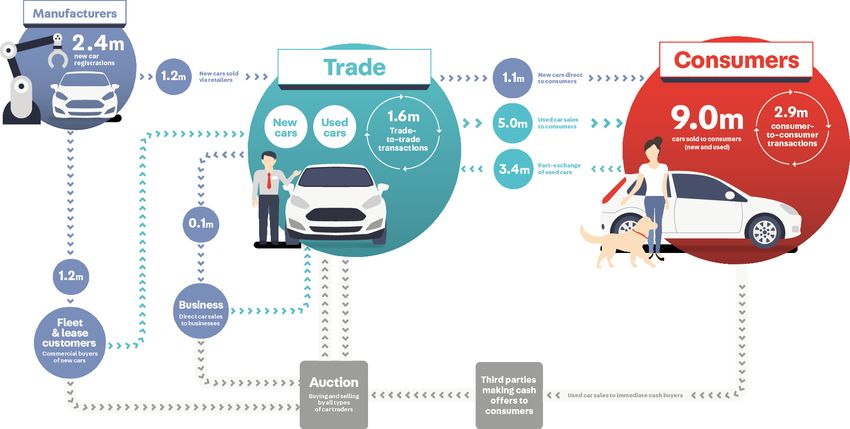
12Despite the decrease in used car transactions, the UK car parc continues
to grow, supportive of our stock based business model
1 2 3
The UK car parc is in long term growth Consumers change their car every three …of which c.25% are new car sales and
because cars are lasting longer and years or so (less frequently in an c.75% are used car transactions
scrappage rates have fallen significantly economic slowdown) and this drives the
below new car sales levels number of car transactions each year…
UK car parc Frequency of transactions (years) Total number of transactions (millions)
New Scrapped Car Parc New Used
36.0 4.0
35.0 3.0 3.4 3.5 3.5 3.5 3.5 3.4 3.3
3.3 3.2 3.3
34.0 3.1 3.1 3.1
2.0 New/ scrapped (m) 2.9
UK car parc (m)
33.0
1.0
32.0 8.1 7.9
0.0
7.7 7.6 7.6 7.5 7.3 7.7
7.1 6.9 7.0 7.0 7.0 7.2
31.0
(1.0)
30.0
29.0 (2.0)
28.0 (3.0) 2.6 2.4 2.3 2.4 2.1 2.0 2.0 1.9 2.0 2.3 2.5 2.6 2.7 2.4
27.0 (4.0)
2004
2005
2006
2007
2008
2009
2011
2010
2012
2013
2014
2015
2016
2017
Total number of cars ÷ Frequency cars are changed = Number of transactions
Source: Society of Motor Manufacturers & Traders (SMMT) and Auto Trader analysis 13An increase in price growth suggests less stock in market
Auto Trader Retail Price Index
Like-for-like
3% 2% 5%
price growth (%)
14Key drivers
Our position as market leader is unchanged with audience engagement
remaining strong
Share of visits vs. main competitor set (1)                                  Auto Trader vs.                                                3X                     6X                     20X             29X
(Average pcm - million)                                                      competitors 2018:

                                                                                                                Auto Trader              Gumtree             Pistonheads              Motors.co.uk      CarGurus
70%                                                                                                                                      Motors
60%
50%
40%                                           Gumtree
                                              retagging
30%
20%
10%
 0%
       Oct Nov Dec Jan Feb Mar Apr May Jun                Jul    Aug Sep Oct Nov Dec Jan Feb Mar Apr May Jun                                          Jul    Aug Sep Oct Nov Dec Jan Feb Mar
                                                      2016                                                                                       2017                                                   2018

      Time spent on autotrader.co.uk (minutes) (1)                                                                     Advert views on autotrader.co.uk (2)
      (Average pcm - million)                                                                                          (Average pcm - million)

                                                                     6%                                                          7%                                2%                            (0%)
                                12%
              37%

                                582                                 618                                                         243                               247                            246
              521

              2016              2017                                2018                                                        2016                              2017                           2018

                                                                                                                                                                                                                   16
                                (1)   comScore MMX Multi-Platform ® , UK Media Trend
                                (2)   Company measure of the number of inspections of individual vehicle advertisements on the UK marketplace (includes physical and virtual stock)
Our position as market leader is unchanged with audience engagement
remaining strong
Total minutes spent in March 2018 (millions) Percentage of Auto Trader audience that do not
visit a particular competitor site
694
90%
86%
75%
69%
155
121 22
51
Auto Trader Gumtree Other Manufacturer Dealer Sites* Gumtree Pistonheads Motors.co.uk CarGurus
Motors Motoring Sites Motors
Portals
* Based on the largest tracked sites on Comscore (approx. 15 due to availability)
17
Source: comScore MMX Multi-Platform, Cross Visiting, March 2018, U.K.Product growth has been underpinned by a successful launch of our Advanced
and Premium packages in April
Starter Basic Standard Advanced Premium
Improve visibility of your stock on Boost your ad views with our Enjoy the greatest share of desktop ad views
Engage your buyers through the Stand out and encourage
mobile and drive more ad views bonus slot in search through priority stock placement
essentials of modern online engagement through trust and
retailing transparency Advanced and Premium car stock penetration in March 2018:
12%
Priority Listing
Desktop
Promoted Promoted
Priority Listing Priority Listing Priority Listing
Mobile Mobile Mobile
Enhanced Listings Enhanced Listings Enhanced Listings Enhanced Listings
Vehicle Video Vehicle Video Vehicle Video Vehicle Video
Gallery Branding Gallery Branding Gallery Branding Gallery Branding
Live Chat Live Chat Live Chat Live Chat Live Chat
100 Images 100 Images 100 Images 100 Images 100 Images
Test the Trade Test the Trade Test the Trade Test the Trade Test the Trade
Part-Ex Guide Part-Ex Guide Part-Ex Guide Part-Ex Guide Part-Ex Guide
Dealer Reviews Dealer Reviews Dealer Reviews Dealer Reviews Dealer Reviews
Starter Basic Standard Advanced
Relative prices between package levels:
+ 15% + 19% + 20% + 28%
18Managing products: i-Control and Retail Check
Number of forecourts with one of our Managing products Physical car stock from forecourts with a Managing product
Average number in the month of March. Trade stock number (000s) – March 2018
Year ended 31 March 2018 is shown as 2018
Penetration 14% 19% 23% 11
39%
of trade
+500 stock
233 155
+600
3,000
2,500
1,900
Home Trader Retailer - Managing Retailer - Non-managing
2016 2017 2018
19New products launched for manufacturers
Search API Auto Trader 360˚ image app InSearch video for new
Enabling manufacturers to Enabling manufacturers to control cars
empower their digital marketing their imagery within their network Helping manufacturers
agencies to design used car by launching our image app that engage with in-market
platforms and move away from includes 360˚ interior and exterior consumers at the early stages
traditional used car website spins that meet manufacturer of their car buying journey on
providers. standards. Auto Trader.
202019 outlook
The 1st April pricing event has gone well and we have monetised Dealer Finance
in line with our expectations

New products added to all of our packages                              Monetised Dealer Finance
                                                                       Retailers paying for Dealer Finance, average April 2018
Starter
Engage your buyers through the essentials of modern online retailing

                                                                         > 5,000           retailers now paying to advertise their own Dealer Finance

  Introduced on 1 April

                                      Dealer profile

                                      Stock export
                                                                            Paying for
                                                                            own Dealer                 31%                              69%
                                                                            Finance                                               of retailers eligible
                                      100 Images                                                                                  for the product are
                                      Live chat                                                                         69%         now paying to
                                                                            Eligible but
                                                                            not taking                                            advertise their own
                                      100 images                            product                                                  finance rates

                                      Test the Trade

                                      Part-Ex guide

                                      Dealer Reviews                      > 3,000          additional retailers opt to show Zuto finance so that they
                                                                                             appear in search by monthly payment

                                                                                                                                                        22
2019 outlook
In April, we successfully monetised our Dealer Finance product and executed our annual pricing event.
These events, combined with continued upsell onto higher level packages and further penetration of Managing
products, will deliver higher levels of price and product ARPR growth in 2019. With fewer cars for sale in the market, we
anticipate a small decline in stock, moderating ARPR growth to be below that of 2018.
We expect average retailer forecourts to decline at a similar rate to last year.
Manufacturer & Agency continues to gain market share due to our new InSearch product. We therefore expect growth to
accelerate somewhat.
In the second half of the year, broader economic uncertainty impacted private listings and this is likely to continue.
We anticipate total operating costs for the year to increase at a rate of low to mid-single digit, resulting in a continued
increase in Operating profit margin.
The new financial year has started well, and the Board is confident of meeting its growth expectations for the year.
23Q&A
Appendices
Cash flow statement
                                         Year ended    Year ended
                                         March 2018    March 2017
                                                 £m            £m

 Profit before tax                            210.8         193.4
 Depreciation and amortisation                   7.1          8.0
 Share-based payments charge (exc NI)            3.3          4.0
 Finance costs - net                             9.8           9.7
 Changes in working capital                    (4.9)         (2.2)
 Cash generated from operations               226.1         212.9

 Tax paid                                    (39.4)        (34.8)
 Capital expenditure                           (2.9)         (3.7)
 Acquistion of subsidiary, net of cash        (11.9)             -
 Repayment of borrowings                     (20.0)        (40.0)
 Dividends paid                              (52.2)        (26.6)
 Purchase of own shares                      (96.2)        (102.1)
 Fees on purchase of own shares                (0.5)         (0.5)
 Interest paid                                 (6.7)         (7.6)

 Net (decrease) in cash                       (3.7)         (2.4)

                                                                     26
Automotive marketplace
27Notes
28Notes
29You can also read