Full-year 2020 results - March 12, 2021 - Serge Ferrari
←
→
Page content transcription
If your browser does not render page correctly, please read the page content below
Interior blinds | Solar protection

                                     Full-year 2020 results
                                         March 12, 2021

                                                              1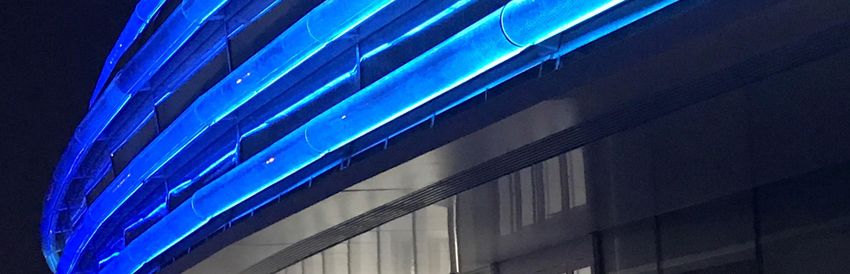
Contents

     1.   Full-year 2020 results
     2.   Business review
     3.   New Group synergy plan and outlook
     4.   Q&A
     5.   Appendices

                                               2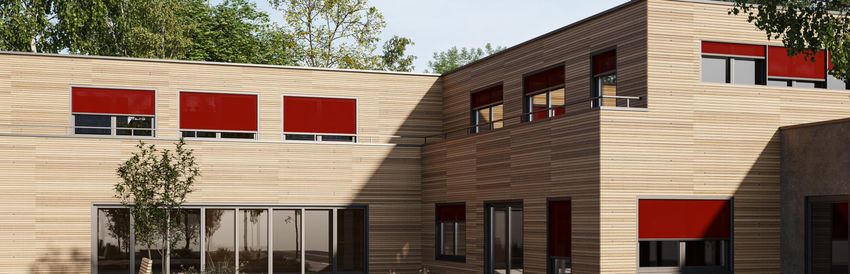
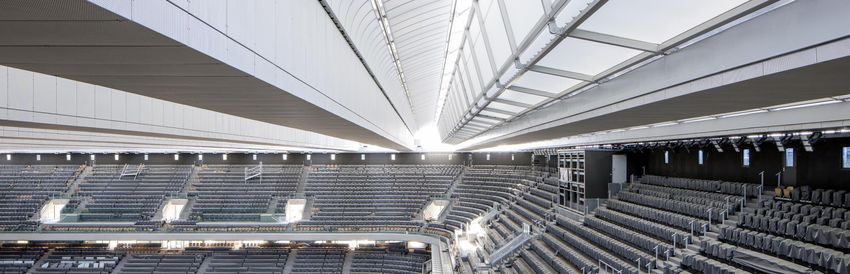
Philippe Chatrier court, Roland Garros | France | Tensile architecture

                                1 | Full-year 2020 results

                                                                         3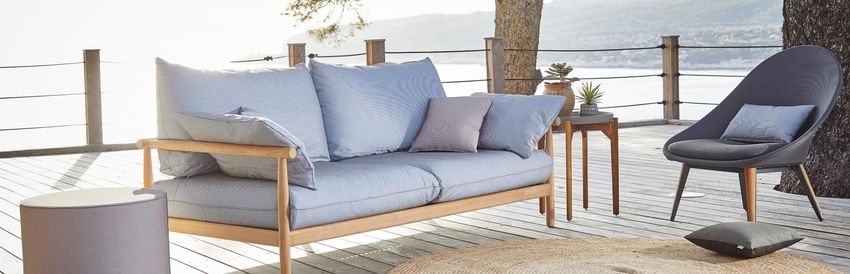
1 — Full-year 2020 results

(€m)                                                               Dec 31, 2020                         Dec 31, 2019
                                                                                                                       Change   Ch. in const. scope
                                                                   (12 months)                          (12 months)

Revenues                                                                 195.3                             189.0       +3.3%          +28.7
                             1
Adjusted EBITDA                                                          23.0                               21.6       +6.5%           +1.7

EBIT                                                                      6.8                               7.6        -11.3%          +0.3

Operating income                                                          4.7                               7.6        -41.8%          +0.3

Net income, Group share                                                   0.5                               4.8

Net debt                                                                (66.5)                            (22.5)

Net (debt)/cash (excl. IFRS 16)                                         (34.3)                              3.7

Shareholders’ equity, Group share                                         94.9                             96.7

  1 Adjusted   EBITDA = Operating income + change in depreciation, amortization and provisions + CVAE

March 12, 2021 I Full-year 2020 results                                                                                                               4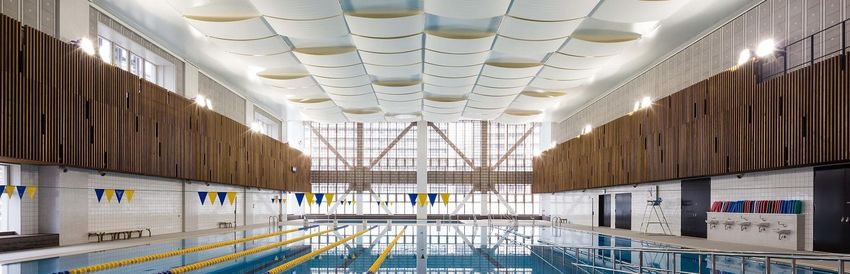
1 — Full-year 2020 results

Highlights

                     Handling of PRE 3     Response to health    F.I.T and Verseidag     Roll-out of new
                     industrial incident         crisis         integration launched      international
                                                                in line with roadmap     sales structure

                          Acquisition          Acquisition
                            of F.I.T          of Verseidag

                          Q1 2020              Q2 2020              Q3 2020                Q4 2020

                                               Closing of                                 Profitability
                                               2020-2027                                  maintained:
                                                financing                                  EBIT €6.8m
                                             arrangements                              (down 11% vs 2019)

March 12, 2021 I Full-year 2020 results                                                                     5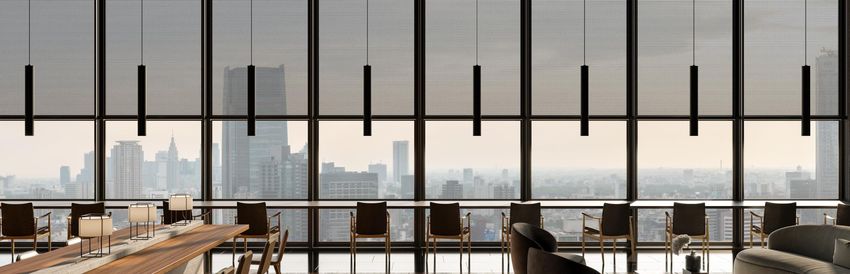
1 — Full-year 2020 results

Revenue breakdown by region
                                                                                                              QoQ change in 2020 revenues
                                                                      Ch. at current Ch. at constant                 (like-for-like)
(€’000)                                    2020           2019         scope and       scope and
                                                                     exchange rates exchange rates       T1          T2        T3           T4
                                                                                                                              +2%
                                                                                                                                            0%
Europe                                    141,990       142,476          -0.3%           -11.1%
                                                                                                       -8.4%
Americas                                  19,636         19,349          +1.5%           -10.3%         PRE 3
                                                                                                       incident
Asia-Africa-Pacific                       33,675         27,222         +23.7%           -11.1%

                                                                                                                    -32.6%
Total revenues                            195,301       189,047          +3.3%           -11.0%
                                                                                                                  Lockdown

► A year split in two: stoppage of activity in H1, back to normal in H2

► Sales curbed by Europe lockdowns:
          ▪     Reported sales stable due to consolidation of Verseidag, down 11.1% at constant consolidation scope and exchange rates (like-for-
                like) due to Q2 lockdown
► Q4 upswing in Americas region:
          ▪     Revenues down 10.3% like-for-like, sustained business recovery in Q4
► Asia-Africa-Pacific business buoyed by acquisition:
          ▪     23.7% revenue growth driven by the F.I.T. acquisition (down 11.1% like-for-like)

March 12, 2021 I Full-year 2020 results                                                                                                             6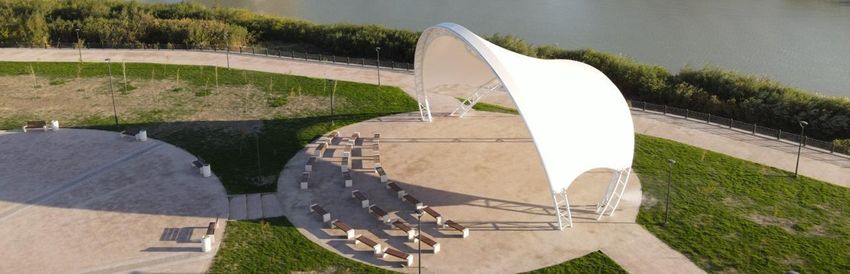
1 — Full-year 2020 results

Change in revenues
(€m)

                                                                      23.9   195.3

          189.0

                                                                4.8
                                                        166.6
                                  -18.0
                                          -2.8
                                                 -1.6

March 12, 2021 I Full-year 2020 results                                              7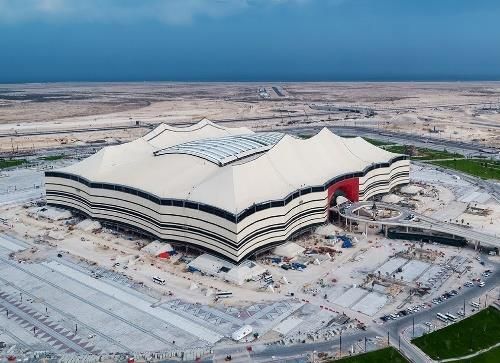
1 — Full-year 2020 results

Simplified consolidated income statement
                                                                                                                            2020
(€’000)                                                            2020 (reported)              Ch. in conso. scope1                      2019 (reported)
                                                                                                                       (constant scope)

  Revenues                                                                195,301                     28,740               166,561           189,047

  Adjusted EBITDA2                                                        23,039                       1,715               21,324             21,637

  % of revenues                                                             11.8%                        -                  12.8%              11.4%

  EBIT                                                                     6,769                        292                   -               7,634

  Operating income                                                         4,673                        292                 4,381             7,634

  % of revenues                                                             2.4%                         -                   2.6%              4.0%

  Net financial expense                                                   (3,743)                      (551)               (3,192)            (949)

  Net income, Group share                                                    471                        N/A                  N/A              4,826

                                        No dividend proposal for 2020, return to pay-out of around 35% subject to return to
                                                                              normal

  1   Consolidation of F.I.T. from July 1, 2020 and Verseidag from August 1, 2020
  2 EBITDA:   including IFRS 16 impact; excl. IFRS 16 impact, EBITDA €16.3m vs €15.3m in 2019

March 12, 2021 I Full-year 2020 results                                                                                                                     8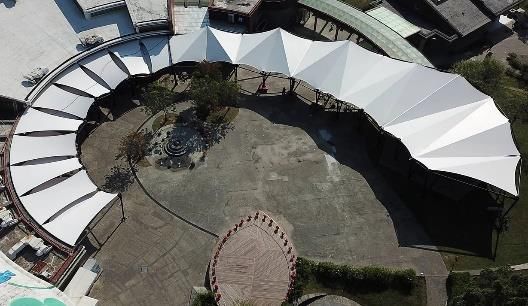
1 — Full-year 2020 results

Change in EBIT*
(€m)

              7.4                                                                                               1.3

                                                                                                2.8
                                                                                                                                 -1.0
                                                                                                                                               0.1   4.2
                                                                                8.2                                                     -2.1

                              -8.3

                                              -1.6

                                                              -2.6

  * Restated excl. IFRS 16 impact; including IFRS 16, EBIT amounts to €4.4m (constant consolidation) in 2020 vs €7.6m in 2019.

March 12, 2021 I Full-year 2020 results                                                                                                                    9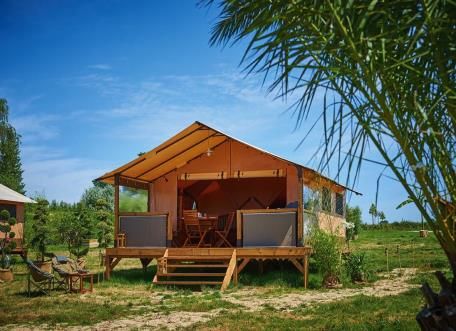
1 — Full-year 2020 results

               Equity investment in F.I.T                        Acquisition of Verseidag

      ► Transaction terms                                   ► Transaction terms
          ▪     Acquisition of 55% equity stake in F.I.T     ▪   Acquisition of entire capital stock of Verseidag
          ▪     Purchase of shares from existing family          at a price of €28.1m paid in cash and shares
                shareholders                                 ▪   Cash payment in two installments:
          ▪     Total price of €8.3m in 2020 and €1.4m in          o   €14.1m paid at closing
                2021 and 2022                                      o   €4.4m paid in 2021 after price adjustment
                                                             ▪   Payment in shares:
          Consolidated from July 1st, 2020                         o   Two installments of €4.7m each (585,417 shares)
                                                                       paid in 2021 and 2022
                                                             ▪   Earn-out:
                                                                   o   Subject to targets recognized under other non-
                                                                       current liabilities (€12.5m)

                                                             Consolidated from August 1st, 2020

March 12, 2021 I Full-year 2020 results                                                                              10
1 — Full-year 2020 results
Balance sheet - Assets
(€’000) Dec 31, 2020 Dec 31, 2019 Change
► PPA underway - to be finalized by June 30,
Goodwill 34,821 10,167 +24,654 2021
Property, plant and
76,713 50,382 +26,331 ► Ch. in consolidation €28,699
equipment
Other non-current
17,615 18,920 -1,305
assets
Total non-current
129,149 79,469 +49,680
assets
Inventories 71,705 50,372 +21,333 ► Ch. in consolidation €26,962
Trade receivables 46,741 34,405 +12,336 ► Ch. in consolidation €12,782
Other assets 11,002 13,469 -2,467
Cash & equiv. 45,925 26,720 +19,205
Total current assets 175,373 124,966 +50,407
Total assets 304,523 204,435
March 12, 2021 I Full-year 2020 results 111 — Full-year 2020 results
Changes in working capital
Dec 31, 2020 Ch. at constant
(€’000) Group Dec 31, 2020 Ch. in conso. scope Dec 31, 2019
Constant consolidation scope.
Inventories (gross) 76,144 +28,035 48,109 55,047 -6,938
Trade receivables
49,133 +12,782 36,351 36,344 +7
(gross)
Trade payables (26,165) -6,887 (19,278) (25,219) +5,941
Operating working
99,112 +33,930 65,182 66,172 -990
capital
Sales (H2 2020 – FY 2019)* 86,873 189,047
% of sales 37.5% 35.0%
* For the sake of comparison, working capital as a percentage of revenues is calculated for the second half, as H1 was not a representative period due to the health crisis.
March 12, 2021 I Full-year 2020 results 121 — Full-year 2020 results
Balance sheet - Liabilities & Equity
(€’000)
Dec 31, 2020 Dec 31, 2019 Change
Shareholders’ equity,
94,894 96,724 -1,830
Group share
Non-controlling ► Minority interests: 45% in F.I.T. and 40% in
6,413 305 +6,108
interests DBDS
Total equity 101,307 97,029 +4,278
► July 29, 2020 financing + change in
Borrowings and debt 87,598 36,643 +50,955 consolidation
Provisions for
11,015 10,050 +965
pensions
Other non-current ► M&A payments totaling €17,063 in 2022 and
25,340 5,405 +19,935
liabilities 2023
Total non-current
123,954 52,098 +71,856
liabilities
Borrowings and bank ► July 29, 2020 financing + change in
24,831 12,551 +12,280
overdrafts consolidation
Trade payables 26,165 25,219 +946 ► Ch. in consolidation €6,886
Other current
28,266 17,538 +10,728 ► M&A payments totaling €9,769 in 2021
liabilities
Total current liabilities 79,262 55,308 +23,954
Total liabilities and
304,523 204,435
equity
March 12, 2021 I Full-year 2020 results 131 — Full-year 2020 results
Breakdown of net debt
(€’000)
44,940 45,295
32,209
30,000
5,280
Other bank debt Operating lease Euro PP Factoring Cash & equiv.
and equivalents liabilities (IFRS
16)
(€’000)
Reported net debt 66,504
Net debt used to calculate covenant ratios 34,295
March 12, 2021 I Full-year 2020 results 141 — Full-year 2020 results
Change in cash flow
(€m)
16.3
3.7
3.0 15.0
-7.9 -0.4 -2.1 -1.7
-30.0
5.0
1.3
-2.0
-34.5
-34.3
(€’000) 2020 2019
Cash flow from operating activities 26,897 21,424
Cash flow from investing activities (43,175) (9,355)
Cash flow from financing activities 36,011 (10,760)
Impact of changes in foreign exchange rates (278) 47
Change in cash over the period 19,455 1,357
March 12, 2021 I Full-year 2020 results 15Atyrau Youth Recreation Park | Kazakhstan | Tensile architecture
2 | Business review
16Group overview
SergeFerrari Group: renowned international actor
and world leader in its strategic markets
► SergeFerrari Group designs, develops, and manufactures innovative composite
materials for lightweight architectural and outdoor applications.
► The Group’s solutions combine durability, safety, design, comfort and eco-
responsibility for all applications ranging from everyday needs to the most
ambitious projects.
► Serving numerous markets, including 4 core segments:
▪ Tensile architecture
▪ Modular structures
▪ Solar protection
▪ Furniture/Marine
► Nearly 80% of sales generated outside France in 2020
The radical and innovative solutions offered by Serge Ferrari provide a tangible
response to the challenges of ecological transition:
“Reduce, Prolong, Recycle”
March 12, 2021 I Full-year 2020 results 172 — Business review
Tensile architecture
► 2020 highlights
▪ Strong impact of COVID-19, projects delayed
▪ Gradual recovery from September 2020
Krasnodar Stadium | Russia
▪ Market driven by government orders, improvements in building energy
performance and major infrastructure projects
► Expansion of the offering
▪ Access to new technological platforms (Verseidag) in the field of non-
combustible PTFE glass materials Point building | Czech Republic
▪ F.I.T Taiwan offers flexible bridgehead to grow market share in Asia
▪ Product innovation plan
National Speed Skating Oval | China
March 12, 2021 I Full-year 2020 results 182 — Business review
Modular structures
► 2020 highlights
▪ Event market curtailed by lockdowns
▪ However, the situation was favorable to other highly buoyant markets:
o Healthcare (vaccination centers, field hospitals, etc.)
o Modular structures for large-capacity storage (warehouses)
► Expansion of the offering
▪ Verseidag technologies contribute towards large-width solutions
March 12, 2021 I Full-year 2020 results 192 — Business review
Solar protection
► 2020 highlights
▪ A year of growth despite the health situation
▪ Marked growth in the residential segment, boosted by the cocooning
trend
► Continued development expenditure
▪ Expansion of industrial plant at La Tour du Pin
March 12, 2021 I Full-year 2020 results 202 — Business review
Marine & Furniture
► 2020 highlights
▪ Business resilience in face of the pandemic
▪ Favorable trend in the home furniture market
▪ Highly buoyant refit market
► Integration of Serge Ferrari SpA (former Plastitex) completed
▪ Roll-out of best practices
▪ Development of commercial synergies and cross-selling
▪ Relocation of part of the furniture range from France to Italy underway
► Launch of new products
March 12, 2021 I Full-year 2020 results 212 — Business review
Verseidag-Indutex – Integration off to a promising start
► A transforming acquisition
▪ Access to leading position in Germany,
About Europe’s largest market
Verseidag-Indutex
▪ Establishment of a world leader in non-
combustible PTFE glass materials
Founded a century ago and located
in Krefeld, the company operates in
the high-quality coated fabrics
market
► Plants in Germany ► Integration off to a promising start
► 4 sales subsidiaries: Europe, USA, ▪ Sales forces combined and already
Middle East, operational
Hong Kong ▪ Identification of strong synergies and
best practices
► Consolidated 2020 revenues:
€57.4m
► Operations in 60 countries
► Around 250 employees
March 12, 2021 I Full-year 2020 results 222 — Business review
F.I.T – Stronger foothold in Asia
► Another transforming acquisition leading to:
About
▪ Extension of the non-combustible materials offering mainly F.I.T Industrial Co. Ltd (F.I.T)
intended for tensile architecture
Taiwanese company founded in
2003 and specializing in the design,
▪ New bridgehead to grow Group market share in Asia manufacture and distribution of
high-tech non-combustible
materials
► Unrivaled expertise in the
► F.I.T. products to be gradually incorporated into the Serge Ferrari manufacture and installation of
global specifier and distribution network PTFE glass membranes
► 2020 revenues: c. €8.5m
► c. 100 customers in 15 countries
► c. 100 employees
F.I.T. achievements
March 12, 2021 I Full-year 2020 results 23TBC
National Speed Skating Oval | China | Tensile architecture
3 | New Group synergy plan and outlook
243 — New Group synergy plan and outlook
Two main areas for generating synergies
Commercial Industrial
Single sales force Industrial rationalization
-
Product ranges without -
equivalence on the Reallocation of resources
market due to cutting- to most efficient
edge technology and locations
depth
March 12, 2021 I Full-year 2020 results 253 — New Group synergy plan and outlook
Activating commercial leverage
Mobilize the sales force Capitalize on expertise and improve
productivity
► Streamline brand portfolio: ► Sharing of know-how
maintain multi-brand strategy in between Serge Ferrari,
some market segments while Verseidag and F.I.T
promoting a single brand in others
► Ongoing innovation drive to
► Enhance the product portfolio to enhance the offering, focused
be marketed while harnessing the on the 4 core markets
power of the Serge Ferrari sales
network
► The annual gross margin
generated by new product
► Incentives offered to sales force in launches must exceed the
line with sales margin growth amount of annual innovation
expenditure
Future margins destined to
outstrip increasing sales costs
March 12, 2021 I Full-year 2020 results 263 — New Group synergy plan and outlook Reorganization of target regions in line with new business distribution and growth potential Northern Europe c. 40% of revenues ► 3 subsidiaries ► Markets: tensile architecture, modular structures, solar protection, furniture/marine ► Integrated/independent distribution network ► 56 sales force ► VP Business Area Northern Europe brought in from Verseidag Southern Europe & Americas c. 40% of revenues ► 5 subsidiaries ► 1 representative office ► Markets: tensile architecture, modular structures, solar protection, furniture/marine ► Integrated/independent distribution network ► 75 sales force Asia-Pacific-Middle East-Africa c. 20% of revenues ► 3 subsidiaries ► 1 representative office ► Markets: tensile architecture, modular structures, solar protection, furniture/marine ► Independent distribution network ► 53 sales force March 12, 2021 I Full-year 2020 results 27
3 — New Group synergy plan and outlook

Industrial rationalization

                                Reallocation of                                        Tight cost control
                             industrial expenditure

                 ► Streamlining of industrial                                  ► Pooling of procurement with
                   facilities by optimizing site                                 new Group entities
                   workloads
                 ► Relocation of a large part of                               ► Continued monitoring of
                   Eglisau plant operations                                      general expenses
                   (Switzerland) to Krefeld (Germany)
                 ► Downsizing at Eglisau affecting
                   approx. 50 FTE jobs                                         ► Streamlining of control
                                                                                 procedures between
                 ► Upgrading of industrial plant at                              subsidiaries
                   Serge Ferrari SpA (former
                   Plastitex)

                                          Lowering the breakeven point and increasing operating leverage

March 12, 2021 I Full-year 2020 results                                                                        28
3 — New Group synergy plan and outlook
Generation of synergies and value creation
Announcement
of downsizing
at Eglisau and All industrial and
relocation to Completion of commercial cost-cutting
Krefeld relocation to Krefeld and synergies will have
been achieved
Q3 2020 Q4 2020 H1 2021 H2 2021 2022 2024
Closing of Testing at 1st milestone for industrial
Verseidag Krefeld / and commercial cost-
acquisition completion of cutting and synergies
targeted capex
March 12, 2021 I Full-year 2020 results 293 — New Group synergy plan and outlook
Outlook and targets
Revenues Profitability
€300m medium-term Earnings growth > sales
revenue target growth
Acquisitions
External growth
opportunities in case of
technological or
geographic synergies
on strategic markets
March 12, 2021 I Full-year 2020 results 30Minato Park | Japan | Tensile architecture
4 | Q&A
31Exterior blinds | Solar protection
5 | Appendices
325 — Appendices
Shareholder diary
LISTING
SHARE OWNERSHIP (MARCH 1st, 2021)
Euronext Paris - Compartment C
ISIN: FR0011950682 Number of shares
Symbol: SEFER Other institutional Individual
7.6% shareholders
Eligible for SME personal equity plan &
7%
innovation mutual fund investment Tikehau
2.1%
STOCK MARKET
Crédit Mutuel-Equity
Number of shares (at March 1st, 2021): 12,299,259 3.6% Ferrari
BpiFrance family
High since Jan 2, 2020: €8.96 5.4% 70.4%
Low since Jan 2, 2020: €3.62 Treasury shares
3.9%
NEXT PUBLICATIONS % of voting rights
(released after close of trading) Other investors
10.5%
Q1 2021 revenues April 27, 2021 Tikehau
1.4%
H1 2021 revenues July 27, 2021 Crédit Mutuel-
Equity Ferrari
2.4% family
78.4%
BpiFrance
7.3%
March 12, 2021 I Full-year 2020 results 335 — Appendices
Net financial expense
Ch. in conso.
(€’000) 2020 2019 Change
scope
Net currency ► €740k at constant scope. on INR,
1,135 +395 (126) +1,261
gains/(losses) BRL & TRY
Unwinding of
► Simulation of interest expense
discount on M&A 271 0 0 +271 included in deferred payments
payments due
Write-off of Euro PP
122 0 0 +122 ► Early redemption of Euro PP 2015
2015 amortized costs
Other net costs 132 0 61 +71
Other financial
income and 1,660 +395 (65) +1,725
expenses
► €848k linked to July 29, 2020
Net cost of debt 2,083 +157 1,014 +1,069 financing arrangements
Net financial
(3,743)
expense
March 12, 2021 I Full-year 2020 results 34Batyline Elios Shooting Cassis | Furniture
35You can also read