SKILL ACCUMULATION WITH MALLEABLE ABILITY: A RANDOMISED CONTROL TRIAL LIFBI LECTURE - 19 JANUARY 2021
←
→
Page content transcription
If your browser does not render page correctly, please read the page content below

Skill accumulation with
malleable ability:
a Randomised Control Trial

Emilia Del Bono
ISER, University of Essex
with Adeline Delavande, Angus Holford and Sonkurt Sen

LIfBi Lecture – 19 January 2021
Motivation Growing evidence that non-cognitive skills are important in explaining a range of educational and social outcomes (Almlund et al. 2011, Heckman, Stixrud and Urzua, 2006; Borghans et al. 2008, Lundberg 2017) “Non-cognitive skills” label covers many concepts: Skills: Self-control, grit, creativity Preferences: Risk-seeking/aversion, time discounting/patience Beliefs: Growth mindset, productivity of effort
Intervening on non cogn. skills Early interventions can be successful! Alan and Ertac (2018) designed and implemented a novel intervention targeted at improving patience among primary school children; find positive effects on measures of attitudes towards delayed compensation as well as behaviour scores Alan, Boneva and Ertac (2019) show the results of an intervention targeted at grit or persistence and show effects on probability to undertake challenging tasks, effort and standardised test scores
Intervening on non cogn. skills Evidence for older children comes mainly from quasi-natural experiments Voors et al (2012) find that individuals exposed to violence (Burundi) display more altruistic behaviour towards their neighbours, are more risk-seeking, and have higher discount rates Perez-Arce (2017) exploit lottery for public college in Mexico City and find an effect of education on patience Booth and Nolan (2012) document that peer-exposure affects competitiveness during secondary school
This paper We focus on the specific belief that ability is malleable and increases with effort Similar to the concept of “Growth Mindset” (Dweck, 2006) We design and implement an information intervention aimed at university students: Ability is malleable + study tips We investigate the mechanisms through which the intervention operates Do students change effort? Do students change their beliefs about the productivity of effort?

Related literature in education Importance of non-cognitive skills: Alan and Ertac (2018); Cobb-Clark (2015) Role of non-cognitive skills in economic models: Heckman, Jagelka and Kautz (2019), Jagelka (2020) Role of beliefs: Wiswall and Zafar (2014); Delavande and Zafar, (2019); Delavande, Del Bono and Holford (2020) Determinants of effort: Burgess, Metcalfe and Sadoff (2016); Clark, Gill, Prowse and Rush (2020)
Beliefs about ability Growth Mindset Dweck’s definition in ”Mindset: The New Psychology of Success” (2006) In a fixed mindset, people believe their basic qualities, like their intelligence or talent, are simply fixed traits. They spend their time documenting their intelligence or talent instead of developing them. They also believe that talent alone creates success—without effort. In a growth mindset, people believe that their most basic abilities can be developed through dedication and hard work—brains and talent are just the starting point. This view creates a love of learning and a resilience that is essential for great accomplishment.
Beliefs about ability
o Many small-scale studies (mainly in US) with large positive effects, but
 intense treatment programmes (e.g. Aronson et al. 1999, 2002)

o Larger studies show mixed evidence:
 o Yeager and Walton (2011): 7,335 freshmen at UT Austin; increase in
 likelihood of completing first-year credits for Latino & African
 American
 o Yeager et al. (2019): 6320 students in secondary schools in the US,
 with positive effects on beliefs and GPA at the end of the year, larger
 effects on lower achieving students
 o Foliano et al. (2019): through the Changing Mindset trial in 101 UK
 primary schools (>5000 pupils) but no evidence of positive effects on
 any subject or measure of non-cognitive skills
Outline of the talk
o Our data – university students surveys
o Our intervention
o Empirical specification
o Balancing
o Effects on beliefs, grades and inputs
o Heterogeneity
o External validity
Outline of the talk
o Our data – university students surveys
o Our intervention
o Empirical specification
o Balancing
o Effects on beliefs, grades and inputs
o Heterogeneity
o External validity

 PREVIEW
 -> Positive effect on beliefs
 -> Positive effect on grades
 -> Small/het. effects on attendance
 -> Effects on other study habits
Our contributions Medium-term outcomes Inputs/mechanisms relevant to the “production function” human capital (amount of study, attendance, study habits, etc.) Use of subjective expectations to measure beliefs about ability Evidence of external validity
Our data: BOOST2018 First year undergraduate students at a UK university starting in academic year 2015/16 Out of a cohort of 2621, 1978 enrolled (75%) Series of online surveys, lab sessions linked with administrative data
First survey year
 First year

November
 Wave 1 Online (45m) - £10
 Autumn term
 study hours, study habits, attendance, non-cog. skills
December
 ~1200 respondents

January
 Wave 2 Lab (1h) - £30
 cognitive test, non-cognitive traits
February
 ~1000 participants

March
 Wave 3 Online (1h) - £20
 study hours, study habits, attendance, non-cog. skills
 Spring term
April
 ~1200 respondents

May
 Wave 4 Online (8 min) - £8
 study hours, study habits, attendance Summer term
June
 ~900 respondents
First survey year
 First year

November
 Wave 1 Online (45m) - £10
 Autumn term
 study hours, study habits, attendance, non-cog. skills
December
 ~1200 respondents

January
 Wave 2 Lab (1h) - £30
 cognitive test, non-cognitive traits Intervention
February
 ~1000 participants

March
 Wave 3 Online (1h) - £20
 study hours, study habits, attendance, non-cog. skills
 Spring term
April
 ~1200 respondents

May
 Wave 4 Online (8 min) - £8
 study hours, study habits, attendance Summer term
June
 ~900 respondents
Our intervention
o The intervention consisted of:
 o A video showing recent evidence on the way the brain works and new
 connections form after stimuli
Our intervention
Your ability improves with effort Mistakes help you to learn
Our intervention
o The intervention consisted of:
 o A video showing recent evidence on the way the brain works and new
 connections form under stimuli
 o Talking-heads (Psychology experts) describing this evidence and
 associating it to the key messages
Our intervention
o The intervention consisted of:
 o A video showing recent evidence on the way the brain works and new
 connections form under stimuli
 o Talking-heads (Psychology experts) describing this evidence and
 associating it to the key messages

 o Study tips about the importance of various inputs
 • Testing yourself
 • Cramming
 • Attending classes and lectures
 • Avoiding bad situations (social media, sleeping etc.)

 Information intervention
 =
 Ability is malleable + Study Habits
Our intervention
o After the video the students engaged in 2 incentivised tasks:

 1. Three multiple choice questions on the content of the video

 2. A short essay: “Write a letter to a friend to explain that ability is not fixed
 and what implications this has for how he or she should study”
 according to the “saying-is-believing” method (Walton 2014) and used in
 Paunesku et al. (2015)
Our control group
o Was shown a video of the same length of the GM video, describing
 the functions of the brain and the location of these functions
o Structure was very similar, with talking-heads, questions and essay
 at the end
Empirical specification
As this is an RCT, we could simply compare the post-intervention means.

However we follow more recent developments in the experimental literature
(Bruhn and McKenzie 2009, McKenzie 2012) and estimate the following model
for all the outcomes of interest [ANCOVA]

 = 0 + 1 −1 + 2 + 3 +

- take into account baseline
- control for stratifying variables
Sample composition
 British students only
 W123 W13
 Target BOOST
 (ATE Results) (ITT Results)

Male 52.1 49.4 44.1 45.1
Females 47.9 50.6 55.9 55.0

White H SES 33.9 34.5 34.9 36.1
White L SES 21.2 21.6 20.9 20.9
Black British 19.3 21.5 21.7 20.1
Asian British 13.6 10.7 12.3 12.4
Other British 12.0 11.7 10.3 10.6

Young 91.2 92.5 92.5 92.6
Mature 8.8 7.5 7.5 7.4

Observations 1895 1393 522 688
Balancing - stratifying variables
 Assignment Treatment
 (w13 sample) (w123 sample)

 0 1 p-values 0 1 p-values

Female 0.53 0.57 0.27 0.54 0.58 0.35

Non-Mature 0.08 0.07 0.40 0.08 0.07 0.64

High SES 0.53 0.54 0.78 0.57 0.51 0.19
Low SES 0.31 0.31 0.99 0.29 0.34 0.21

Lowest Tariff Q 0.17 0.18 0.90 0.18 0.16 0.55
Second Tariff Q 0.19 0.17 0.38 0.20 0.18 0.47
Middle Tariff Q 0.18 0.17 0.71 0.17 0.16 0.73
Fourth Tariff Q 0.20 0.23 0.47 0.20 0.25 0.22
Highest Tariff Q 0.19 0.22 0.40 0.20 0.22 0.46

Observations 339 349 688 249 273 522
Balancing – baseline outcomes
 Assignment Treatment
 (w13 sample) (w123 sample)

 0 1 p-values 0 1 p-values

Growth Mindset 36.97 36.91 0.94 37.22 37.51 0.72

Attendance (Proportion) 0.69 0.68 0.57 0.71 0.70 0.41
Study Hours 13.22 12.35 0.29 13.57 12.25 0.17

%Compulsory 0.43 0.45 0.16 0.44 0.46 0.39
%Note Taking 0.20 0.18 0.15 0.20 0.18 0.29
%Testing 0.09 0.10 0.34 0.08 0.09 0.43

Overdue 0.85 0.87 0.48 0.86 0.86 0.94
Longest 0.33 0.33 0.96 0.34 0.32 0.58
Doing Worst 0.54 0.58 0.30 0.51 0.56 0.25

Grit 3.18 3.19 0.93 3.18 3.18 0.89
Goal Performance 4.05 4.09 0.57 4.05 4.07 0.84
Planning efficacy 4.31 4.41 0.19 4.24 4.43 0.03

Observations 339 349 688 249 273 522
Outcomes Beliefs about ability and effort Growth mindset Beliefs about the productivity of effort (study time and attendance) Attainment & progression Average first year module mark and exam mark Indicators of progressions to year 2 and 3 Final grades Inputs Attendance to classes and lectures (administrative data) Hours of private study (self-reported) Composition of study time Testing, taking notes, etc. Study habits Study next what … I am worst at Study next what … I have not studied the longest Study next what … is overdue Study next what … I am most interested in Study next what … is scheduled next
Outcomes Beliefs about ability and effort Growth mindset Beliefs about the productivity of effort (study time and attendance) Attainment & progression Average first year module mark and exam mark Indicators of progressions to year 2 and 3 Final grades Inputs Attendance to classes and lectures (administrative data) Hours of private study (self-reported) Composition of study time Testing, taking notes, etc. Study habits Study next what … I am worst at Study next what … I have not studied the longest Study next what … is overdue Study next what … I am most interested in Study next what … is scheduled next
Beliefs about ability Growth mindset (Dweck 2006) You can learn new things, but you can’t really change your basic intelligence You have a certain amount of intelligence and you really can’t do much to change it No matter how much intelligence you have, you can always change it quite a bit You can change even your basic intelligence level considerably Using the following scale: Scale: Strongly Disagree Somewhat Neither Somewhat Agree Strongly Disagree Disagree Agree nor Agree Agree Disagree
GM in our data
 .08

 Wave 1
 .06

 Mean Std.
 Dev
 Wave 1 36.9 9.1
Density

 Wave 3 36.6 9.4
 .04
 .02
 0

 0 20 40 60
 gm_scaled
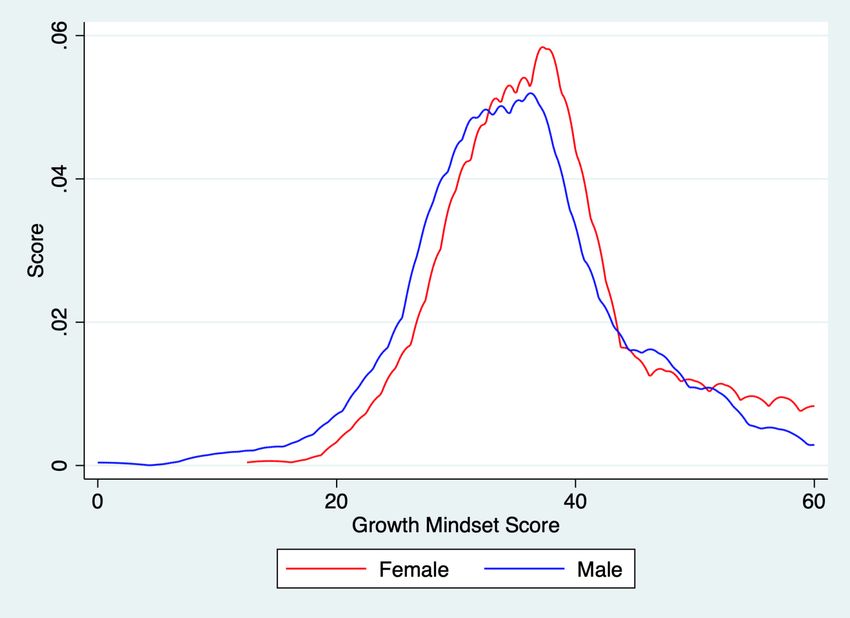
GM - by gender
GM – by entry grades
GM – by SES
 .05
 .04
 .03
Prpn
 .02
 .01
 0

 0 20 40 60
 Growth Mindset Spring

 High SES Low SES
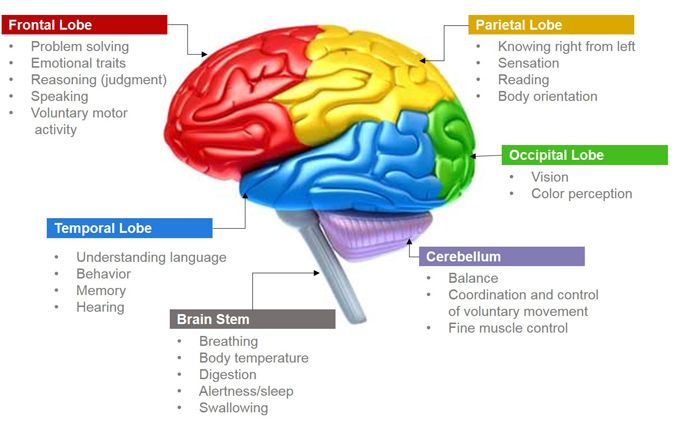
GM – at baseline
 .06
 .04
Prpn
 .02
 0

 0 20 40 60
 Growth Mindset Baseline

 Treatment Control
GM – after treatment
Effects on GM
 Treatment (ATE) Assignment (ITT)

Treatment 2.235*** 2.051*** 2.234*** 2.199*** 2.137*** 2.181***

 (0.811) (0.698) (0.698) (0.717) (0.602) (0.605)
Baseline – w1 0.510*** 0.515*** 0.560*** 0.554***

 (0.050) (0.051) (0.042) (0.043)

Female -1.901** -1.376**

 (0.804) (0.686)
Low SES 1.059 0.803

 (0.743) (0.651)
Tariff quintiles ✔ ✔
Department ✔ ✔
Age ✔ ✔

Observations 520 520 520 679 679 679
Effects on GM
 Treatment (ATE) Assignment (ITT)

Treatment 2.235*** 2.051*** 2.234*** 2.199*** 2.137*** 2.181***

 (0.811) (0.698) (0.698) (0.717) (0.602) (0.605)
Baseline – w1 0.510*** 0.515*** 0.560*** 0.554***
 25% of a std. dev.
 (0.050) (0.051) (0.042) (0.043)

Female -1.901** -1.376**

 (0.804) (0.686)
Low SES 1.059 0.803

 (0.743) (0.651)
Tariff quintiles ✔ ✔
Department ✔ ✔
Age ✔ ✔

Observations 520 520 520 679 679 679
Beliefs about effort
During the Lab session, we administered an IQ test (similar to Raven)

Afterwards we elicited students’ beliefs about their mark as a function of their
effort (study hours and attendance) and performance in that test

**We did not reveal the performance in the test though
Beliefs about effort
Question:
We would like now to ask you to think what your average final mark (between 0 and 100)
might be depending on: How many hours you study per week during term time (outside of
lectures and classes) this year. The proportion of lectures and classes you attend this
year. Your current rank among 1000 graduates when answering a problem-solving task
involving patterns similar to the one you just did, which measures your current capacity for
analyzing problems, abstract reasoning, and ability to learn.

For each individual we specify:
- 2 levels of study hours, 2 levels of attendance and 2 level of ability raking = 8 observations
Beliefs about effort Using the 8 observations per individual, we estimate individual-specific parameters of the subjective production function of marks ln = + ln + ln + ln We look at the TE on the parameters , , , which are individual specific The idea is to see whether the intervention increases beliefs about the productivity of effort: ,
Beliefs about effort
 Return on Return on Return on
 Attendance Study Hours Ability Ranking

Treatment 0.073* 0.046* -0.067

 (0.043) (0.026) (0.041)

Baseline 0.211*** 0.077 0.130

 (0.074) (0.053) (0.111)

Observations 587 587 587
Outcomes Beliefs about ability and effort Growth mindset Beliefs about the productivity of effort (study time and attendance) Attainment & progression Average first year module mark and exam mark Indicators of progressions to year 2 and 3 Final grades Inputs Attendance to classes and lectures (administrative data) Hours of private study (self-reported) Composition of study time Testing, taking notes, etc. Study habits Study next what … I am worst at Study next what … I have not studied the longest Study next what … is overdue Study next what … I am most interested in Study next what … is scheduled next
Attainment at entry
First year mark
Final mark
Effects on marks
 First year Progression Graduation
 Overall Exam Mark >70% Same Same Overall Mark >70%
 mark mark course in course in mark
 year 2 year 3

Treatment 1.744** 1.522* 0.076*** 0.043 0.051 1.680** 0.085**

 (0.786) (0.828) (0.029) (0.033) (0.036) (0.776) (0.040)

Tariff ✔ ✔ ✔ ✔ ✔ ✔ ✔
SES ✔ ✔ ✔ ✔ ✔ ✔ ✔
Female ✔ ✔ ✔ ✔ ✔ ✔ ✔
Department ✔ ✔ ✔ ✔ ✔ ✔ ✔
Age ✔ ✔ ✔ ✔ ✔ ✔ ✔

Observations 677 672 677 684 661 441 441
Effects on marks
 First year Progression Graduation
 Overall Exam Mark >70% Same Same Overall Mark >70%
 mark mark course in course in mark
 year 2 year 3

Treatment 1.744** 1.522* 0.076*** 0.043 0.051 1.680** 0.085**

 (0.786)
 16% of a std.(0.828)
 dev. (0.029) (0.033) (0.036) (0.776) (0.040)

Tariff ✔ ✔ ✔ ✔ ✔ ✔ ✔
SES ✔ ✔ ✔ ✔ ✔ ✔ ✔
Female ✔ ✔ ✔ ✔ ✔ ✔ ✔
Department ✔ ✔ ✔ ✔ ✔ ✔ ✔
Age ✔ ✔ ✔ ✔ ✔ ✔ ✔

Observations 677 672 677 684 661 441 441
Effects on marks
 First year Progression Graduation
 Overall Exam Mark >70% Same Same Overall Mark >70%
 mark mark course in course in mark
 year 2 year 3

Treatment 1.744** 1.522* 0.076*** 0.043 0.051 1.680** 0.085**

 (0.786) (0.828)
 7.6pp over
 (0.029)
 a mean (0.036)
 (0.033) (0.776) (0.040)
 16% of a std. dev. of 20 percent

Tariff ✔
 This ✔
 is a “large ✔
 effect”, ✔
 equivalent ✔ ✔ ✔
SES to
 ✔ having ✔ a high quality
 ✔ teachers
 ✔ ✔ ✔ ✔
Female vs.
 ✔ an average
 ✔ teacher
 ✔ ✔ ✔ ✔ ✔
Department ✔ ✔ ✔ ✔ ✔ ✔ ✔
Age ✔ ✔ ✔ ✔ ✔ ✔ ✔

Observations 677 672 677 684 661 441 441
Up to this point Positive effects on measures of growth mindset used in the literature Effects on the perceived productivity of effort Positive effects on marks in first year and at graduation What about the mechanisms? Did the students increase attendance or study time? Did they do something else?
Outcomes Beliefs about ability and effort Growth mindset Beliefs about the productivity of effort (study time and attendance) Attainment & progression Average first year module mark and exam mark Indicators of progressions to year 2 and 3 Final grades Inputs Attendance to classes and lectures (administrative data) Hours of private study (self-reported) Composition of study time Testing, taking notes, etc. Study habits Study next what … I am worst at Study next what … I have not studied the longest Study next what … is overdue Study next what … I am most interested in Study next what … is scheduled next
Attendance and Study Hours

 Attendance Attendance Hours of
 Hours % events study
 (admin.) (admin.) (survey)

Treatment 0.245 0.016* -0.033

 (0.169) (0.009) (0.722)
Baseline – w1 0.781*** 0.965*** 0.451***

 (0.034) (0.032) (0.068)

Tariff quintiles ✔ ✔ ✔
SES ✔ ✔ ✔
Female ✔ ✔ ✔
Department ✔ ✔ ✔
Age ✔ ✔ ✔

Observations 672 672 520
Composition of study time
 Study Hours Study Hours Study hours Study Hours Study Hours
 Compulsory Reading Notes Testing Other
 % % % % %

Treatment -0.015 -0.002 0.008 0.020** -0.012

 (0.020) (0.014) (0.014) (0.010) (0.010)

Baseline – w1 0.417*** 0.095* 0.322*** 0.300*** 0.091**

 (0.053) (0.052) (0.057) (0.057) (0.042)

Tariff quintiles ✔ ✔ ✔ ✔ ✔

SES ✔ ✔ ✔ ✔ ✔

Female ✔ ✔ ✔ ✔ ✔

Department ✔ ✔ ✔ ✔ ✔

Age ✔ ✔ ✔ ✔ ✔

Observations 502 502 502 502 502
Study Habits

Study next … Overdue Longest Interested Doing worst Scheduled

Treatment 0.034 0.097** 0.073* 0.158*** 0.027

 (0.031) (0.041) (0.040) (0.039) (0.037)

Baseline – w1 0.171*** 0.159*** 0.318*** 0.338*** 0.323***

 (0.036) (0.043) (0.034) (0.032) (0.034)

Tariff quintiles ✔ ✔ ✔ ✔ ✔

SES ✔ ✔ ✔ ✔ ✔

Female ✔ ✔ ✔ ✔ ✔

Department ✔ ✔ ✔ ✔ ✔

Age ✔ ✔ ✔ ✔ ✔

 ✔ ✔ ✔ ✔ ✔

Observations 485 519 520 516 516
Other effects No changes in other non-cognitive traits
Other non-cognitive traits

 Grit Goal Planning
 performance efficacy
 learning

Treatment
 -0.014 0.062 -0.004

 (0.031) (0.081) (0.076)
Baseline – w1
 0.679*** 0.526*** 0.597***

 (0.032) (0.040) (0.040)
Tariff quintiles ✔ ✔ ✔
SES ✔ ✔ ✔
Female ✔ ✔ ✔
Department ✔ ✔ ✔
Age ✔ ✔ ✔

Observations 520 520 518
Other effects No changes in other non-cognitive traits No effect of treatment on replies to successive waves No effect on attrition generally No changes in growth mindset in year 2 and 3 No changes in inputs in year 2 and 3
Multiple hypotheses Large number of variables including various measures of attainment, beliefs and inputs Multiple hypotheses problem Factor analysis OR inverse covariance weighting (ICW) method Anderson (2008) ICW method to create 5 “latent” summary indexes Attainment in the first year (including progression to 2nd and 3rd year) Beliefs on the productivity of effort Study: quantity (attendance, hours of study, etc.) Study: composition (% time spent on compulsory, note taking, etc.) Study: habits (study next what is … overdue, etc.)
Summary indexes
 Study: Study: Study:
 Beliefs Attainment
 quantity composition habits

Treatment 0.1850** 0.1649** 0.0688 0.1312 0.1738**

 (0.0756) (0.0729) (0.0576) (0.0900) (0.0796)

Baseline – w1 0.1214** 0.0867 0.6608*** 0.0792* 0.3594***

 (0.0533) (0.1191) (0.0442) (0.0413) (0.0455)

Tariff quintiles ✔ ✔ ✔ ✔ ✔

SES ✔ ✔ ✔ ✔ ✔

Female ✔ ✔ ✔ ✔ ✔

Department ✔ ✔ ✔ ✔ ✔

Age ✔ ✔ ✔ ✔ ✔

 ✔ ✔ ✔ ✔ ✔

Observations
 587 655 512 502 519
Heterogeneity By the stratifying variables: Gender Tariff score (initial attainment) SES
By gender
By gender
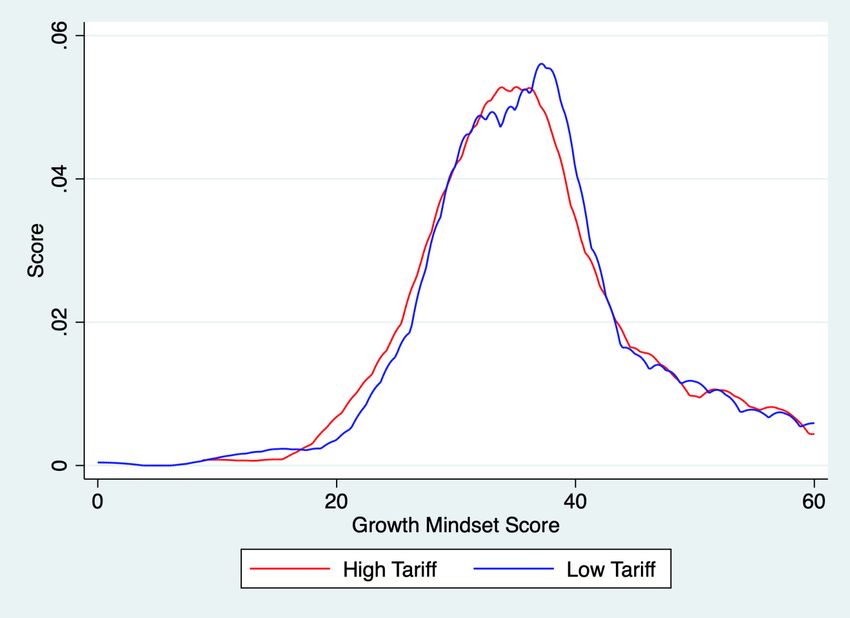
By Tariff score
By SES
External validity A companion study was conducted the year after the current study at another university in the UK This was a one-wave study where participants were exposed to the same intervention and their growth mindset beliefs were collected soon afterwards (no pre-treatment measure of beliefs) Balancing on a range of demographic variables was checked Data on first year grades was obtained from administrative records
External validity
 Growth First year Mark
 mindset marks > 70%

Treatment
 7.164*** 0.180** 0.073**

 (0.824) (0.080) (0.035)

Tariff ✔ ✔ ✔
SES ✔ ✔ ✔
Female ✔ ✔ ✔
Department ✔ ✔ ✔

Observations 805 805 805
External validity
 Growth First year Mark
 mindset marks > 70%

Treatment
 7.164*** 0.180** 0.073**

 (0.824) (0.080) (0.035)

Tariff ✔ ✔ ✔
SES ✔ ✔ ✔

 ✔ ✔
Female
 Effect✔on marks and probability
Department ✔ ✔ ✔ is highly comparable to
 of a first
 what we find in our sample
Observations 805 805 805
External validity
 Growth First year Mark
 mindset marks > 70%

 Treatment
 7.164*** 0.180** 0.073**

 (0.824) (0.080) (0.035)

 Tariff ✔ ✔ ✔
 SES ✔ ✔ ✔

 ✔ ✔
 Female
 Effect✔on marks and probability
 Department ✔ ✔ ✔ is highly comparable to
 of a first
 what we find in our sample
 Observations 805 805 805

TE on growth mindset is
higher than in our sample, but
this is only short term
External validity
 Growth First year Mark
 mindset marks > 70%

Treatment
 7.164*** 0.180** 0.073**

 (0.824) (0.080) (0.035)

Tariff ✔ ✔ ✔
SES ✔ ✔ ✔
Female ✔ ✔ ✔
Department ✔ ✔ ✔

Observations 805 805 805
Summary We analyse the effect of a new intervention aimed at changing students’ growth mindset and their study inputs and habits We find that this intervention has had an effect on students’ growth mindset, beliefs about the productivity of effort, and final grades We see effect of the intervention on study habits Some evidence that students have changed the way they study (study next … what I am worst at) in line with the Growth Mindset message Heterogeneity analysis reveals that males and low-attainment students might benefit more, but no differences by SES
You can also read