I. UNSD/UNEP Questionnaire on Environment Statistics - results and plans for the 2018 round of data collection - Fifth Meeting of the Expert Group ...
←
→
Page content transcription
If your browser does not render page correctly, please read the page content below

I. UNSD/UNEP Questionnaire on Environment
   Statistics – results and plans for the 2018
             round of data collection

    Fifth Meeting of the Expert Group on Environment Statistics
                      New York, United States of America
                               16-18 May 2018
UNSD/UNEP Questionnaire on Environment Statistics
• Objective: to provide internationally comparable statistics on environmental issues based on
  standard questionnaires and methodology.
• About 170 member states and areas in 5 languages.
• Complemented by the OECD/Eurostat Joint Questionnaire on the State of the Environment – their
  member states.
• UNSD/UNEP Questionnaire is consistent and harmonized with the OECD/Eurostat Questionnaire.
  Close collaboration is maintained on conceptual issues, validation procedures and data validation.
• Sent to National Statistical Offices and Ministries of Environment (usually) every two years.
• 2018 will be the 9th collection round since 1999.
• Better alignment with the System of National Accounts, System of Environmental-Economic
  Accounting through the use of the International Standard Industrial Classification of all economic
  activities, rev. 4 (ISIC).

UNSD/UNEP Questionnaire on Environment Statistics
                - water section
Table W1: Renewable Freshwater Resources        Modified breakdown of
Table W2: Freshwater Abstraction and Use        ISIC being considered
                                                per SDG demand
Table W3: Water Supply Industry (ISIC 36)
Table W4: Wastewater Generation and Treatment
Table W5: Population Connected to Wastewater
Treatment
Table W6: Supplementary Information Sheet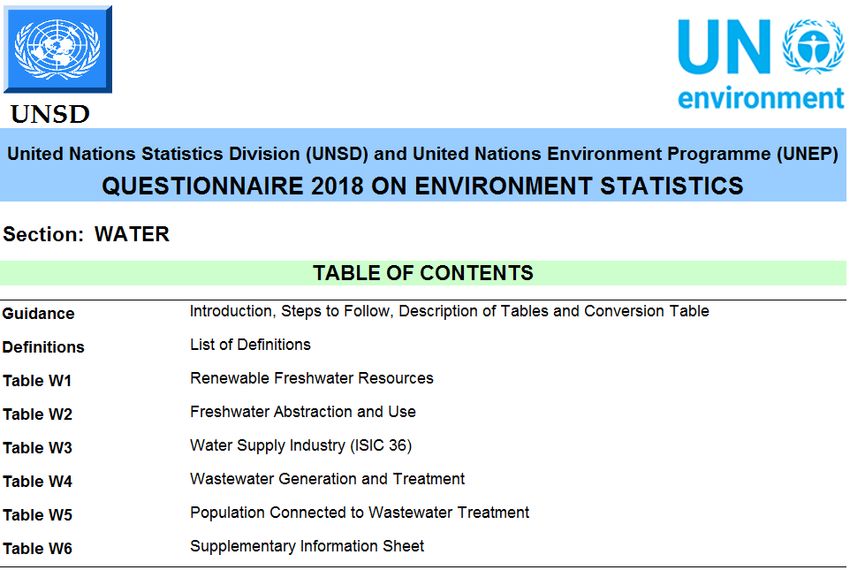
UNSD/UNEP Questionnaire on Environment Statistics
                   - waste section
Table R1: Generation of Waste by Source
Table R2: Management of Hazardous Waste
Table R3: Management of Municipal Waste (Municipal waste generated variable being added per SDG
demand)
Table R4: Composition of Municipal Waste
Table R5: Management of Municipal Waste ― City Data (new variable being
added) (Municipal waste generated variable being added per SDG demand)
Table R6: Electronic waste generation and collection (Completely NEW in 2018)
Table R7: Supplementary Information Sheet
2016 collection round results – response rate above 50%
    50%

    45%

                                                                                      51%
    40%                                                                      2016: 89/173 countries
                                                      Approx. 49%                provided data
                                                   2006, 2008 and 2010
    35%

    30%
                       29%
              1999: 49/168 countries
    25%           provided data

    20%
       1999   2001   2002       2004   2005 2006   2008           20102011   2013 2014        2016
% response rate by region from 2006 collection round and
90
                         onward
80

70

60

50

40

30

20

10

0
             2006                    2008                    2010                   2013                    2016
                       Africa     Asia      Europe      Latin America and the Caribbean       Oceania

 Response rates calculated per number of countries or areas in each geographical region on the Statistics Division
 M49 list as of 2017. The M49 list of countries or areas, codes and abbreviations is available from:
 http://unstats.un.org/unsd/methods/m49/m49alpha.htm.
Dialogue with various stakeholders • UN Environment, UN-HABITAT, Food and Agricultural Organization of the UN, academia, etc. have all been in contact with UNSD regarding use of the Questionnaire to collect data for SDG indicators. • United Nations University: pursuant to collecting data on electronic waste. • Eurostat: a Shared Environment Information System (SEIS) project on waste statistics… in 2016, waste section expanded to collect data on generation of hazardous waste by source industry; and populations (total, urban, rural) served by municipal waste collection
Degree to which UNSD is willing to modify
            Questionnaire content
• Modification of variables to keep Questionnaire relevant to the
  demand of the day (SDG-related or otherwise), while upholding
  scientific principles of statistics
• Mindful of any potential loss of existing time series, and the evolving
  nature of environment statistics (e.g. different ISIC breakdowns being
  considered)
• Maintaining harmonization with OECD/Eurostat Questionnaire
• Mindful of respondent burden to countries
• Pilot testing in advance of modification to the extent possible (for
  example, electronic waste pilot, 2017)
• Translation into all five languages
Citations, user requests and feedback • Citations of the data collection in academic research, UN agency publications on waste and wastewater, etc. • Requests received from academics and researchers • Footnotes provided by countries are of great value • Comments from users referring to footnotes as handy clues to interpreting data • Example footnotes (waste section): • “Figure refers to waste generated in the capital city only.” • “Figure restricted to large waste generators due to limited reporting requirements at the national level.” • “Data are in cubic metres.” (as opposed to thousands of tonnes) • “Data refer to recycling and composting together.” • “Informal sector recycling is excluded.”
Data dissemination
• https://unstats.un.org/unsd/envstats/qindicators Indicator tables: 25 and possibly more for water; 15 for
  waste - time series; latest year available; per capita calculations
• https://unstats.un.org/unsd/envstats/snapshots/ Country snapshots – selection of national environment
  statistics complemented by key economic and social indicators, including other themes (Air and Climate,
  Biodiversity, Economy, Energy, Land and Agriculture, Population). Additional sources include UNSD’s sister
  divisions, and the Food and Agricultural Organization of the UN (FAO)
• https://unstats.un.org/unsd/envstats/country_files Country files - Validated country replies to the water and
  waste sections of the Questionnaire.
Data dissemination – indicator tables (time series)
More targeted to data miners; better allowing for
coding, user’s modification of data per their needs…
Data dissemination – indicator tables (latest year available)
II. Selected SDG indicators related to the
  UNSD/UNEP Questionnaire on Environment
Statistics – indicators 6.3.1, 6.4.1, 6.4.2, 11.6.1,
                   12.4.2, 12.5.1
The Sustainable Development Goals
• On 6 March 2015, at its 46th session, the United Nations Statistical
Commission (UNSC) created the Inter-agency and Expert Group on
SDG Indicators (IAEG-SDGs), composed of Member States and
including regional and international agencies as observers… tasked to
develop and implement the global indicator framework for the Goals
and targets of the 2030 Agenda… refinements on several indicators, at
the 48th session of the UNSC in March 2017.
• 25 September, 2015: The 193-Member United Nations General
Assembly today formally adopted the 2030 Agenda for Sustainable
Development, along with a set of bold new Global Goals, which
Secretary-General Ban Ki-moon hailed as a universal, integrated and
transformative vision for a better world.
https://news.un.org/en/story/2015/09/509732-un-adopts-new-global-goals-charting-sustainable-development-people-and-planetThe Sustainable Development Goals
The Sustainable Development Goals

 IAEG-SDGs tier classification for global SDG indicators (updated 15 Dec 2017):
     https://unstats.un.org/sdgs/files/Tier%20Classification%20of%20SDG%20Indicators_15%20Dec%202017_web%20final.pdf
Ensure availability and sustainable
management of water and sanitation for all
Target 6.3: By 2030, improve water quality by reducing pollution, eliminating
dumping and minimizing release of hazardous chemicals and materials, halving the
proportion of untreated wastewater and substantially increasing recycling and safe
reuse globally.
=> Indicator 6.3.1: Proportion of wastewater safely treated
Target 6.4: By 2030, substantially increase water-use efficiency across all sectors
and ensure sustainable withdrawals and supply of freshwater to address water
scarcity and substantially reduce the number of people suffering from water
scarcity.
=> Indicator 6.4.1: Change in water-use efficiency over time
=> Indicator 6.4.2: Level of water stress: freshwater withdrawal as a
proportion of available freshwater resourcesIndicator 6.3.1: Proportion of wastewater safely treated (tier II)
• Custodian Agencies: WHO, UN-Habitat, UNSD; partner
agencies: UN Environment, OECD and Eurostat
• Endeavouring to use the UNSD/UNEP Questionnaire to
the extent possible.
• Response rates remain a challenge
• UNSD participated in an Expert Group Meeting on
Global Wastewater Monitoring for the SDGs with co-
custodians and other experts.
• Available metadata are here: https://unstats.un.org/sdgs/metadata/files/Metadata-06-
03-01.pdf
Table W4, Line: Category Unit
1 Total wastewater generated
7 Wastewater treated in urban wastewater treatment plants
1000 m3/d
11 Wastewater treated in other treatment plants
15 Wastewater treated in independent treatment facilities
Indicator = (Lines 7 + 11 + 15)/Line 1W4: Wastewater Generation and Treatment Line Category Unit 1 Total wastewater generated 2 By: Agriculture, forestry and fishing (ISIC 01-03) 3 Manufacturing (ISIC 10-33) 4 Electricity industry (ISIC 351) 5 Other economic activities 6 Households 7 Wastewater treated in urban wastewater treatment plants 8 Of which: Primary treatment Millions metres3 9 Secondary treatment per year 10 Tertiary treatment 11 Wastewater treated in other treatment plants 12 Of which: Primary treatment 13 Secondary treatment 14 Tertiary treatment 15 Wastewater treated in independent treatment facilities 16 Non-treated wastewater 17 Sewage sludge production (dry matter) 1000 t
Indicator 6.4.1: Change in water-use efficiency over time (tier II)
•   Custodian Agency: FAO; partner agencies: UNSD, UN Environment, IUCN, OECD and Eurostat
•   Using the seven variables, a contribution to a prospective estimate of the indicator can be derived.
•   Application of International Standard Industrial Classification or all economic activities (ISIC) rev. 4.
•   Ensuring data provided by countries can inform for SDG indicator compilation, but also for environment
    statistics, and environment-economic accounting… considering modifying ISIC breakdown.
•   Ensuring no duplicate data collections are sent by international organisations to countries.
•   Issues raised in discussions include definition of “abstraction” as opposed to “use”. Per the
    Questionnaire, “Total freshwater available for use” is equal to “Freshwater abstracted” + “Desalinated
    water” + “Reused water” + “Imports of water” – “Exports of water”.
•   Abstraction is known to be used as a proxy for Use.
•   Available metadata are here: https://unstats.un.org/sdgs/metadata/files/Metadata-06-04-01.pdf
                 Tables W2
                                                        Category                                    Unit
                and W3, line:
                   W2, 4      Freshwater abstracted by water supply industry (ISIC 36)
                   W2, 5      Freshwater abstracted by households
                              Freshwater abstracted by agriculture, forestry and fishing (ISIC
                   W2, 6
                              01-03)
                                                                                               millions m3/y
                   W2, 7      Freshwater abstracted by manufacturing (ISIC 10-33)
                   W2, 8      Freshwater abstracted by electricity industry (ISIC 351)
                   W2, 9      Freshwater abstracted by other economic activities
                    W3,1      Gross freshwater supplied by water supply industry (ISIC 36)
Table W2: Freshwater Abstraction and Use
Line Category Unit
1 Fresh surface water abstracted
2 Fresh groundwater abstracted
3 Freshwater abstracted (=1+2)
Of which abstracted by:
4 Water supply industry (ISIC 36) Millions m3
5 Households per year
6 Agriculture, forestry and fishing (ISIC 01-03)
7 Manufacturing (ISIC 10-33)
8 Electricity industry (ISIC 351)
9 Other economic activitiesTable W3: Water Supply Industry (ISIC 36)
Line Category Unit
1 Gross freshwater supplied by water supply industry (ISIC 36)
2 Losses during transport by (ISIC 36)
Net freshwater supplied by water supply industry (ISIC 36) (=1-2)
3 (=4+5+6+7+8)
of which supplied to: Millions
m3 per
4 Households
year
5 Agriculture, forestry and fishing (ISIC 01-03)
6 Manufacturing (ISIC 10-33)
7 Electricity industry (ISIC 351)
8 Other economic activities
Population supplied by water supply industry (ISIC 36)
19 Total population supplied by water supply industry (ISIC 36)
10 Urban population supplied by water supply industry (ISIC 36) %
11 Rural population supplied by water supply industry (ISIC 36)Indicator 6.4.2: Level of water stress: freshwater withdrawal as a
proportion of available freshwater resources (tier I)
• Custodian Agency: FAO; partner agencies: UNSD, UN
Environment, IUCN, OECD and Eurostat
• Using the two variables below, a contribution to a
prospective estimate of the indicator can be derived.
• Metadata are available here: https://unstats.un.org/sdgs/metadata/files/Metadata-06-04-
02.pdf
Tables W1, W2,
Category Unit
line:
W1,5 Renewable freshwater resources
millions m3/y
W2,3 Freshwater abstracted
Indicator = Line W2,3/Line W1,5Table W2: Freshwater Abstraction and Use
Line Category Unit
1 Fresh surface water abstracted
2 Fresh groundwater abstracted
3 Freshwater abstracted (=1+2)
Of which abstracted by:
4 Water supply industry (ISIC 36)
Millions m3
5 Households per year
6 Agriculture, forestry and fishing (ISIC 01-03)
7 Manufacturing (ISIC 10-33)
8 Electricity industry (ISIC 351)
9 Other economic activitiesTable W1: Renewable Freshwater Resources
Line Category Unit
1 Precipitation
2 Actual evapotranspiration
3 Internal flow (=1-2)
4 Inflow of surface and groundwaters from neighbouring
countries
Millions m3 per
5 year
Renewable freshwater resources (=3+4)
6 Outflow of surface and groundwaters to neighbouring
countries
7 Of which:
Secured by treaties
8 Not secured by treaties
9 Outflow of surface and groundwaters to the seaMake cities and human settlements
inclusive, safe, resilient and sustainable
• Target 11.6: By 2030, reduce the adverse per capita environmental
impact of cities, including by paying special attention to air quality and
municipal and other waste management.
=> Indicator 11.6.1: Proportion of urban solid waste regularly
collected and with adequate final discharge out of total urban solid
waste generated, by citiesIndicator 11.6.1: Proportion of urban solid waste regularly
collected and with adequate final discharge out of total
urban solid waste generated, by cities (tier II)
• Custodian Agencies: UN-Habitat and UNSD; partner agencies: UN Environment
• UNSD involved in methodology and data collection
• UNSD participating in UN Environment and UN-HABITAT Joint Expert Group Meeting on Waste SDG
indicators 11.6.1, 12.4.2, 12.5.1 (participating in refinements to draft methodologies)
• Issues:
• No internationally agreed definition of urban solid waste
=> Invent one: What should be in?
=> Use a proxy: Municipal waste ?
• What is adequate final discharge?
• Denominator: Waste "collected" or "generated" ? => Difficult to estimate municipal waste generated.
• Definition of a minimum number or size of cities a country should report on.
• OECD/Eurostat do not collect data at the city level. Eurostat did a pilot at the European regions level => No city level
for "developed" countries.
• Available metadata are here: https://unstats.un.org/sdgs/metadata/files/Metadata-11-06-01.pdfIndicator 11.6.1: Proportion of urban solid waste regularly
collected and with adequate final discharge out of total
urban solid waste generated, by cities (tier II)
• Using the four variables, a prospective estimate of the indicator can be
derived.
• Adequate final discharge: Recycling, composting and incineration with
energy recovery.
• Time series exist for waste “collected” in the UNSD/UN Environment
Questionnaire at the city level. UNSD so far does not collect on municipal
waste generated but will be in 2018.
Table
Category Unit
R5, line:
Total amount of municipal waste generated
1
(NEW!)
6 Recycling 1000 t
7 Composting
9 Incineration with energy recovery
Indicator = (Lines 6 + 7 + 9)/Line 5 28Table R5: Management of Municipal Waste –
City Data
Line Category Unit
1 Total population of the city 1000 inh.
2 Total amount of municipal waste generated (NEW!) 1000 t
Percentage of city population served by municipal
3 waste collection %
4 Municipal waste collected from households
5 Municipal waste collected from other origins
6 Total amount of municipal waste collected (=3+4)
Amounts going to:
7 Recycling
8 Composting 1000 t
9 Incineration
10 of which: with energy recovery
11 Landfilling
12 of which: controlled landfilling
13 Other, please specify in the footnoteEnsure sustainable consumption and production patterns • Target 12.4: By 2030, achieve the environmentally sound management of chemicals and all wastes throughout their life cycle, in accordance with agreed international frameworks, and significantly reduce their release to air, water and soil in order to minimize their adverse impacts on human health and the environment. => Indicator 12.4.2: Hazardous waste generated per capita and proportion of hazardous waste treated, by type of treatment => Indicator 12.5.1: National recycling rate, tons of material recycled
Indicator 12.4.2: Hazardous waste generated per capita and
proportion of hazardous waste treated, by type of treatment
                          (tier III)
    • Custodian Agencies: UN Environment (more specifically the BRS
      Secretariat) and UNSD; partner agencies: OECD and Eurostat
    • UNSD involved in the methodology and data collection
    • Issues:
        • Terminology of the UNSD/UN Environment Questionnaire and national reports
          under the Basel Convention not harmonized.
        • Definition of treatment: recycled and incinerated or incinerated with energy
          recovery? (The Basel Convention does not have a definition of treatment)
        • Inclusion of imports-exports => As they can be important for some countries, they
          should be included.
        • Year of treatment can be different from year of generation.
    • Work plan available here: https://unstats.un.org/sdgs/tierIII-indicators/files/Tier3-12-04-02.pdf
      which references the UNSD/UNEP Questionnaire and OECD and Eurostat
      data collections
Indicator 12.4.2: Hazardous waste generated per capita and
proportion of hazardous waste treated, by type of treatment
(tier III)
• Inclusion of imports-exports in the denominator => use of line
5: Hazardous waste treated or disposed of during the year.
• Treatment defined as recycled and incinerated.
• Using the four variables below, prospective estimates of the
indicator can be derived, one per capita, and two for the types
of treatment.
• Both data from the UNSD/UN Environment Questionnaire and
the national reports under the Basel Convention should be
viewed as complementary (e.g. in terms of number of countries
reporting) and can be used for quality checks.
Indicator = Line 2/Population Indicator = Line 6/Line 2 Indicator = Line 7/Line 2
Table R2, line: Category Unit
2 Hazardous waste generated during the year
5 Hazardous waste treated or disposed of during the year
tonnes
6 Recycling
7 IncinerationTable R2: Management of Hazardous Waste
Line Category Unit
1 Stock of hazardous waste at the beginning of the year
2 Hazardous waste generated during the year
3 Hazardous waste imported during the year
4 Hazardous waste exported during the year
Hazardous waste treated or disposed of during the year
5 (=6+7+9+10)
Amounts going to: tonnes
6 Recycling
7 Incineration
8 of which: with energy recovery
9 Landfilling
10 Other, please specify in the footnote
11 Stock of hazardous waste at the end of the year (=1+2+3-4-5)Indicator 12.5.1: National recycling rate,
tons of material recycled (tier III)
• Custodian Agencies: UN Environment and UNSD; partner
agencies: OECD and Eurostat
• UNSD involved in the methodology and data collection
• Issues:
• Difficult to have a statistics representing all waste, and other types of
waste (hazardous waste) already monitored by other indicators => use
of municipal waste as a proxy.
• Discussion with respect to municipal waste “collected” as opposed to
municipal waste “generated” is also a feature (as in indicator 11.6.1).
• Year of generation or collection can be different from year of
recycling.
• Inclusion of imports-exports of municipal waste.
• Work plan available here: https://unstats.un.org/sdgs/tierIII-indicators/files/Tier3-12-05-01.pdf which
references the UNSD/UNEP Questionnaire and OECD and Eurostat
data collectionsIndicator 12.5.1: National recycling rate,
tons of material recycled (tier III)
• Using two of the three variables, a prospective estimate of the
indicator can be derived.
• UNSD will collect data on “municipal waste generated” in
addition to “municipal waste collected” in 2018.
• Imports-exports can be either included (line 6) or not (line 3).
Table R3,
Category Unit
line:
Total amount of municipal waste generated
1
(NEW!)
7 Municipal waste managed in the country 1000 t
8 Recycling
Indicator = Line 8/Line 7; or Indicator = Line 8/Line 1Line Category Unit
Table R3: 1
2
Total amount of municipal waste generated (NEW!)
Municipal waste collected from households
Management of 3 Municipal waste collected from other origins
Municipal 4
5
Total amount of municipal waste collected (=1+2)
Municipal waste imported for treatment/disposal
Waste 6 Municipal waste exported for treatment/disposal
7 Municipal waste managed in the country (=3+4-5)
Amounts going to: 1000 t
8 Recycling
9 Composting
10 Incineration
11 of which: with energy recovery
12 Landfilling
13 of which: controlled landfilling
14 Other, please specify in the footnote
15 Total population served by municipal waste collection
16 Urban population served by municipal waste collection %
17
Rural population served by municipal waste collectionAverage number of responses for variables relevant to
40
SDG indicators per year for years 2010-2015
35
30
Recycling rate
25
Water stress
Water-use efficiency
Hazardous waste
20
15
Wastewater
10
5
0
Indicator 6.3.1 Indicator 6.4.1 Indicator 6.4.2 Indicator 12.4.2 Indicator 12.5.1
Indicator 11.6.1 (urban solid waste, city level) omitted from analysis since its data are collected at the city rather than country level.Percentage increase in responses for variables relevant to SDG
indicators between ex poste 2013 collection round and ex
100
poste 2016 collection round
90
80
70
Hazardous waste
Wastewater
60
Water-use efficiency
Recycling rate
50
Water stress
40
30
20
10
0
Indicator 6.3.1 Indicator 6.4.1 Indicator 6.4.2 Indicator 12.4.2 Indicator 12.5.1
Indicator 11.6.1 (urban solid waste, city level) omitted from analysis since its data are collected at the city rather than country level.You can also read