Bicester Settlement profile of Health and Wellbeing evidence Updated December 2020
←
→
Page content transcription
If your browser does not render page correctly, please read the page content below
Bicester
      Settlement profile
             of
Health and Wellbeing evidence

   Updated December 2020
         Revised (v2)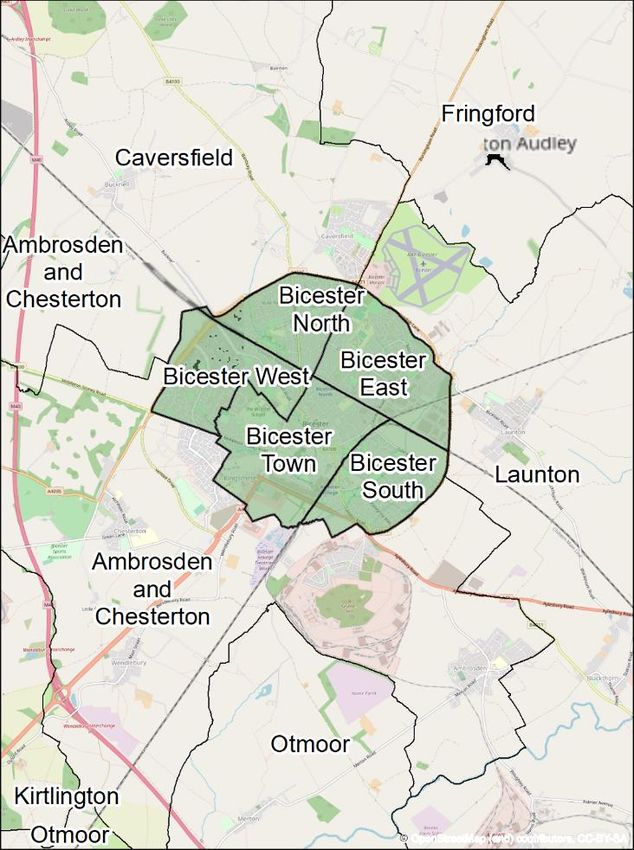
Bicester Health and Wellbeing Profile 2020 Oxfordshire JSNA 2020

CONTENTS
1    Summary ............................................................................................................................. 3
2    Geographical boundaries .................................................................................................... 5
3    Population profile ................................................................................................................ 9
    3.1    Population by age ......................................................................................................... 9
    3.2    People living in Communal Establishments .................................................................11
4    Deprivation and Children in poverty ...................................................................................12
    4.1    Indices of Deprivation 2019 .........................................................................................12
    4.2    Child Poverty ...............................................................................................................14
5    Health and wellbeing ..........................................................................................................15
    5.1    Health profiles for Bicester ..........................................................................................15
    5.2    Provision of care ..........................................................................................................20
    5.3    Health conditions .........................................................................................................21
    5.4    Physical activity and healthy weight ............................................................................23
      5.4.1      Physical Activity ....................................................................................................23
      5.4.2      Child obesity .........................................................................................................24
6    Other - house prices and commuting data .........................................................................27
ANNEX 1: Data sources for indicators used in ward health profiles .........................................29
ANNEX 2: Data sources used in this report ..............................................................................31

Version 2 revision: Document revised July 2021 to correct errors in figure 14 (section 5.4.1) –
MSOA labels were originally mismatched.

This report provides health and wellbeing evidence from the Oxfordshire Joint Strategic Needs
Assessment (JSNA) for Bicester.
Reports and related information for the full Oxfordshire Joint Strategic Needs Assessment is
available on the Oxfordshire Insight website at http://insight.oxfordshire.gov.uk/cms/joint-
strategic-needs-assessment

    Page 2 December 2020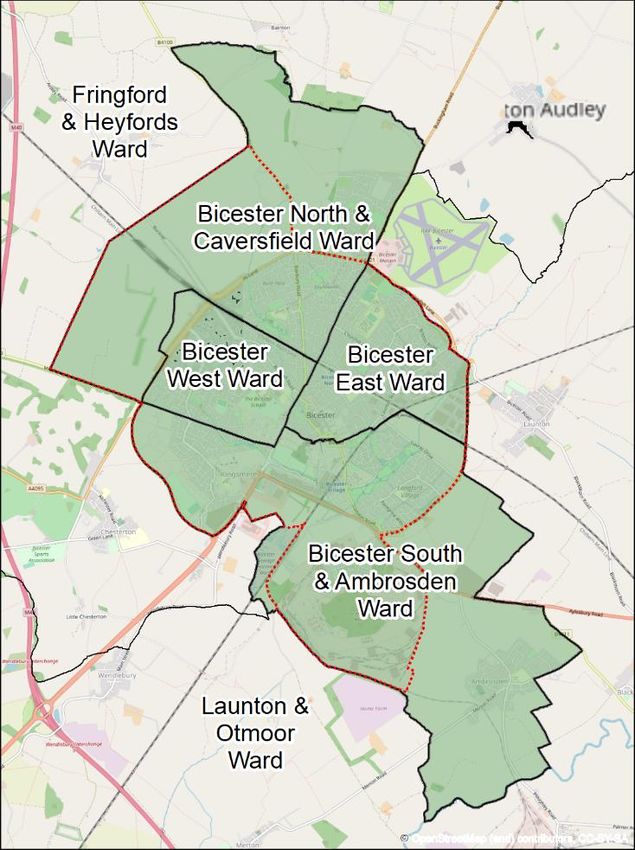
Bicester Health and Wellbeing Profile 2020 Oxfordshire JSNA 2020

1 Summary

Population

  •   Ward boundary changes in 2016, reduced the number of Bicester wards from 5 to 4 and
      extended the area covered to outside the parish boundary.
  •   The population of Bicester wards (new boundaries) was 35,600 in mid-2019 (ONS).
  •   The population inside the original (comparable) Bicester parish boundary (old wards)
      increased from 30,500 in mid-2009 to 30,600 in mid-2019.
         o A proportion of residents between 35 and 44 in 2009 (and who would be
           expected to be aged 45 to 54 by 2019) are no longer resident in Bicester.
  •   Comparing Bicester’s age profile in 2019 (wards) with the district, county, regional and
      national averages, shows a slightly higher proportion in the younger age group (0-15)
      and a lower proportion of over 65s.

Deprivation and children in poverty

  •   According to the latest Indices of Deprivation (2019), Bicester is relatively less deprived
      than other parts of Oxfordshire (areas of Banbury and Oxford). The town has four areas
      that were ranked within the 50% most deprived areas nationally.
  •   The individual domain ranks highlight one of these areas as within the 10% most
      deprived for Education, Skills and Training, and another (Bicester South & Ambrosden
      15D, which covers the Bicester Village designer outlet shopping centre) as within the
      10% most deprived for Crime.
  •   According to joint DWP and HMRC estimates for 2018/19, Bicester has less than a
      quarter of children living in poverty (before housing costs). The Bicester ward with the
      highest incidence of this measure of child poverty was Bicester West (14%).

Health and wellbeing

  •   Health and wellbeing measures statistically worse than the England average for
      Bicester were:
         o Older people living alone 2011 (Bicester East)
         o Emergency hospital admissions for all causes (Bicester East and Bicester West)
         o Incidence of all cancer, breast cancer and lung cancer (Bicester East)
         o Deaths from all cancer (Bicester East)
         o Deaths from all causes; Deaths from respiratory diseases (Bicester North and
           Caversfield)
         o Emergency hospital admissions for hip fracture in 65+ (Bicester South and
           Ambrosden)

  Page 3 December 2020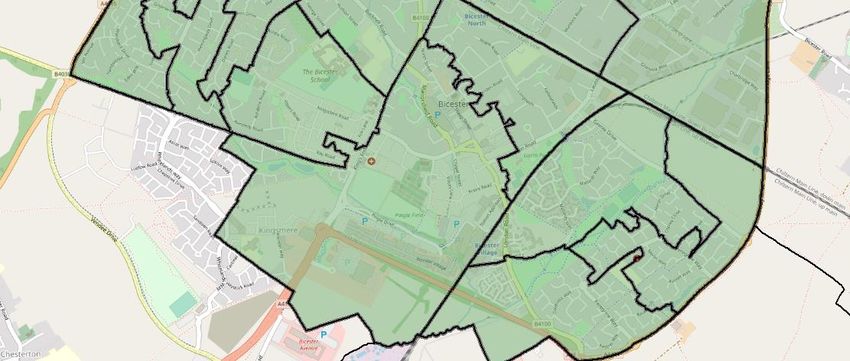
Bicester Health and Wellbeing Profile 2020 Oxfordshire JSNA 2020

 •   GP practice data (Quality Outcomes Framework) shows the prevalence of depression
     recorded by each of the three GP practices in Bicester has remained above the
     Oxfordshire Clinical Commissioning Group and England averages.
 •   According to Sport England’s small area estimates, the proportion of people aged 16+ in
     Bicester MSOAs who were physically active at least 150 minutes a week was higher in
     South and North Bicester (in line with the county proportion) than in East and West
     Bicester (lower than the county proportion).
 •   The latest data on child obesity from the National Child Measurement Programme
     shows that for both reception children (aged 4-5 years), and year 6 children (aged 10-11
     years), the proportion who are obese in Bicester is generally similar to that for the
     district and county overall. One exception is that the Bicester West MSOA has a
     significantly higher proportion of obese reception children when compared against the
     county proportion.

House prices and commuting

 •   Over the past 5 years (year ending June 2015 to year ending June 2020), median prices
     for semi-detached housing in Bicester have generally increased in line with the Cherwell
     district rate. The Bicester West ward typically has the lowest house prices, the Bicester
     South and Ambrosden ward the highest.
 •   As of the 2011 Census, 81% of Bicester commuters travelled to work within Oxfordshire.
     The local authority areas outside Oxfordshire with the highest number of out-commuters
     from Bicester were Aylesbury Vale (5%) and London (3%).
 •   Outside Bicester, the greatest numbers of commuters to Bicester were mainly living in
     Bicester’s surrounding rural hinterland.

 Page 4 December 2020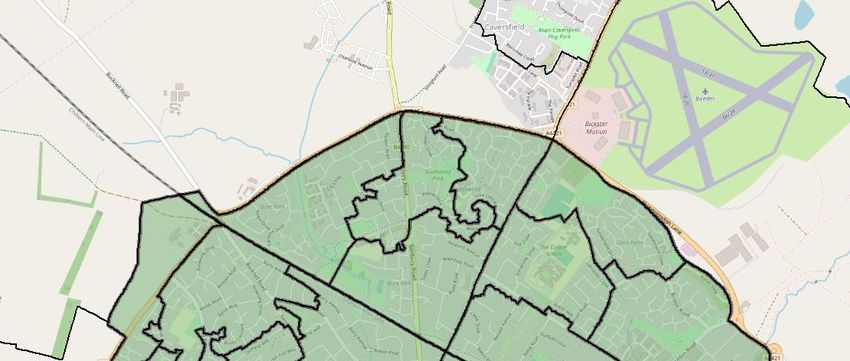
Bicester Health and Wellbeing Profile 2020 Oxfordshire JSNA 2020

2 Geographical boundaries
Data in this profile is reported using several types of geographical boundaries – administrative
and statistical.
Following ward boundary changes in 2016, Bicester wards extend beyond the parish boundary
(dotted red outline in map below) and now include 4 administrative district wards of: Bicester
East, Bicester West, Bicester North & Caversfield and Bicester South & Ambrosden.
Wards surrounding Bicester are: Fringford & Heyfords (north and west) and Launton & Otmoor
(south and east).

                                                         Current ward boundaries
 Pre-2016 ward boundaries                                (parish boundary in red)

Maps by Oxfordshire County Council

    Page 5 December 2020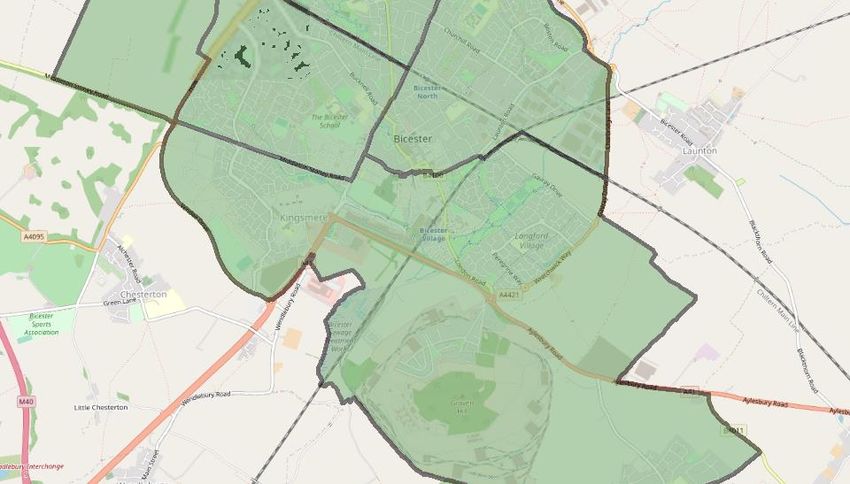
Bicester Health and Wellbeing Profile 2020 Oxfordshire JSNA 2020

In addition to these administrative boundaries, National Statistics for small areas are reported
using the statistical hierarchy developed by the Office for National Statistics.
Middle Super Output Areas (MSOAs) are used by ONS to publish Census travel to work data
and an increasing range of other social and demographic statistics.
There are four MSOAs covering Bicester parish: Cherwell 012 / 013 / 014 / 015.
Lower Super Output Areas (LSOAs) are used as the geography for publishing the national
Indices of Deprivation (IMD). In Bicester, there is a total of 19 LSOAs.

 MSOA boundaries

Maps by Oxfordshire County Council

    Page 6 December 2020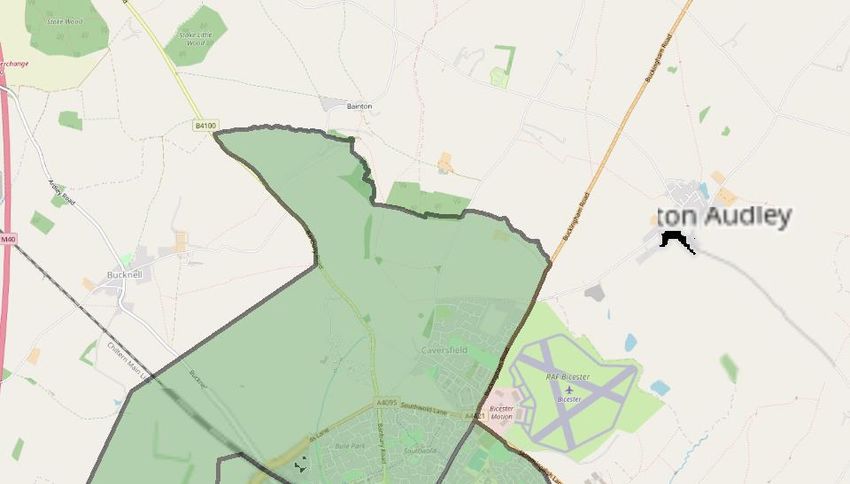
Bicester Health and Wellbeing Profile 2020 Oxfordshire JSNA 2020

 LSOA boundaries (each code within Bicester is prefixed with ‘Cherwell’)

                                                                  Cherwell 011C                      Cherwell
                                                                                                      011D

                        Cherwell 011B

                                                                 012A
                                                          012C
                                            012B                                013D
                                                                                             Cherwell 011F

                                                                         013C
                               014B                       012D

                                     014D          014C                 013B
                          014E                                                           013A
              014F

                                                                   013E
                                            014A

                                                                                015A
                                                   015D

                                                                                         015C

                                                                        015B
              Cherwell 016A

                                                                             Cherwell 011A

                                                                                                       Cherwell
                                                                         ©                              011F
Maps by Oxfordshire County Council

Each LSOA is made up of smaller Output Areas. The main dataset available at Output Area
level is the Census 2011 and Census 2001 surveys.

    Page 7 December 2020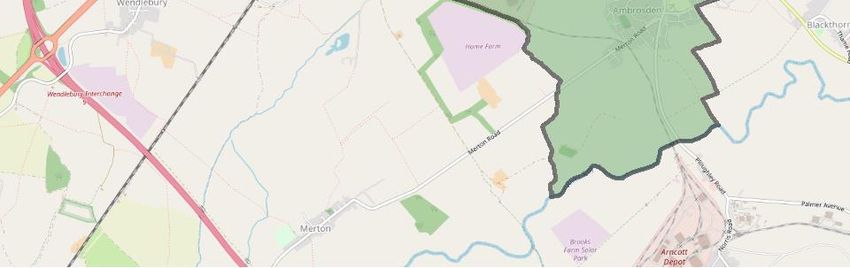
Bicester Health and Wellbeing Profile 2020 Oxfordshire JSNA 2020
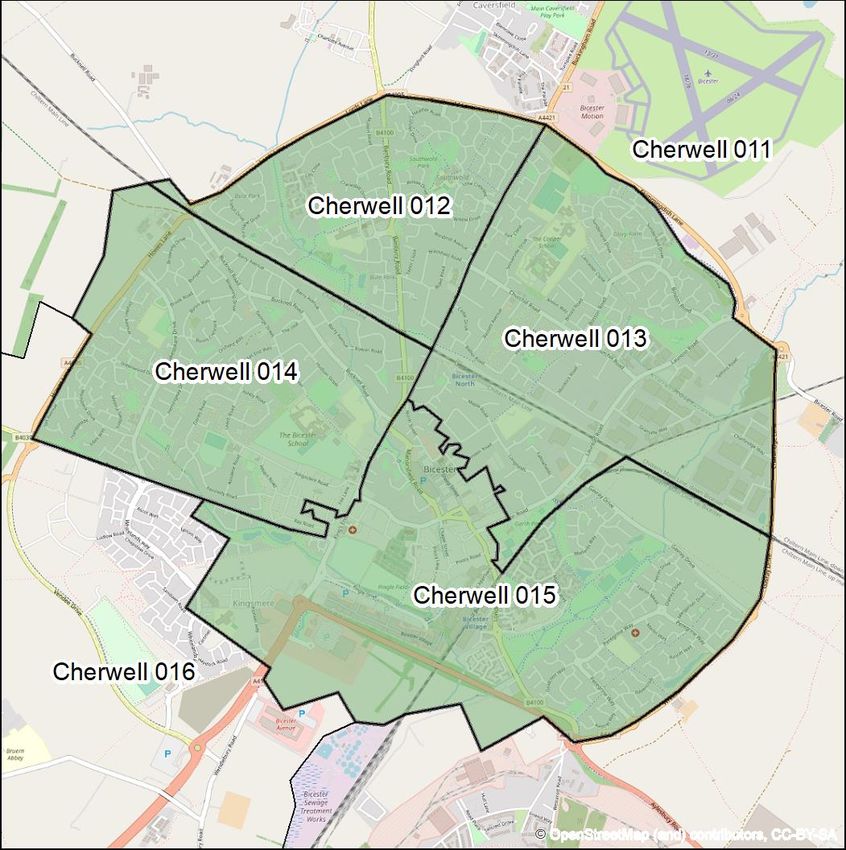
GP data
Data on prevalence of health conditions has been extracted from the Quality Outcomes
Framework (to the end of March 2020) for the following three GP groups/practices in Bicester:
• Alchester Medical Group: which consists of the following three practices:
o Langford Medical Practice
o Victoria House Surgery
o Ambrosden Surgery
• Bicester Health Centre
• Montgomery House Surgery
GP practice locations (showing ward boundaries)
Victoria
House
Surgery
Montgomery-House
Surgery
Langford
Medical
Bicester
Practice
Health
Centre
Ambrosden
Surgery
©
Maps by Oxfordshire County Council
Page 8 December 2020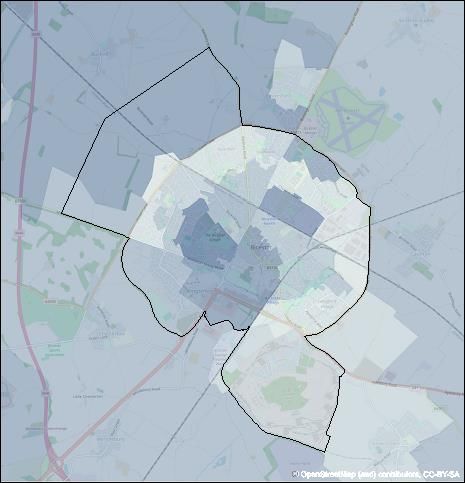
Bicester Health and Wellbeing Profile 2020 Oxfordshire JSNA 2020

3 Population profile

3.1    Population by age
According to the ONS mid-year ward population estimates, the population of Bicester wards
(new boundaries) was 35,600 in mid-2019.
The population inside the original (comparable) Bicester parish boundary (old wards) increased
from 30,500 in mid-2009 to 30,600 in mid-2019. This growth - over a ten year period – was an
increase of just under 100 people or +0.2%.
The population pyramid showing females and males by 5 year age band (chart below) appears
to show some out-migration. A proportion of residents between 35 and 44 in 2009 (and who
would be expected to be aged 45 to 54 by 2019) are no longer resident in Bicester.

Figure 1 Population of Bicester parish by 5 year age band 2009 and 2019

Source: ONS parish population estimates

   Page 9 December 2020
Bicester Health and Wellbeing Profile 2020 Oxfordshire JSNA 2020

Comparing Bicester’s age profile in 2019 (wards) with the district, county, regional and national
averages, shows a slightly higher proportion in the younger age group (0-15) and a lower
proportion of over 65s.

Figure 2 Proportion of Bicester wards aged 0-15 and 65+ (2019)

Source: ONS mid-year population estimates for Bicester wards

  Page 10 December 2020
Bicester Health and Wellbeing Profile 2020 Oxfordshire JSNA 2020

3.2     People living in Communal Establishments
At the time of the Census 2011 survey, there were 62 people living in Bicester counted as
living in a communal establishment out of a total of 30,900 residents (0.2%).
Of the total of 62 people living in Bicester counted as living in a communal establishment in
2011:
    •   39 people were in medical communal establishments of which 30 were in a care home
        (without nursing) and 9 were in a NHS establishment.
    •   23 people were in an “other” establishment (religious, hotel/B&B and other)
In wards just outside Bicester:
    •   Ambrosden and Chesterton ward had 300 people living in a defence establishment
        (Bicester Garrison) and 80 people in a school.
    •   Launton ward had 9 people in a defence establishment and 867 in a prison (Bullingdon
        Prison in Arncott village).

Table 1 People living in Communal Establishments: Bicester and surrounding wards (2011)
 Area                         All people in    Care      Care      NHS:      Prison    Defence   Education   Other
                               communal        home      home      Other     service
                             establishments   without    with     hospital
                                              nursing   nursing
 Cherwell                        2,952         288       511         9        867       311        687       2,125
 Bicester wards                   62            30        0          9         0         0          0         23
 Bicester as % of Cherwell        2%           10%        0%       100%        0%        0%         0%        1%
 Bicester East                    13            0         0          0         0         0          0         13
 Bicester North                    0            0         0          0         0         0          0         0
 Bicester South                    0            0         0          0         0         0          0         0
 Bicester Town                    49            30        0          9         0         0          0         10
 Bicester West                     0            0         0          0         0         0          0         0

 Ambrosden and Chesterton         383           0         0          0         0        302         80        1
 Caversfield                      103           0        103         0         0         0          0         0
 Launton                          878           0         0          0        867        9          0         2
Source: ONS Census 2011 table QS421

  Page 11 December 2020
Bicester Health and Wellbeing Profile 2020 Oxfordshire JSNA 2020
4 Deprivation and Children in poverty
4.1 Indices of Deprivation 2019
Indices of Deprivation 2019
The 2019 Indices of Deprivation (IMD2019) combines measures across 7 “domains” and
includes supplementary indices of deprivation affecting children and older people.
According to this latest IMD, Bicester is relatively less deprived than other parts of Oxfordshire
(areas of Banbury and Oxford). The town has four areas that were ranked within the 50% most
deprived areas nationally.
The individual domain ranks highlight one of these areas as within the 10% most deprived for
Education, Skills and Training, and another (Bicester South & Ambrosden 15D, which covers
the Bicester Village designer outlet shopping centre) as within the 10% most deprived for
Crime.
Figure 3 IMD ranks for areas in Bicester (1 is most deprived decile) sorted on the overall IMD
Barriers Income Income
to Dep. Dep.
Education Housing Living Affecting Affecting
Employ- Skills and and Environ- Children Older
LSOA area name IMD Income ment Training Health Crime Services ment Index People
Bicester West 14A 3 4 4 2 3 2 5 6 3 6
Bicester West 14D 4 5 5 1 4 5 2 7 4 7
Bicester East 13B 5 5 5 4 4 5 9 7 6 4
Bicester South & Ambrosden 15D 5 5 6 5 5 1 6 5 7 4
Bicester East 13D 6 6 6 2 5 7 6 8 6 8
Bicester West 14C 7 7 7 4 7 5 7 7 7 7
Bicester East 13E 8 8 8 6 8 3 6 5 9 9
Bicester North & Caversfield 12D 8 7 7 5 8 8 8 7 7 7
Bicester South & Ambrosden 15A 8 9 10 5 9 9 2 10 9 7
Bicester West 14E 8 10 9 4 7 6 5 9 10 9
Bicester North & Caversfield 12A 9 9 10 6 9 10 6 4 8 8
Bicester West 14B 9 9 8 5 8 9 4 8 7 10
Bicester East 13A 10 10 10 4 9 10 8 9 9 10
Bicester East 13C 10 10 10 5 8 6 9 7 10 10
Bicester North & Caversfield 12B 10 10 10 7 9 9 4 9 9 10
Bicester North & Caversfield 12C 10 9 10 6 9 8 7 9 8 9
Bicester South & Ambrosden 15B 10 10 10 8 8 8 5 9 10 9
Bicester South & Ambrosden 15C 10 10 10 8 9 10 8 9 9 9
Bicester West 14F 10 10 10 7 10 9 4 10 8 10
Source: MHCLG English Indices of Deprivation 2019
Numbers = deprivation decile (compared with all areas in England) where 1 = most deprived 10% nationally and
10= least deprived 10% nationally.
Page 12 December 2020Bicester Health and Wellbeing Profile 2020 Oxfordshire JSNA 2020
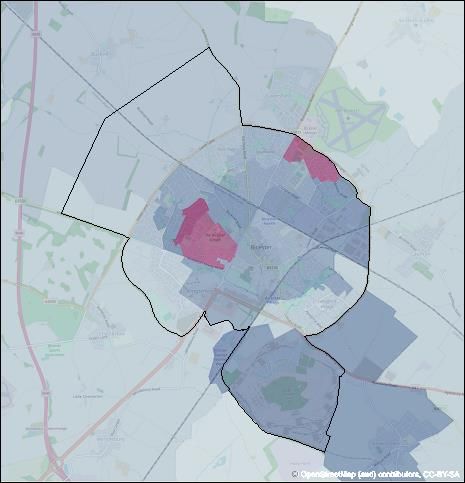
Figure 4 Bicester showing decile of overall index, decile of Education Skills and Training
domain, decile of Income deprivation affecting children, and decile of Income deprivation
affecting older people (2019 – with parish boundary in black)
Overall IMD decile Education, Skills, and Training decile
Legend
1
2
3
4
5
6
7
8
9
10
Income deprivation affecting older people decile Income deprivation affecting children decile
Legend
1
2
3
4
5
6
7
8
9
10
Source: MHCLG IMD 2019
Page 13 December 2020Bicester Health and Wellbeing Profile 2020 Oxfordshire JSNA 2020 4.2 Child Poverty According to joint DWP and HMRC estimates for 2018/19, Bicester has less than a quarter of children living in poverty (before housing costs). The Bicester ward with the highest incidence of this measure of child poverty is Bicester West (14%). Figure 5 Child poverty estimates (relative low income*) in Cherwell wards (2018/19 estimates) Source: Children in low income families: local area statistics (DWP&HMRC, 2020) * Relative low income is defined as a family with an income less than 60% of the median income in 2018 to 2019. Page 14 December 2020
Bicester Health and Wellbeing Profile 2020 Oxfordshire JSNA 2020

5 Health and wellbeing

5.1    Health profiles for Bicester
Public Health England publishes a range of health indicators to a local level at
www.localhealth.org.uk
The following table lists, for each of Bicester’s wards, which health indicators are (statistically)
significantly worse than the England average.

Table 2 Health indicators from Public Health profiles for Bicester where indicator significantly
worse than England average
               Health indicators where ward is significantly worse than England average
 Bicester      •   % older people living alone (Census 2011)
 East          •   Emergency hospital admissions for all causes
               •   Incidence of all cancer
               •   Incidence of breast cancer
               •   Incidence of lung cancer
               •   Deaths from all cancer
 Bicester      •   Deaths from all causes
 North and     •   Deaths from respiratory diseases
 Caversfield
 Bicester      •   Emergency hospital admissions for hip fracture in 65+
 South and
 Ambrosden
 Bicester      •   Emergency hospital admissions for all causes
 West
Source: Public Health England Local Health (downloaded December 2020)

  Page 15 December 2020
Bicester Health and Wellbeing Profile 2020 Oxfordshire JSNA 2020 Figure 6 Health Profile for Bicester East ward Page 16 December 2020
Bicester Health and Wellbeing Profile 2020 Oxfordshire JSNA 2020

Figure 7 Health Profile for Bicester North and Caversfield ward

  Page 17 December 2020
Bicester Health and Wellbeing Profile 2020 Oxfordshire JSNA 2020

Figure 8 Health Profile for Bicester South and Ambrosden ward

  Page 18 December 2020
Bicester Health and Wellbeing Profile 2020 Oxfordshire JSNA 2020

Figure 9 Health Profile for Bicester West ward

  Page 19 December 2020
Bicester Health and Wellbeing Profile 2020 Oxfordshire JSNA 2020

5.2     Provision of care
Care home beds
As of 1 October 2020 there were 2 care homes with 179 care home beds in Bicester1.
People providing unpaid care
At the time of the Census 2011 survey, there was 841 residents of Bicester providing a
significant number of hours per week (20 or more) of unpaid care.
Overall the proportion of people providing 20 or more hours per week of unpaid care in
Bicester in 2011 was below the district and national averages.
The proportion of residents providing care in Bicester in the upper age group (65 and over),
however, was above average (7.4% in Bicester compared with 6.2% across Cherwell and 7%
in England).

Figure 10 People providing 20 hours or more per week of unpaid care by age as % of resident
population (2011)

Source: ONS Census 2011 table LC3304

1Source: Care Quality Commission, care directory with filers from http://www.cqc.org.uk/about-
us/transparency/using-cqc-data

    Page 20 December 2020
Bicester Health and Wellbeing Profile 2020 Oxfordshire JSNA 2020
5.3 Health conditions
Diabetes
The prevalences of diabetes mellitus recorded by the Alchester Medical Group, Bicester
Health Centre, and Montgomery House Surgery were all below the national prevalence, closer
to the overall Oxfordshire CCG prevalence.
Figure 11 Change in prevalence (ages 17+) of Diabetes mellitus recorded by GP Practices in
Bicester (Quality Outcomes Framework) 2018-19 to 2019-20
2018-19 2018-19 2019-20 2019-20
Count Rate Count Rate change
England 3,265,562 6.94 3,455,176 7.08 +0.14pp
Oxfordshire CCG 30,868 5.05 31,982 5.05Bicester Health and Wellbeing Profile 2020 Oxfordshire JSNA 2020
The prevalence of depression recorded by each of the three GP practices in Bicester
remained above the Oxfordshire CCG and England averages. The greatest increase between
2018-19 and 2019-20 was at Montgomery House Surgery.
Figure 13 Change in prevalence of Depression recorded by GP Practices in Bicester (Quality
Outcomes Framework) 2018-19 to 2019-20
2018-19 2018-19 2019-20 2019-20
Count Rate Count Rate change
England 4,999,672 10.77 5,565,443 11.56 +0.79pp
Oxfordshire CCG 66,656 11.06 73,648 11.81 +0.74pp
Alchester Medical Group 2,353 15.58 2,595 16.85 +1.28pp
Bicester Health Centre 1,515 13.27 1,700 14.06 +0.79pp
Montgomery House Surgery 1,602 12.90 1,760 14.23 +1.33pp
Source: NHS Digital, Quality Outcomes Framework, 2019-20
2019-20 rates with a red asterisk indicate a significantly higher rate for a GP practice compared to the national
rate. Green asterisks indicate a significantly lower rate. Tested at a 99.8% confidence level.
Page 22 December 2020Bicester Health and Wellbeing Profile 2020 Oxfordshire JSNA 2020 5.4 Physical activity and healthy weight 5.4.1 Physical Activity According to Sport England’s small area estimates, the proportion of people aged 16+ in Bicester MSOAs who were physically active at least 150 minutes a week was higher in South and North Bicester (in line with the county proportion) than in East and West Bicester (lower than the county proportion). Figure 14 Estimated proportion of adults aged 16+ who are physically active at least 150 minutes a week (year ending November 2019), Cherwell MSOAs Source: Sport England Active Lives survey, year ending November 2019; MSOA = Middle Layer Super Output Area (cover an average of 7,600 residents); map showing MSOAs in Oxfordshire Note: for Oxfordshire’s local authorities, including Oxford, the Active Lives survey is completed by a minimum of 500 respondents, which is 20-30 people per MSOA. This is too few to derive precise direct estimates. Page 23 December 2020
Bicester Health and Wellbeing Profile 2020 Oxfordshire JSNA 2020

5.4.2 Child obesity
The latest data on child obesity from the National Child Measurement Programme (NCMP, 3
years combined 2017/18 to 2019/20) shows that for both reception children (aged 4-5 years),
and year 6 children (aged 10-11 years), the proportion who are obese in Bicester is generally
similar to that for the district and county overall. One exception is that the Bicester West MSOA
has a significantly higher proportion of obese reception children when compared against the
county proportion.

Figure 15 Prevalence (%) of obesity among children 2017/18 to 2019/20 in Cherwell MSOAs
(showing 95% confidence intervals)

               Reception (aged 4-5 years)                                 Year 6 (aged 10-11 years)

Source: National Child Measurement Programme
*Note: 2019/20 data has less weight in the three year averages for MSOAs accompanied by asterisks, due to less
data being collected after Covid-19 related school closures in March 2020.

  Page 24 December 2020
Bicester Health and Wellbeing Profile 2020 Oxfordshire JSNA 2020 The 3 year average rate of year 6 child obesity in Bicester West MSOA appears to have increased slightly between 2008/09 and 2019/20, however it is unclear whether this increase is statistically significant. Figure 16: Bicester West MSOA Year 6 child obesity trend Source: National Child Measurement Programme The 3 year average rate of year 6 child obesity in Bicester North MSOA has remained stable between 2008/09 and 2019/20, keeping similar to the county and national rates. Figure 17: Bicester North MSOA Year 6 child obesity trend Source: National Child Measurement Programme Page 25 December 2020
Bicester Health and Wellbeing Profile 2020 Oxfordshire JSNA 2020

The 3 year average rate of year 6 child obesity in Bicester East MSOA appears to have
decreased slightly between 2008/09 and 2019/20, however it is unclear whether this decrease
is statistically significant.

Figure 18: Bicester East MSOA Year 6 child obesity trend

Source: National Child Measurement Programme

The 3 year average rate of year 6 child obesity in Bicester North MSOA appears to have
increased slightly between 2008/09 and 2019/19, however it is unclear whether this decrease
is statistically significant.
Figure 19: Bicester North MSOA Year 6 child obesity trend

Source: National Child Measurement Programme

  Page 26 December 2020
Bicester Health and Wellbeing Profile 2020 Oxfordshire JSNA 2020

6 Other - house prices and commuting data
Median house prices are very dependent on the mix of housing sold (detached, semi-
detached, terraced, flats). Looking at individual housing types gives a more comparable trend.
Over the past 5 years (year ending June 2015 to year ending June 2020), median prices for
semi-detached housing in Bicester have generally increased in line with the Cherwell district
rate. The Bicester West ward typically has the lowest house prices, the Bicester South and
Ambrosden ward the highest.

Figure 20 Median price paid for semi-detached dwellings – Bicester wards

Source: ONS House price statistics for small areas to year ending June 2020; quarterly rolling year dataset 37

Table 5 Median price paid for semi-detached dwellings, Year ending June 2015 to year ending
June 2020 – Bicester wards
                                   Year ending Jun 2015     Year ending Jun 2020             difference
 Bicester East                            250,000                 270,000              20,000             +8%
 Bicester North and Caversfield           260,000                 298,750              38,750          +15%
 Bicester West                            250,000                 271,000              21,000             +8%
 Bicester South and Ambrosden             265,000                 315,000              50,000          +19%
 England                                  181,000                 220,000              39,000          +22%
Source: ONS House price statistics for small areas to year ending June 2020; quarterly rolling year dataset 37

  Page 27 December 2020
Bicester Health and Wellbeing Profile 2020 Oxfordshire JSNA 2020
Travelling to work
According to the 2011 Census travel to work statistics2, there was a total of 17,543 people
living in Bicester in employment the week before the Census.
Of these, 45% (7,843) were living and working in Bicester and 55% worked outside the town.
• People living and working in Bicester includes people working mainly at or from home in
Bicester (1,458) and employed Bicester residents with no fixed place of work (1,135).
Looking just at commuting patterns (i.e. excluding people working from home and with no fixed
place of work) shows that 81% of Bicester commuters travelled to work within
Oxfordshire. The local authority areas outside Oxfordshire with the highest number of out-
commuters from Bicester were Aylesbury Vale (5%) and London (3%).
Outside Bicester, the greatest numbers of commuters to Bicester were mainly living in
Bicester’s surrounding rural hinterland:
• Ardley / Finmere / Ambrosden (757)
• Banbury (505)
• Middleton Stoney / Horton Cum Studley / Shipton on Cherwell (322)
• The rural area between Bicester and Buckingham (283)
• Kidlington (279)
• Barford St Michael, Lower Heyford, Fritwell (263)
• Bloxham, Adderbury, Bodicote (118)
• The rural area between Bicester and Aylesbury (107)
Of the Bicester residents aged 16 and over in employment the week before the Census, a
relatively high proportion travelled to work by car (62% compared with 54% nationally) and a
relatively low proportion commuted by public transport.
2 ONS Census 2011 table WU03EW from www.nomisweb.co.uk
Page 28 December 2020Bicester Health and Wellbeing Profile 2020 Oxfordshire JSNA 2020
ANNEX 1: Data sources for indicators used in ward health profiles
Table 6 Indicators used in ward profiles from Public Health England Local Health (section 5.1)
Child Development at age 5 (%) DfE 2014
GCSE Achievement (5A*-C inc. Eng & Maths) (%) DfE 2013/14
Unemployment (%) ONS from nomis
(last updated 2019)
Long Term Unemployment (Rate/1,000 working age population)
Older people living alone (%) ONS Census 2011
Children with excess weight, Reception Year (%) NCMP
Obese Children, Reception Year (%) (last updated 2020)
Children with excess weight, Year 6 (%)
Obese Children, Year 6 (%)
Emergency hospital admissions for all causes (SAR) Hospital Episode
Statistics, NHS
Emergency hospital admissions for CHD (SAR)
Digital
Emergency hospital admissions for stroke (SAR) (last updated 2019)
Emergency hospital admissions for Myocardial Infarction (heart attack) (SAR)
Emergency hospital admissions for Chronic Obstructive Pulmonary Disease (COPD)
(SAR)
Incidence of all cancer (SIR / per 100) National Cancer
Registration and
Incidence of breast cancer (SIR / per 100)
Analysis Services'
Incidence of colorectal cancer (SIR / per 100) Cancer Analysis
System (last
Incidence of lung cancer (SIR / per 100)
updated 2019)
Incidence of prostate cancer (SIR / per 100)
Hospital stays for self harm (SAR) Hospital Episode
Statistics, NHS
Hospital stays for alcohol related harm (Narrow definition) (SAR)
Digital
Hospital stays for alcohol related harm (Broad definition) (SAR) (last updated 2019)
Emergency hospital admissions for hip fracture in 65+ (SAR)
Limiting long-term illness or disability (%) ONS Census 2011
Back pain prevalence in people of all ages (%) Musculoskeletal
(MSK) Calculator by
Imperial College
London for Arthritis
Severe back pain prevalence in people of all ages (%) Research UK based
on data from the
Health Survey for
England (HSE)
Page 29 December 2020Bicester Health and Wellbeing Profile 2020 Oxfordshire JSNA 2020
(last updated 2019)
Life expectancy at birth for males, 2013-2017 (years) Public Health
England from ONS
Life expectancy at birth for females, 2013-2017 (years)
2013-2017
Deaths from all causes, all ages (SMR) (last updated 2019)
Deaths from all causes, under 75 years (SMR)
Deaths from all cancer, all ages (SMR)
Deaths from all cancer, under 75 years (SMR)
Deaths from circulatory disease, all ages (SMR)
Deaths from circulatory disease, under 75 years (SMR)
Deaths from coronary heart disease, all ages (SMR)
Deaths from stroke, all ages, all persons (SMR)
Deaths from respiratory diseases, all ages, all persons (SMR)
Deaths from causes considered preventable (SMR)
Source: Indicator dates available from the ‘Definitions’ section of the Local Health tool on the NHS fingertips
website.
Page 30 December 2020Bicester Health and Wellbeing Profile 2020 Oxfordshire JSNA 2020
ANNEX 2: Data sources used in this report
Data sources used in this report
Data Source
Administrative https://geoportal.statistics.gov.uk/
boundaries
Locations of GP Oxfordshire County Council
practices
ONS mid-year https://www.nomisweb.co.uk/
population estimates
(‘Small area by single year of age’ query)
2011 Census: https://www.nomisweb.co.uk/
ethnicity
(Census 2011 ‘KS201EW’ query)
2011 Census: https://www.nomisweb.co.uk/
country of birth
(Census 2011 ‘QS203EW’ query)
2011 Census: https://www.nomisweb.co.uk/
people living in
(Census 2011 ‘QS421UK’ query)
communal
establishments
2019 Indices of https://www.gov.uk/government/statistics/english-indices-of-deprivation-2019
Multiple Deprivation -
(File 1: index of multiple deprivation)
scores
2019 Indices of https://data-communities.opendata.arcgis.com/
Multiple Deprivation -
(Indices of Multiple Deprivation (IMD) 2019 dataset)
maps
2017/18 Child https://www.gov.uk/government/statistics/children-in-low-income-families-
Poverty Estimates local-area-statistics-201415-to-201819
2019 PHE Health https://www.localhealth.org.uk/
Indicators
(Indicators > Summary)
2020 numbers of https://www.cqc.org.uk/about-us/transparency/using-cqc-data
care homes and
(‘Care directory with filters)
beds
2011 Census: https://www.nomisweb.co.uk/
people providing
(Census 2011 ‘LC3304EW’ query)
unpaid care
2019/20 Prevalence https://digital.nhs.uk/data-and-information/publications/statistical/quality-and-
of diabetes outcomes-framework-achievement-prevalence-and-exceptions-data
(Prevalence, achievement and personalised care adjustments; High
dependency and other long term conditions group; GP practice level)
Page 31 December 2020Bicester Health and Wellbeing Profile 2020 Oxfordshire JSNA 2020
2019/20 Prevalence https://digital.nhs.uk/data-and-information/publications/statistical/quality-and-
of dementia and outcomes-framework-achievement-prevalence-and-exceptions-data
depression
(Prevalence, achievement and personalised care adjustments; mental health
and neurology group; GP practice level)
2018/19 Sport https://www.sportengland.org/know-your-audience/data/active-lives/active-
England physical lives-data-tables
activity estimates
(Small Area Estimates – Activity Levels Estimates for Middle Super Output
Areas)
https://activelives.sportengland.org/Query/EditQuery?queryId=737
(Build query to get national, county, and district figures)
Child Obesity MSOA PHE Fingertips tool > NCMP and Child Obesity Profile > NCMP small area
area comparisons data
Child obesity trends PHE Fingertips tool > NCMP and Child Obesity Profile > NCMP small area
over time data
House price https://www.ons.gov.uk/peoplepopulationandcommunity/housing/
statistics
bulletins/housepricestatisticsforsmallareas/yearendingdecember2019
(Median house prices by ward: HPSSA dataset 37)
(Median house prices by administrative geography: HPSSA dataset 9)
2011 Census: https://www.nomisweb.co.uk/
Travelling to work (Census 2011 ‘QS701EW’ query)
For data and statistics on Oxfordshire and place profiles please visit Oxfordshire Insight
Page 32 December 2020You can also read