FULL-YEAR RESULTS 2019 - BUILDING TRAINS WITH PASSION AND SWISS PRECISION - Stadler Rail
←
→
Page content transcription
If your browser does not render page correctly, please read the page content below

FULL-YEAR RESULTS 2019
BUILDING TRAINS WITH PASSION AND
SWISS PRECISION
Dr. Thomas Ahlburg, Group CEO, and Raphael Widmer, Group CFO
5 March 2020
AGENDA

   1        Highlights                                      Dr. Thomas Ahlburg, Group CEO

   2        Financial results                                  Raphael Widmer, Group CFO

   3        Outlook                                         Dr. Thomas Ahlburg, Group CEO

Stadler full-year results 2019 | © Stadler | 5 March 2020                                   2
HIGHLIGHTS
Dr. Thomas Ahlburg, Group CEO
A SUCCESSFUL YEAR FOR STADLER
Order intake Fleets delivered Regional expansion
− First US METRO contract for Seven new fleets and 444 vehicles Indonesia joint venture
Stadler, 127 METRO trains for delivered (~+80% vs 2018) 34 locomotives for Taiwan
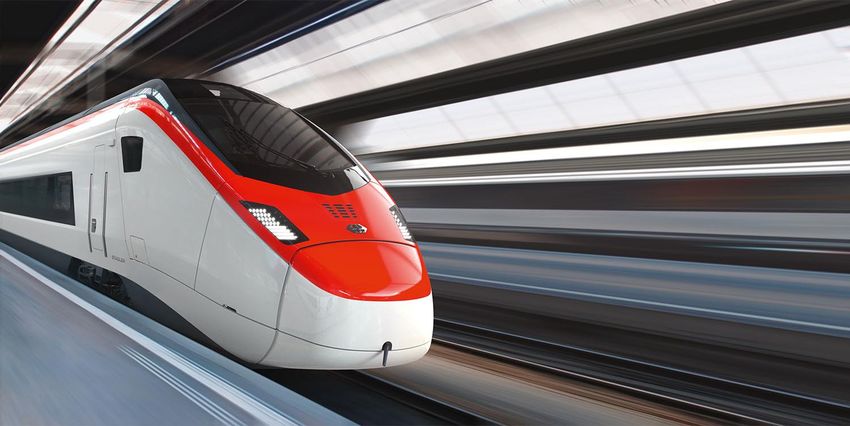
MARTA (Atlanta) Giruno high-speed train (SMILE) Opening of new plant in Salt Lake
− 163 locomotives sold at a recorded enters regular passenger service City, US
order intake of c. CHF 800m for SBB in Switzerland
New technologies Service Signalling
55 FLIRT Akku for Schleswig- 15 year service contract for DART, Generic homologation of GUARDIA
Holstein, Germany US ETCS system
First hydrogen-powered train to run 35 year service contract for 52 new First CBTC contract awarded
in the US for SBCTA (California) METRO-trains for Merseytravel in Successful test of ATO train in NL
Liverpool, UK and CH
Stadler full-year results 2019 | © Stadler | 5 March 2020 4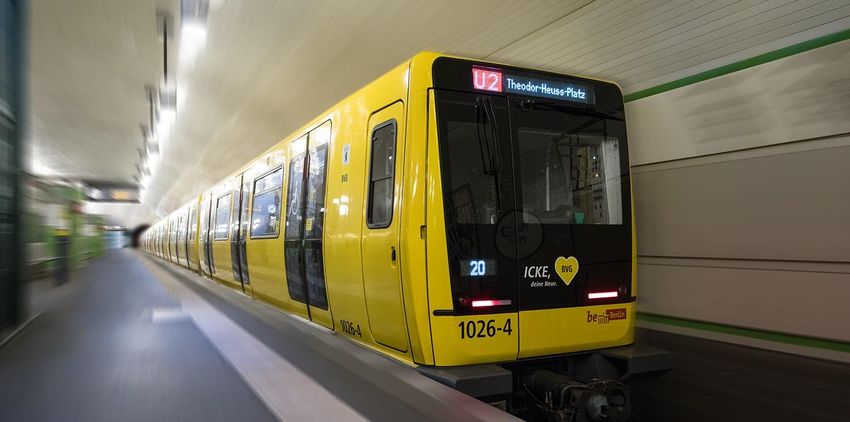
FULL-YEAR 2019 KEY FIGURES

      Order intake                                     Order backlog                                   Vehicles delivered
      CHF 5.1bn                                        CHF 15.0bn                                      444
      +17%(1)                                          +14%(1)                                         +80%(1)

      Net revenues                                     EBIT margin
      CHF 3.2bn                                        6.1%
      +60%(1)                                          -149bps(1)

      Free Cash Flow(2)                                Net profit
      CHF -328.9m                                      CHF 128.5m
      + CHF 37.8m(1)                                   +8%(1)

(1)   Change year-on-year.
(2)   Defined as EBITDA –Capex –Change in NWC. EBITDA is calculated as the sum of EBIT and depreciation and amortization
Stadler full-year results 2019 | © Stadler | 5 March 2020                                                                   5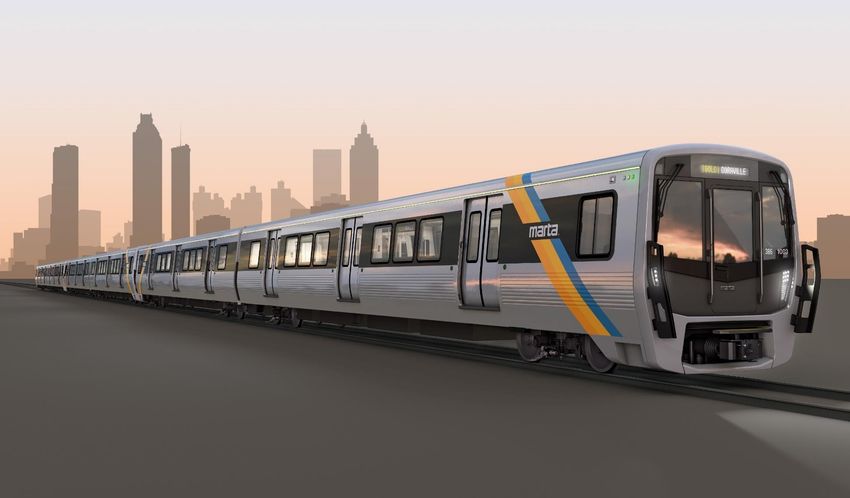
OPERATIONAL HIGHLIGHTS & CHALLENGES
Highlights
444 or ~ 80% more vehicles delivered in 2019 compared to
2018, seven new fleets entered service in 2019
23% increase year-on year in average FTEs to ~11’000
Operating licence for new high-speed vehicle concept (SMILE)
Opening of new plants in Salt Lake City (US), St. Margrethen
(CH), Herne (Service, DE); capacity expansions in Środa (PL)
and Minsk (BY)
Challenges
Substantial ramp-up of production and workforce has lead to
certain inefficiencies, which mainly materialised in the fourth
quarter
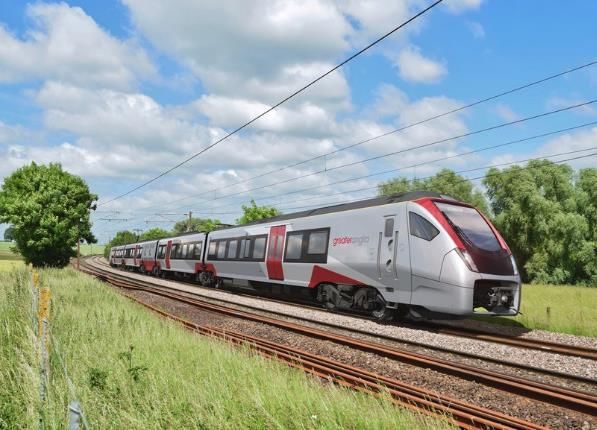
Higher costs in certain projects (primarily Greater Anglia)
Challenges are of temporary nature and under control
Stadler full-year results 2019 | © Stadler | 5 March 2020 6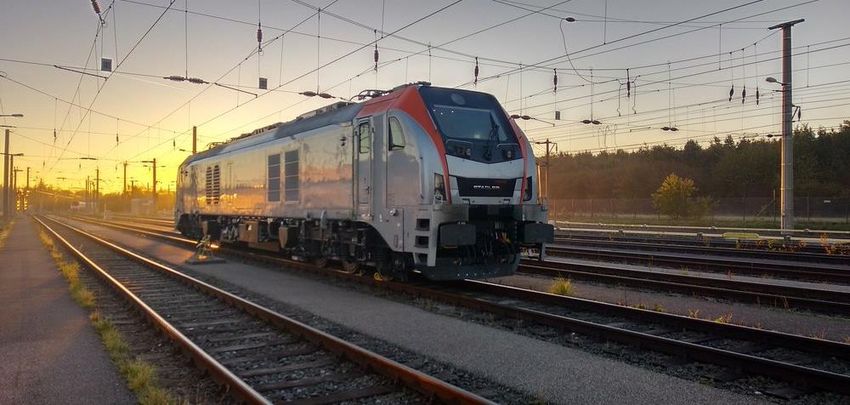
FINANCIAL RESULTS FULL-YEAR 2019
Raphael Widmer, Group CFO
FULL-YEAR RESULTS 2019 SUMMARY
CHFm

      Order intake                                                                  Net revenues                                                                     Order backlog

                                +17%                                                                            +60%                                                                              +14%
                                                    5’117                                                                           3’201                                                                           15’026
             4’389                                                                                                                                                            13’179
                                                                                             2’001

              2018                                  2019                                      2018                                  2019                                       2018                                   2019

      EBIT                                                                          Net working capital(1)                                                           Capital expenditure(2)

                              +28%
                                            194                                                                                        27                                                         +32%
                      7.5%
             151                        6.1%                                                                                                                                                                           249
                                                                                                                                                                                 188

                                                                                              -323
             2018                                2019                                         2018                                  2019                                       2018                                   2019
                EBIT as % of net revenues                                                      Change year-on-year
(1)    Net working capital is calculated by subtracting the sum of trade payables, liabilities from work in progress and other current liabilities (including other current liabilities, current provisions and deferred income and accrued
       expenses) from the sum of trade receivables, inventories, work in progress and other current assets (including other current receivables, compensation claims from work in progress and accrued income and deferred expenses).
(2)    Capital expenditure is calculated as the sum of investments in tangible and intangible assets.
Stadler full-year results 2019 | © Stadler | 5 March 2020                                                                                                                                                                                     8
ORDER INTAKE
CHFm
+17%
5’117
8%
4’389 833 Service & Components 2%
Others(1)
1% 17%
621 Americas
18%
Eastern Europe
17%
Western Europe 45% 16%
4’284 Rolling Stock
3’767
42%
DACH 34%
2018 2019 2018 2019
Comments
Strong order intake ahead of expectations in both reporting segments
Relatively stable order intake development in Europe with a higher weight towards the DACH
region
Significant growth in order intake from the Americas region driven by the order for 127 METRO
trains for MARTA in the US valued at over USD 600m
(1) Others: CIS and rest of the world.
Stadler full-year results 2019 | © Stadler | 5 March 2020 9
NET REVENUES
CHFm
+60%
3’201
261 Service & Components 5%
5%
1%
2’001 Others(1) 43%
3%
248 Americas 6%
6%
Eastern Europe
2’940 Rolling Stock 19%
Western Europe
1’752
DACH 65% 46%
2018 2019 2018 2019
Comments
Significant net revenue growth of c. 60% to CHF 3.2bn
Net revenues below expectations due to postponements in projects (primarily Greater Anglia)
and exchange rate movements
Substantial growth recorded in Western Europe mainly relates to deliveries in the United
Kingdom and Scandinavia
(1) Others: CIS and rest of the world.
Stadler full-year results 2019 | © Stadler | 5 March 2020 10ORDER BACKLOG I/II
CHFm
+14%
15’026
4%
13’179 2’772 Service & Components Others(1) 11%
2%
2’262 Americas 7%
13%
8%
Eastern Europe
Western Europe 41% 32%
12’254 Rolling Stock
10’917
DACH 41% 40%
2018 2019 2018 2019
Strong order intake drives record order backlog of CHF 15bn providing high revenue
visibility
(1) Others: CIS and rest of the world.
Stadler full-year results 2019 | © Stadler | 5 March 2020 11ORDER BACKLOG II/II
Order backlog by market segment: 2018 Order backlog by market segment: 2019
17% 18%
Executing on
9% strategic focus
11% 50%
5%
62%
7%
5%
Trains
2%
Locomotives 8%
Metro 6%
LRV
Tailor-made
Service & Components
High quality and increasingly diversified order backlog with a growing share of strategic
rolling stock market segments as well as service
(1) Others: CIS and rest of the world.
Stadler full-year results 2019 | © Stadler | 5 March 2020 12REPORTING SEGMENTS
Rolling Stock
CHFm 2018 2019 Change
Order intake 3’767 4’284 14%
Net revenues (third party) 1’752 2’940 68%
Order backlog 10’917 12’254 12%
Investments in fixed assets 144 186 29%
Total staff as FTEs(1) 6’884 8’408 22%
Service & Components
CHFm 2018 2019 Change
Order intake 621 833 34%
Net revenues (third party) 248 261 5%
Order backlog 2’262 2’772 23%
Investments in fixed assets 27 25 -7%
Total staff as FTEs(1) 1’829 2’326 27%
Ready to execute on the record order backlog with increased capacities and resources
(1) Average FTEs 1 January to 31 December.
Stadler full-year results 2019 | © Stadler | 5 March 2020 13EBIT
CHFm in % of net revenues
+28%
194 7,5%
200 10%
9%
6,1%
151 8%
150
7.5% 7%
6%
100 6.1% 5%
4%
3%
50
2%
1%
0 0%
2018 2019 2018 Operational Growth FX 2019
EBIT EBIT in % of net revenues inefficiencies investments
Change year-on-year
Comments
− Strong EBIT growth of c. 28% to CHF 194m
EBIT margin below expectations due to operational inefficiencies, incremental growth
investments and FX effects
Operational impact related to individual orders (primarily Greater Anglia)
Note: Sizes of EBIT bridge elements are illustrative only.
Stadler full-year results 2019 | © Stadler | 5 March 2020 14NET INCOME
CHFm 2018 2019 Change
Earnings before interest and taxes (EBIT) 150.9 193.7 28%
Financial result (21.4) (47.1)
Share of results from associates 2.3 4.0
Ordinary result 131.9 150.6 14%
Non-operating result - (2.1)
Profit before income taxes 131.9 148.5 13%
Income taxes (12.7) (20.0)
Profit for the period 119.2 128.5 8%
thereof attributable to
- Shareholders of Stadler Rail AG 117.8 127.2
- Non-controlling interests 1.4 1.4
Comments
− Financial result mainly impacted by higher order-related bank guarantee costs and foreign
exchange losses
− Effective tax rate 2019 in-line with expectations
Stadler full-year results 2019 | © Stadler | 5 March 2020 15NET WORKING CAPITAL
Net working capital(1) (CHFm)
27 (29)
(47) 46 (76)
286 Trade receivables
(117)
27
252 818 Comp. claims from WIP
538
280
Inventories
261 232
Other current assets
86 132
34
-757 -323
-804 Work in progress (net)
NWC 2018
NWC 2019
Inventories
Trade receivables
Work in progress (net)
Other current liabilities
Trade payables
Comp. claims from WIP
Other current assets
-174
-250 Trade payables
-269
-323 -386 Other current liabilities
2018 2019
Increase in NWC driven by the change in compensation claims from work in progress
(1) Net working capital is calculated by subtracting the sum of trade payables, liabilities from work in progress and other current liabilities (including other current liabilities, current provisions and deferred income and accrued
expenses) from the sum of trade receivables, inventories, work in progress and other current assets (including other current receivables, compensation claims from work in progress and accrued income and deferred expenses).
Stadler full-year results 2019 | © Stadler | 5 March 2020 16CAPITAL EXPENDITURE
CHFm
249
35
188
14
213
76 174
55 11
8
65
48
2016 2017 2018 2019
Investments in intangible assets Investments in tangible assets
Comments
High level of investments to support Stadler’s growth
St. Margrethen (Switzerland), Herne (Germany), Salt Lake City (USA), Środa (Poland) and
Minsk (Belarus)
Investments in intangible assets mainly relate to development of new high-speed SMILE vehicle
concept, new products in locomotives and signalling
Stadler full-year results 2019 | © Stadler | 5 March 2020 17NET CASH
CHFm
6
532
695 753 Cash and cash equivalents
-82
-81
-468 Non-current financial liabilities
-279 Current financial liabilities
2018 2019
Comments
Negative operating cash flow (primarily Greater Anglia)
High level of growth investments
Non-current financial liabilities (mainly CHF 300m bond)
Current financial liabilities (mainly project financing, e.g. SBB SMILE order)
Stadler full-year results 2019 | © Stadler | 5 March 2020 18BALANCE SHEET
CHFm
3’800 3’800
Trade payables 250
Cash 753 Current financial liabilities 279
Trade receivables 286
Strong balance sheet
Liabilities from WIP 1’438
Comp. claims from WIP 818 • Strong liquidity position
• Successful issuance of CHF
Inventories 232
300m bond at a coupon of
Other current liabilities 386
0.375% to support future
growth
Assets from WIP 634
LT financial liabilities 468 • Self-funding nature of
Other current assets 132 projects with negative net
Other LT liabilities 131
work in progress
PPE 702 • No goodwill capitalised
Equity 847
Intangible assets 105
Other LT assets 139
Assets Liabilities
Net cash position: 6
Total net work in progress: (804)
Stadler full-year results 2019 | © Stadler | 5 March 2020 19SUMMARY AND OUTLOOK Dr. Thomas Ahlburg, Group CEO
ONGOING GROWTH MOMENTUM IN THE RAIL SECTOR

                                    Growing demand supported by global megatrends

                                    Tender pipeline remaining strong

                                    Resilience to typical industrial business cycles

Stadler full-year results 2019 | © Stadler | 5 March 2020                              21
EXECUTING ON OUR 2023 STRATEGY
Stadler sales today Stadler strategy 2023
Signalling
Service &
Components
Service &
Components
Rolling Rolling
Stock Stock
Strategic focus
Service &
Rolling Stock Signalling
Components
• Market segments • Growing • Establish own
Europe unchanged accessible market signalling
and installed base solutions
• Deliver on
backlog and • New service • AngelStar JV with
North America
Regions
establish next solutions Mermec
sales level
• Capture • Potential
• Growth through opportunities opportunistic
CIS
new product from signalling acquisitions
pipeline
• Potential selective
New markets acquisitions
Note: Sizes of pie charts are illustrative only.
Stadler full-year results 2019 | © Stadler | 5 March 2020 22PRIORITIES FOR 2020
Rolling Stock Service & Components Signalling
Priorities 2020
• Capitalise on pipeline of • Ensure highest reliability • Achieve full homologation
successful new products and availability of GUARDIA ETCS
• Focus on project • Ramp-up of new service system in a number of
execution: locations European countries
– Bring new hires up the • Convert strong order • Execute existing CBTC
learning curve intake momentum into order and further leverage
revenue growth in-house platform
– Drive efficiency gains
along the value chain • Execute existing ATO
orders in NL and CH
Stadler full-year results 2019 | © Stadler | 5 March 2020 23FY 2020 FINANCIAL GUIDANCE
Net revenues Around CHF 3.5bn at constant currencies
Comparable to 2019
EBIT-margin
At least 6%
Dividend Payout ratio of c. 60% of net income
Our 2020 outlook is, among other factors, subject to possible implications related to
the potential impact of the COVID-19 outbreak. To date we see only limited
indications for negative effects on the stability of our supply chain. However, we are
still at an early stage of assessing the situation.
Stadler full-year results 2019 | © Stadler | 5 March 2020 24KEY TAKEAWAYS
REFLECTION AND OUTLOOK
444 vehicles delivered (c. +80% vs 2018)
Successful homologation and service entry of seven new fleets
2019 Record levels of order intake, net revenues and order backlog
Certain growth related challenges combined with additional costs
and delays in certain projects (primarily Greater Anglia)
Rail market momentum and tender pipeline remaining very strong
2020
Growth related challenges remain key management focus in 2020
High-quality backlog provides strong visibility
Mid-term Payout ratio of c. 60% of net income
Mid-term financial targets confirmed
Stadler full-year results 2019 | © Stadler | 5 March 2020 25Q&A Stadler full-year results 2019 | © Stadler | 5 March 2020 26
APPENDIX
INFORMATION

Share information                                                            Investor contact

Listing:                                  SIX Swiss Exchange                 Raphael Widmer
Currency:                                 CHF                                Group CFO
Ticker symbol:                            SRAIL                              Phone:   +41 71 626 86 80
ISIN:                                     CH0002178181                       E-mail:  ir@stadlerrail.com
Listing date:                             12 April 2019
                                                                             Daniel Strickler
                                                                             Investor Relations Officer
                                                                             Phone:     +41 71 626 86 47
                                                                             E-mail:    ir@stadlerrail.com

Financial calendar                                                           Media contact

30 April 2020:                       Annual General Meeting                  Marina Winder
25 August 2020:                      Publication of half-year results 2020   Head of Communications & PR
                                                                             Phone:    +41 71 626 31 57
                                                                             E-mail:   marina.winder@stadlerrail.com

Stadler full-year results 2019 | © Stadler | 5 March 2020                                                       28
COMPREHENSIVE PORTFOLIO OF VEHICLE FAMILIES
Market segments and vehicle families Order backlog contributions 2019
Market Reporting segment
Type Vehicle families
segment
Very High 18%
Not a strategic focus
Speed Rolling Stock
Service & Components
High Speed
82%
Trains Intercity Market segment
Regional / Trains
Suburban 18%
Locomotives
Services & Systems
11% Metro
50%
Coaches LRV
7%
Tailor-made
8% Tailor-made
6% Service & Components
Main-line
locomotives
Loco-
motives Regional markets
Shunting
locomotives 2% DACH
3% 11% Western Europe
Metro Metro 13% 40% Eastern Europe
CIS
Americas
Tram / 32%
LRV Rest of the world
Tram Train
Stadler full-year results 2019 | © Stadler | 5 March 2020 29SEGMENT BREAKDOWN
2018 2019
Rolling Service & Corporate Rolling Service & Corporate
CHFm Total Total
Stock Components Center Stock Components Center
Order intake 3’767 621 - 4’389 4’284 833 - 5’117
Total revenue 1’789 536 (325) 2’001 3’002 642 (442) 3’201
Inter-segment revenue (37) (289) 326 - (62) (381) 443 -
Net revenue 1’752 248 1 2’001 2’940 261 0 3’201
Investments in PPE 144 27 3 174 186 25 2 213
Total FTE 6’884 1’829 161 8’874 8’408 2’326 184 10’918
Stadler full-year results 2019 | © Stadler | 5 March 2020 30WORK IN PROGRESS
CHFm
593 634
2018
2019
(757) (804)
41 (88)
(1’350) (757)
(1’438) (804)
Assets from WIP Liabilities Total WIP (net) WIP (net) 31 ▲Assets ▲Liabilities WIP (net)
from WIP Dec 2018 from WIP from WIP H1 2019
Continuously negative net work in progress (WIP)
Stadler full-year results 2019 | © Stadler | 5 March 2020 31DISCLAIMER
IMPORTANT NOTICE
This presentation (the "Presentation") has been prepared by Stadler Rail AG ("Stadler" and, together with its subsidiaries, "we", "us" or the "Group") and includes forward-looking
information and statements concerning the outlook for our business. These statements are based on current expectations, estimates and projections about the factors that may
affect our future performance, including global economic conditions, and the economic conditions of the regions and markets in which the Group operates. These expectations,
estimates and projections are generally identifiable by statements containing words such as “expects,” “believes,” “estimates,” “targets,” “plans,” “outlook” or similar expressions.
There are numerous risks and uncertainties, many of which are beyond our control, that could cause our actual results to differ materially from the forward-looking information and
statements made in this Presentation, which, in turn, could affect our ability to achieve our stated targets. The important factors that could cause such differences include:
changes in the markets the Group serves, including as a result of changes in the global demand for transportation and demographic changes; the Group's ability to successfully
develop, launch and market new products and services; the Group's ability to retain existing customers and/or secure new customers; the Group's ability to compete with existing
and new competitors; the Group's ability to maintain the high quality, reliability, performance and timely delivery of its products and services; the impact of fluctuations in foreign
exchange rates; and such other factors as may be discussed from time to time. Although we believe that our expectations reflected in any such forward-looking statement are
based upon reasonable assumptions, we can give no assurance that those expectations will be achieved.
PRESENTATION OF FINANCIAL INFORMATION
This Presentation has been prepared by Stadler solely for informational purposes. Certain financial data contained herein is based on historical financial information of Stadler
that has been prepared in accordance with the accounting standards of Swiss GAAP FER, unless otherwise stated. In addition, certain financial data included in the Presentation
consists of "non-Swiss GAAP financial measures". These non-Swiss GAAP financial measures may not be comparable to similarly titled measures presented by other companies,
nor should they be construed as an alternative to other financial measures determined in accordance with Swiss GAAP. You are cautioned not to place undue reliance on any
non-Swiss GAAP financial measures and ratios included herein.
In addition, certain financial information contained herein has not been audited, confirmed or otherwise covered by a report by independent auditors and, as such, actual data
could vary, possible significantly, from the data set forth herein.
THIS PRESENTATION IS NOT AN INVITATION TO PURCHASE SECURITIES OF STADLER OR THE GROUP.
.
Stadler full-year results 2019 | © Stadler | 5 March 2020 32You can also read