Half-year results to 31 December 2019 - February 2020 - BWP Trust
←
→
Page content transcription
If your browser does not render page correctly, please read the page content below
Half-year results to 31 December 2019
February 2020
Important notice

    The information provided in this presentation should be considered together with the financial statements for the
    period and previous periods, ASX announcements and other information available on the Trust’s website.
    This presentation has been prepared by BWP Management Limited as the responsible entity for BWP Trust. The
    information provided is for information purposes only and does not constitute an offer to arrange to issue securities or
    other financial products, nor is it intended to constitute legal, tax or accounting advice or opinion. The information
    contained in this presentation is not investment or financial product advice and is not intended to be used as the basis
    for making an investment decision. This presentation has been prepared without taking into account the investment
    objectives, financial situation or particular needs of any particular person.
    All reasonable care has been taken in preparing the information contained in this presentation, however no
    representation or warranty, express or implied, is made as to the fairness, accuracy, completeness or correctness of the
    information, opinions and conclusions contained in this presentation. Without limiting the preceding sentence, no
    representation or warranty, express or implied, is given as to the accuracy, completeness, likelihood of achievement or
    reasonableness of any forward-looking statements, forecasts, prospects or returns contained in this presentation. Such
    forward-looking statements, forecasts, prospects or returns are by their nature subject to significant uncertainties and
    contingencies, many of which will be outside the control of BWP Trust or BWP Management Limited. Also, past
    performance is no guarantee of future performance.
    Before making an investment decision, you should conduct your own due diligence and consult with your own legal,
    tax or accounting adviser as to the accuracy and application of the information provided in this presentation and in
    respect of your particular investment needs, objectives and financial circumstances.

2     HALF-YEAR RESULTS TO 31 DECEMBER 2019
Presentation outline
    Michael Wedgwood                         >Summary
    Managing Director
    BWP Management Limited                   >Results

    Andrew Ross                              >Portfolio
    Portfolio Manager
                                             >Core portfolio
    BWP Management Limited

                                             >Alternative use properties
    David Hawkins
    Finance Manager                          >Capital management
    BWP Management Limited
                                             >Outlook

3    HALF-YEAR RESULTS TO 31 DECEMBER 2019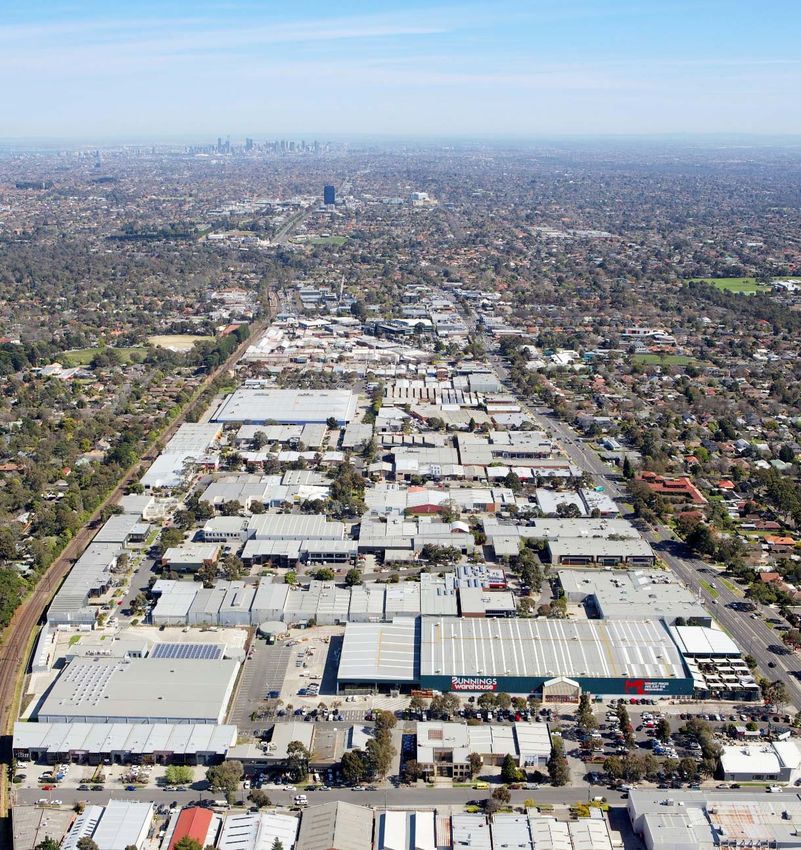
Summary

                                                      Hawthorn, VIC

4   SUMMARY | HALF-YEAR RESULTS TO 31 DECEMBER 2019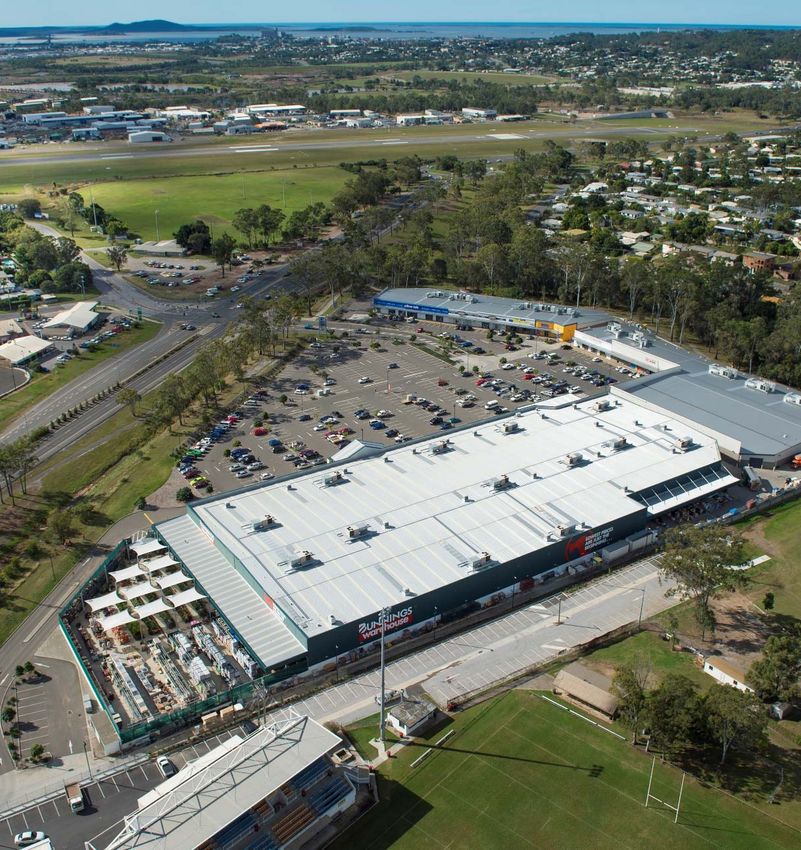
2019/20 half-year at a glance

               $76.2m                        $57.9m ⇧               9.02 cpu ⇧            $3.04 ⇧                    14.5 % pa
          Total revenue   3.5%1            Dist. amount   1.0%1    Distribution   1.0%1   NTA   5.2%1                10 yr total return

                 PORTFOLIO                                         PORTFOLIO                              CAPITAL
                PERFORMANCE                                       MANAGEMENT                            MANAGEMENT

                           2.2%                                        97.5%                             A- S&P rating/
                 like-for-like rental growth                             leased
                                                                                                        A3 Moody’s rating

                          6.08%                                   Hoxton Park                                  18.0%
                                                                                                                gearing
                      portfolio cap rate                    redevelopment completed

                        4.3 years                                                                                3.5%
                                                            Mindarie rezoning completed                 cost of debt at 31 Dec 2019
                       portfolio WALE

    1   In comparison to prior corresponding period

5   SUMMARY | HALF-YEAR RESULTS TO 31 DECEMBER 2019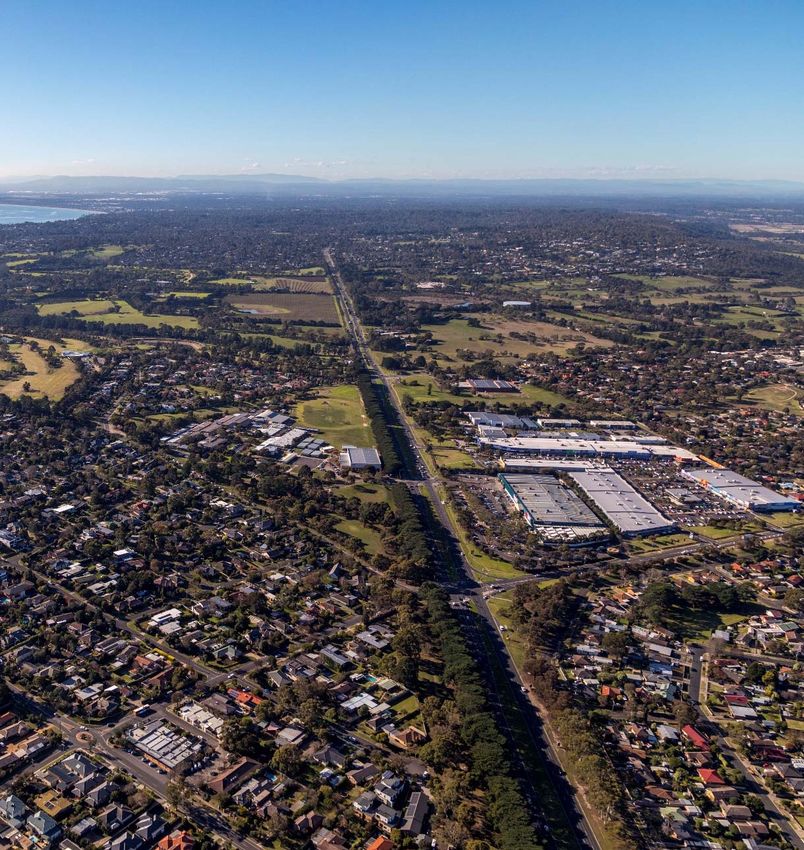
Results

                                                       Southport, QLD

6    RESULTS | HALF-YEAR RESULTS TO 31 DECEMBER 2019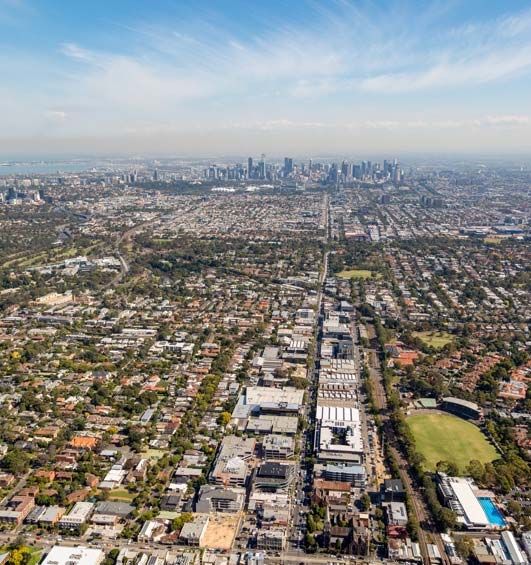
Financial performance 6 monthly
                                                                       6 months to    6 months to
                                                                           Dec 19         Dec 18
    Total revenue                                                          $76.2m         $79.0m
    Management expense ratio                                                0.63%          0.62%
    Other expenses                                                          $4.2m          $3.5m
    Distributable amount                                                    $57.9m        $57.4m1
    Property net revaluation gains                                         $78.5m         $20.1m
    Net profit including property revaluations                            $135.6m         $78.9m
    Number of units on issue2                                              642.4m         642.4m
    Six months distribution (per unit)                                   9.02 cents     8.93 cents
    Total assets2                                                        $2,487.1m      $2,375.3m
    Borrowings2                                                            $447.0m        $437.9m
    Weighted average cost of debt3 (p.a.)                                   3.53%          4.31%
    Net tangible assets2 (per unit)                                          $3.04          $2.89
    Weighted average cap rate2                                              6.08%          6.40%
    1 Excludes $1.4 million retained in reserves
    2 As at 31 December not 6 months to December
    3 Finance costs divided by average borrowings for the six months

7   RESULTS | HALF-YEAR RESULTS TO 31 DECEMBER 2019
Portfolio

                                                         Maribyrnong, VIC

8    PORTFOLIO | HALF-YEAR RESULTS TO 31 DECEMBER 2019
FY2020 Bunnings market rent review outcomes

    > 4 Bunnings market rent reviews from FY2019 were resolved during the six months to 31 December
      2019
         Property                        Passing rent           Reviewed rent                     Variance           Effective date
         location                              ($pa)                   ($pa)                          (%)
         Balcatta, WA1,2                      2,336,761                 2,220,000                        (5.0)              23-Sep-18
         Coburg, VIC1,3                       1,531,347                 1,684,481                         10.0               3-Nov-18
         Tuggeranong,
                                               1,847,740                1,800,000                        (2.6)               1-Dec-18
         ACT1,2
         Cannon Hill,
                                              2,548,846                 2,550,000                          0.1                1-Apr-19
         QLD1,2
         Total                              8,264,694                 8,254,481                          (0.1)
         1   The market rent review was due during the year ended 30 June 2019, but the outcome of the negotiation was only completed
              during the current financial year.
         2   The market rent review was determined by an independent valuer.
         3   The market rent review was agreed between the parties at the 10 per cent cap in the lease.

9    PORTFOLIO | HALF-YEAR RESULTS TO 31 DECEMBER 2019
Capitalisation rate trends
     > New Bunnings Warehouse store yields continue to tighten with the most recent
       transaction recorded at 4.5%
                                                         Bunnings transaction yields
10.00%

9.00%

8.00%

7.00%
                             Bunnings Portfolio
                             Acquisitions by BWP
6.00%

5.00%

4.00%

3.00%
     Jun‐10 Jan‐11 Jul‐11 Feb‐12 Aug‐12 Mar‐13 Oct‐13 Apr‐14 Nov‐14 May‐15 Dec‐15 Jun‐16 Jan‐17 Aug‐17 Feb‐18 Sep‐18 Mar‐19 Oct‐19 Apr‐20

                         New Bunnings Store Transactions                               BWP Portfolio Cap Rate
                         Secondary Market Bunnings Transactions                        Portfolio Transaction Average Cap Rate

10       PORTFOLIO | HALF-YEAR RESULTS TO 31 DECEMBER 2019
December 2019 revaluation
> December 2019 weighted average capitalisation rate 6.08% (June 2019: 6.30%)
– 18 independent valuations (25% of BWP portfolio value), average cap rate 6.00%
– 57 internal valuations, average cap rate 6.11%
– Stand alone Bunnings Warehouses weighted average cap rate of 5.91%
> HY19/20 gross fair value gain of $80.1m1 on revaluation
– Cap rate compression largely contributed to the net fair value gain during the period after the
portfolio average cap rate decreased 22bps
– Cap rate movement; 38 properties decreased, 32 properties no change and 5 properties increased
No. of Rental
Revaluation by state 31 Dec 2019 Cap rate Value $m
properties $m/annum2
NSW/ACT 18 32.3 6.14% 575.5
QLD 19 37.9 6.06% 621.1
SA 2 4.1 5.93% 68.9
VIC 20 46.6 5.68% 794.1
WA 16 27.0 6.83% 400.8
Total/weighted average 75 147.9 6.08% 2,460.4
1 Gross movement in valuations; statutory accounts reflect a $78.5 million revaluation gain after adjustments made for straight-lining of rent
2 Subject to rounding
11 PORTFOLIO | HALF-YEAR RESULTS TO 31 DECEMBER 2019December 2019 independent valuations
Jun-19 Dec-19 Valuation Dec-19
Jun-19 Dec-19 Cap Rate
Property State Valuation Valuation Movement Term Certain
Cap Rate Cap Rate Movement
($m) ($m) ($m) (years)
Fyshwick ACT 6.25% 24.0 6.25% 24.3 0.00% 0.3 5.0
Dubbo NSW 7.00% 22.6 6.75% 24.0 -0.25% 1.4 2.1
Minchinbury NSW 5.50% 52.7 5.50% 52.7 0.00% 0.0 7.3
Fairfield Waters QLD 6.75% 25.2 6.50% 26.5 -0.25% 1.3 1.3
Rocklea QLD 6.00% 35.1 6.00% 35.6 0.00% 0.5 5.8
Smithfield QLD 6.75% 23.6 6.50% 24.5 -0.25% 0.9 1.4
Caroline Springs VIC 6.25% 29.4 6.00% 31.2 -0.25% 1.8 1.4
Mornington VIC 6.00% 29.3 5.75% 30.3 -0.25% 1.0 2.0
Pakenham VIC 6.50% 31.4 6.25% 32.4 -0.25% 1.0 1.6
1 Subject to rounding
12 PORTFOLIO | HALF-YEAR RESULTS TO 31 DECEMBER 2019December 2019 independent valuations (continued)
Jun-19 Dec-19 Valuation Dec-19
Jun-19 Dec-19 Cap Rate
Property State Valuation Valuation Movement Term Certain
Cap Rate Cap Rate Movement
($m) ($m) ($m) (years)
Coburg VIC 6.75% 66.7 6.50% 70.0 -0.25% 3.3 2.9
Port Melbourne VIC 4.75% 45.5 3.75% 55.0 -1.00% 9.5 5.2
Vermont South VIC 6.25% 36.3 5.75% 39.6 -0.50% 3.3 0.6
Belmont WA 6.25% 25.3 6.00% 26.4 -0.25% 1.1 1.3
Cockburn WA 6.25% 28.4 6.00% 29.6 -0.25% 1.2 1.3
Ellenbrook WA 6.00% 33.1 6.00% 34.1 0.00% 1.0 5.9
Harrisdale WA 6.50% 37.5 6.50% 38.2 0.00% 0.7 2.9
Morley WA 8.66% 16.9 8.75% 16.9 0.09% 0.0 0.5
Port Kennedy WA 6.75% 24.7 6.25% 26.6 -0.50% 1.9 1.4
Total/weighted
6.27% 587.7 6.00% 617.9 -0.28% 30.2 3.0
average1
1 Subject to rounding
13 PORTFOLIO | HALF-YEAR RESULTS TO 31 DECEMBER 2019Core portfolio
Mornington, VIC
14 CORE PORTFOLIO | HALF-YEAR RESULTS TO 31 DECEMBER 2019Core portfolio summary
67 4.3 years
properties portfolio WALE
14,204m2
3.3 ha
average lettable
average land area
area
75%
82%
upgrade
metro located
properties or
properties
occupiedWeighted average lease expiry profile
25%
20%
15%
% of Rental Income
10%
5%
0%
CY20 CY21 CY22 CY23 CY24 CY25 CY26 CY27 CY28 CY29 Beyond
1
BWH 12 years occ. Showrooms
1 Includes both proposed and completed upgrades
16 CORE PORTFOLIO | HALF-YEAR RESULTS TO 31 DECEMBER 2019Lease expiries next three years
> Five year options recently exercised for Fountain Gate (VIC) and Port Melbourne (VIC)
Lease Rent
Property Options Comments
expiry ($’000pa)
Vermont South Aug 2020 4 x 5 yrs 2,297 Notification required by Jun 2020
Northland Aug 2020 2 x 5 yrs 2,030 Notification required by Jun 2020; Bunnings seeking planning approval for alternative site nearby
Hawthorn Oct 2020 4 x 5 yrs 3,381 Notification required by Jul 2020
Coburg Nov 2020 3 x 5 yrs 1,707 Board approval to upgrade (refer to slide 18)
Mt Gravatt Dec 2020 4 x 5 yrs 1,407 Notification required by Sep 2020
Broadmeadows Jan 2021 10 yrs 2,007 Notification required by Oct 2020
Mar – Properties acquired in 2011 portfolio transaction - Belmont, Cockburn, Fairfield Waters,
2011 Portfolio 5 x 5 yrs 16,258
Oct 2021 Pakenham, Wagga Wagga, Port Kennedy, Smithfield, Dubbo, Harrisdale and Caroline Springs
Midland Sep 2021 2 x 5 yrs 1,888 Notification required by Jun 2021; Bunnings seeking planning approval for alternative site nearby
Geraldton Dec 2021 2 x 5 yrs 1,341 Notification required by Sep 2021
Mornington Dec 2021 2 x 5 yrs 1,760 Notification required by Sep 2021
Frankston Dec 2021 2 x 5 yrs 2,156 Notification required by Sep 2021
Gladstone Feb 2022 3 x 5 yrs 1,353 Notification required by Nov 2021
Greenacre Apr 2022 5 x 5 yrs 2,785 Notification required by Oct 2021
Craigieburn May 2022 5 x 5 yrs 1,722 Notification required by Nov 2021
Scoresby May 2022 2 x 5 yrs 1,943 Notification required by Feb 2022
Hervey Bay Dec 2022 1 x 5 yrs 1,347 Notification required by Sep 2022
17 CORE PORTFOLIO | HALF-YEAR RESULTS TO 31 DECEMBER 2019Coburg upgrade
> Upgrade cost of $2.5 million at a funding rate of 5.5 per cent
> Upgrade increases the total retail area by 918 square metres incorporating an expansion and full
enclosure of the timber trade sales area
> Anticipated completion late 2020
> On completion of the works Bunnings will enter into a new 10 year lease with existing 3 x 5 year
options to remain (current term certain 0.8 years)
> Annual CPI reviews with a market rent review on the exercise of each option
> 10 per cent caps/collars on the market rent review
> No other changes to the existing lease
18 CORE PORTFOLIO | HALF-YEAR RESULTS TO 31 DECEMBER 2019Hoxton Park repositioning
> Bunnings surrendered its lease in June 2019 ($2.15 million surrender fee to BWP)
> Project completed at a total cost of $13.0 million
> Property is 92 per cent leased mainly to national tenants and expect remaining two tenancies to
be leased by mid-2020
> WALE 10.2 years at 31 December 2019 (pre-Bunnings lease surrender 2.0 years)
> Fair value on-completion of $58.3 million (7.00 per cent capitalisation rate), resulting in a $19.5
million increase in fair value from 30 June 2019
> Fair value prior to Bunnings advising it would vacate was $45.6 million (June 2016)
19 CORE PORTFOLIO | HALF-YEAR RESULTS TO 31 DECEMBER 2019Alternative use
properties
Hawthorn, VIC
20 ALTERNATIVE USE PROPERTIES | HALF-YEAR RESULTS TO 31 DECEMBER 2019Other stores being repositioned
Property Lease expiry1 Progress
Development complete with Amart Furniture and Snooze open and trading.
Mandurah Expired Negotiations with other LFR tenants progressing for the remaining lettable area
of 2,560sqm
Concept and feasibility finalised for multi-tenanted development; heads of
Cairns Expired agreement secured for up to 2,500sqm of the building; lease discussions with
other interested parties ongoing
Construction progressing for large format retail redevelopment; AFL executed
with Amart Furniture for 5,000sqm; heads of agreement secured for 430sqm
Port Macquarie Expired
gym tenant; leasing campaign progressing for remaining 1,500sqm of lettable
area
Leasing interest received from a number of parties; redevelopment options
Morley Jul 2020 being carefully considered given location and favourable zoning. Medium term
residential and/or mixed-use development potential
Bunnings has lodged a DA for an alternative location. Future options for the
Northland Aug 2020 site are under review and include possible rezoning and mixed use
development
Scheme amendment and structure plan approved in late 2019 to allow
Mindarie Sep 2021 mixed-use development of the site which adjoins Ocean Keys sub-regional
1 End of the current Bunnings lease term shopping centre; interest received from national retailers
21 ALTERNATIVE USE PROPERTIES | HALF-YEAR RESULTS TO 31 DECEMBER 2019Divestments
Property Lease Sale price Progress
expiry1 ($m)
Under conditional option agreement to sell to unrelated third
Underwood Expired Undisclosed
party, progressing toward satisfaction of conditions
Under conditional option agreement to sell to unrelated third
Belmont North Mar 2021 Undisclosed
party, progressing toward satisfaction of conditions
1 End of the current Bunnings lease term
22 ALTERNATIVE USE PROPERTIES | HALF-YEAR RESULTS TO 31 DECEMBER 2019Capital
management
Gladstone, QLD
23 CAPITAL MANAGEMENT | HALF-YEAR RESULTS TO 31 DECEMBER 2019Debt facilities
> Average borrowings for the half-year $439.0m (down 4.7% on prior corresponding period)
– 3.53% p.a. weighted average cost of debt after hedging (2018: 4.31% per annum)
– Borrowing costs for the half-year $7.8m (down 21.9% on prior corresponding period)
> Bank facilities with CBA and WBC can be extended a further year each year, subject to
agreement
> Cost of debt at 31 December 2019: 3.5% per annum
> Interest cover: 8.5 times at 31 December 2019 (2018: 6.6 times)
> Gearing 18.0% at 31 December 2019 (2018: 18.4%)
> A- / Stable S&P rating and A3 Moody’s rating maintained
As at 31 Dec 2019 Limit ($m) Drawn ($m) Expiry
WBC 135 69 30 April 2022
CBA 110 68 31 July 2022
SMBC 100 100 20 May 2024
Corporate bonds- five year 110 110 11 May 2022
Corporate bonds- seven year 100 100 10 April 2026
Total /Weighted average 555 447 3.5 years
24 CAPITAL MANAGEMENT | HALF-YEAR RESULTS TO 31 DECEMBER 2019Debt duration
Debt maturity profile as at 31 December 2019
300
Volume (A$M)
65.9
200
69.1
100 110.0 42.4
100.0 100.0
67.6
0
FY FY FY FY FY FY FY
20 21 22 23 24 25 26
Bonds Drawn bank facilities Undrawn bank facilities
25 CAPITAL MANAGEMENT | HALF-YEAR RESULTS TO 31 DECEMBER 2019Interest rate hedging
Hedge book profile by Dec 2019 Jun 2020 Dec 2020 Jun 2021 Dec 2021 Jun 2022
half-year ending
Active swaps ($m) 98 85 85 70 40 -
Swap rates (%)
Maximum 4.92 4.12 4.12 2.60 2.60 -
Minimum 2.39 2.39 2.39 2.39 2.60 -
Weighted average (%)1 3.07 2.79 2.79 2.51 2.60 -
> Including fixed rate corporate bonds
– $307.5m hedged at 2.08%2 weighted average to maturity, at 31 December 2019
1 Weighted average of active swaps at respective half-year end
2 Excludes margins payable on the fixed corporate bonds
26 CAPITAL MANAGEMENT | HALF-YEAR RESULTS TO 31 DECEMBER 2019Outlook
Nunawading, VIC
27 OUTLOOK | HALF-YEAR RESULTS TO 31 DECEMBER 2019Outlook
Macro economic environment
> Demand for Bunnings Warehouse properties should remain stable, subject to any significant risk
events interrupting capital flows into the Australian property sector
> The Trust is well positioned in the event of any change in the macro economic environment with
low gearing, sustainable cashflow and good access to funding
Rental growth
> 19 CPI/ 26 fixed rent reviews in second half FY2020
> 16 Bunnings MRR’s to be finalised
Investment
> Primary focus on finalising outcomes on alternative use sites
> Negotiating with Bunnings to progress opportunities to re-invest in existing portfolio
> Continuing to look for acquisitions that create value for the Trust
FY20 distribution
The Trust could expect the distribution for the year ending 30 June 2020 to be one per cent higher
than the ordinary distribution paid for the year ended 30 June 2019, a similar level of growth to the
interim distribution. Capital profits will be utilised to support distributions as necessary.
28 OUTLOOK | HALF-YEAR RESULTS TO 31 DECEMBER 2019Further information
bwptrust.com.au
Responsible entity:
BWP Management Limited
Tel: +61 8 9327 4356
Email: investorrelations@bwptrust.com.au
29 FURTHER INFORMATION | HALF YEAR RESULTS TO 31 DECEMBER 2019You can also read