Q2 2020 Conference Call Presentation - BTB Real Estate Investment Trust (TSX: BTB.UN) August 14, 2020 - BTB Reit

Page created by Regina Rodriguez
 
CONTINUE READING
Q2 2020 Conference Call Presentation - BTB Real Estate Investment Trust (TSX: BTB.UN) August 14, 2020 - BTB Reit
Q2 2020
Conference Call
Presentation
BTB Real Estate Investment Trust (TSX: BTB.UN)
August 14, 2020
Q2 2020 Conference Call Presentation - BTB Real Estate Investment Trust (TSX: BTB.UN) August 14, 2020 - BTB Reit
NON-IFRS MEASURES
    BTB consolidated financial statements are prepared in accordance with IFRS. Consistent with BTB management framework, management uses certain financial
    measures to assess BTB financial performance, which are not generally accepted accounting principles (GAAP) under IFRS.

    The following measures, net operating income (NOI), net operating income of the same-property portfolio (SPNOI), funds from operations (FFO), adjusted funds from
    operations (AFFO), adjusted net income and comprehensive income and net property income and per unit information, if applicable, are non-IFRS performance
    measures and do not have standardized meanings prescribed by IFRS.

    These measures are used by BTB to improve the investing public’s understanding of operating results and the Trust’s performance. IFRS are International Financial
    Reporting Standards defined and issued by the IASB, in effect as at the date of this presentation. These measures cannot be compared to similar measures used by
    other issuers. However, BTB presents its FFO in accordance with the Real Property Association of Canada (REALPAC) White Paper on Funds from Operations, as revised
    in February 2019. Securities regulations require that these measures be clearly defined, that they be readily comparable to the most similar IFRS measures, and that
    they not be assigned greater weight than IFRS measures.

    FORWARD-LOOKING STATEMENTS
    From time to time, we make written or oral forward-looking statements within the meaning of applicable Canadian securities legislation. We may make forward-looking
    statements in this document, in other filings with Canadian regulators, in reports to unitholders and in other communications. These forward-looking statements may
    include statements regarding our future objectives, strategies to achieve our objectives, as well as statements with respect to our beliefs, outlooks, plans, objectives,
    expectations, forecasts, estimates and intentions. The words “may,” “could,” “should,” “outlook,” “believe,” “plan,” “forecast,” “estimate,” “expect,” “propose,” and the
    use of the conditional and similar words and expressions are intended to identify forward looking statements.

    By their very nature, forward-looking statements involve numerous factors and assumptions, and are subject to inherent risks and uncertainties, both general and
    specific, which give rise to the possibility that predictions, forecasts, projections and other forward-looking statements will not be achieved. We caution readers not to
    place undue reliance on these statements as a number of important factors could cause our actual results to differ materially from the expectations expressed in such
    forward-looking statements. These factors include general economic conditions in Canada and elsewhere, the effects of competition in the markets where we operate,
    the impact of changes in laws and regulations, including tax laws, successful execution of our strategy, our ability to complete and integrate strategic acquisitions
    successfully, potential dilution, our ability to attract and retain key employees and executives, the financial position of lessees, our ability to refinance our debts upon
    maturity, our ability to renew leases coming to maturity, and to lease vacant space, our ability to complete developments on plan and on schedule and to raise capital
    to finance our growth, as well as changes in interest rates. We caution that the foregoing list of important factors likely to affect future results is not exhaustive. When
    relying on forward-looking statements to make decisions with respect to BTB, investors and others should carefully consider these factors and other facts and
    uncertainties. Additional information about these factors can be found in the “Risks and Uncertainties” section of the MD&A.

    BTB cannot assure investors that actual results will be consistent with any forward-looking statements and BTB assumes no obligation to update or revise such
    forward-looking statements to reflect new events or circumstances, except as required under applicable securities regulations.

2
Q2 2020 Conference Call Presentation - BTB Real Estate Investment Trust (TSX: BTB.UN) August 14, 2020 - BTB Reit
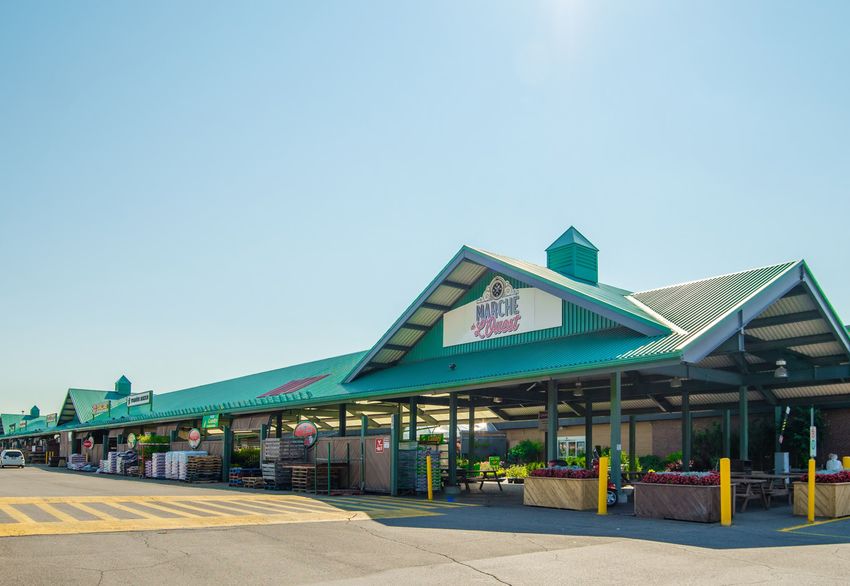
QUARTERLY HIGHLIGHTS

    MICHEL LÉONARD
    PRESIDENT & CEO

                            1405-1411 Crescent Street & 1327-1333 Saint-Catherine Street West, Montréal

3
Q2 2020 Conference Call Presentation - BTB Real Estate Investment Trust (TSX: BTB.UN) August 14, 2020 - BTB Reit
Q2 2020 Operational Highlights

         Focus of the team as we navigate through the COVID-19 crisis

         Resilience of the portfolio through solid collection results

         Retail segment predominantly tenanted by value-oriented
          and grocery-anchored national retailers (no enclosed malls)

         Limited exposure to retail bankruptcies

         Made specific adjustments to the fair values of 2 properties and
          an additional allowance for bad debt that affected our payout ratios

         Distribution adjusted to preserve our liquidities and to ensure
          the Trust’s future activities

4                                                                                50 Saint-Charles Street West, Longueuil
Q2 2020 Conference Call Presentation - BTB Real Estate Investment Trust (TSX: BTB.UN) August 14, 2020 - BTB Reit
Q2 2020 Operational Highlights

    92.9%                 +1.8%
    Committed Occupancy   NOI Growth
                          (Revenue +2.8%)

    97.7%                 7.5¢
    Q2 Rent Collections   FFO / Unit
                          (Payout 114%)

    307K sq.ft.           58.6%
    YTD Renewals          Total debt ratio
                                             3761–3781 Sources Boulevard, Dollard-Des-Ormeaux

5
Q2 2020 Conference Call Presentation - BTB Real Estate Investment Trust (TSX: BTB.UN) August 14, 2020 - BTB Reit
Navigating through COVID-19

      Covid-19 Task Force
      In the early stages, BTB implemented a COVID-19 Task Force composed of different levels
      of management from different departments in order to:
       Analyze the different requests of rent abatement that were sent by our clients

       Establish internal protocols to minimize the impact on operations

       Establish a clear channel of communication with our clients

       Establish a protocol for rent and AR collections

       Analyze the different market risks and forces which can influence BTB's tenant base

       Administer the CECRA Program

      Rent Deferral Program
      BTB quickly established a rent deferral program for its tenants in order to mitigate the risks
      associated with short payments of rent or full rent abatements. Each tenant request was
      analyzed on an individual basis by the COVID-19 Committee.

      Most of the rent deferral requests and applications for the CECRA program were for the retail
      segment.

6                                                                                                      7150 Alexander Fleming Street, St-Laurent
Q2 2020 Conference Call Presentation - BTB Real Estate Investment Trust (TSX: BTB.UN) August 14, 2020 - BTB Reit
Rent Collection
    Portfolio resilience showing strong collections

                                      Q2 Rents             Deferred rent         CECRA subsidies
                                                                                                               Total
                                      Collected             Payments              to be collected

     Office                            93.7 %                  2.1 %                   2.1 %                  97.9%
                                                                                                                                      BTB'S
                                                                                                                                      COMPETITIVE
     Retail                            76.2 %                  5.3 %                   7.8 %                  89.3%
                                                                                                                                      ADVANTAGES
                                                                                                                                         No enclosed malls
     Industrial                        96.7 %                  2.8 %                      -                   99.5%
                                                                                                                                         Portfolio
                                                                                                                                          diversification with
                                                                                                                                          good exposure to
     Mixed-Use                         97.1 %                   1.0 %                  1.5 %                  99.6%                       industrial & office
                                                                                                                                          markets
     Total Q2 Rent
                                       89.6 %                  3.8 %                   3.4 %                  96.8%                      Largest tenants are
     Collections
                                                                                                                                          investment grade

                                                                                                                                         Core market
       Confirmed in July additional 12.5% grant from Quebec government (equivalent to 0.85% for a total of 97.7%)                         presence
       Factoring both government subsidies the estimated loss is $275K for the second quarter
                                                                                                                                         2018 repositioning
       Tenant bankruptcies or tenants seeking protection had limited impact on our portfolio: 1) Aubainerie in Gatineau;                  strategy shows its
       2) Reitmans (1 closing & 4 will stay in operation); 3) Sportium (1 store closing Jan 31st, 2021); 4) Dunn’s (1 store closed)       strength

7
Q2 2020 Conference Call Presentation - BTB Real Estate Investment Trust (TSX: BTB.UN) August 14, 2020 - BTB Reit
Implementing measures to manage
    cash during the crisis

         Monthly interest payment postponements, capital payment waivers
          or both with our major mortgage lenders

         Municipal tax payment deferrals offered by a few municipalities

         Reduction of capital expenditures and tenant improvements

         Efforts by the Trustees, the senior management and the employees
          to defer part of the variable compensation to post-COVID

         Board of Trustees reduced the distribution payable to unitholders
          by 28.6%, beginning with the May 2020 distribution

                                                                                       1465-1495 Saint-Bruno Blvd
                                                                              ‘‘Méga Centre Saint-Bruno’’, St-Bruno
8
Q2 2020 Conference Call Presentation - BTB Real Estate Investment Trust (TSX: BTB.UN) August 14, 2020 - BTB Reit
Leasing and Renewal Strategy
    Lease renewal flow as at the end of Q2 2020
    Lease Renewals

    Sq.ft.                   Q2                             YTD

    2020                     44,166                         144,836

    2021+                    26,320                         162,420

    Total                    70,486                         307,256

       67.1% of the leases maturing in Q1 and Q2 2020 have been renewed.

       256,503 sq.ft. are currently under negotiation across all the business segments (incl. 2021 renewals).

       Out of the leases under negotiation, 66,769 sq.ft. are specific to the retail segment & we haven’t
       received a notice of non-renewal to date.

       83,000+ sq.ft. of leasable area expiring in 2021 was already renewed in July (total 245,420 sq.ft. YTD).

    New Leases

       26,391 sq.ft. of vacant spaces were leased during Q2 and 51,386 sq.ft. were leased for the cumulative
       period of Q1 and Q2.

       374,604 sq.ft. available to lease by the end of Q2 with limited impact on the occupancy rate
       (down 20bps vs Q2 2019 & up 50bps vs Q1 2020 following the sale of 1001 Sherbrooke East).

       Average rental rate of expired and renewed leases during Q2 decreased by 1.4% (office +3.1%, retail
       +8.7%, and mixed use -10.2% due to a specific lease renewal). For the cumulative six-month period,
       the average rate of expired and renewed leases increased by 2.3%.
9                                                                                                                 2611 Queensview Drive, Ottawa
Q2 2020 Conference Call Presentation - BTB Real Estate Investment Trust (TSX: BTB.UN) August 14, 2020 - BTB Reit
Capital Allocation
     Pursuing our portfolio strategy and mitigating risks on specific assets
                                                                                                                                               10.2%                            1.4%
                                                                                                                                               Mixed-use                        Development
                                                                                                                                                                                1 property
     2020 Acquisitions

                                                                                                                                                  6 properties
                                                                                                                                    92.1% Occ. (-1.1% vs ’19)                   0.1M SF
                                                                                                                                         0.6M SF (Flat vs ’19)

                                                                                                                                 22.6%                                                       38.9%
                                                                                                                                                          5.3M sq.ft.
                         2611 Queensview Drive,
                         Ottawa (ON)                                                                                                                                                         Office
                                                                                                                                  Industrial                                                 29 properties
                         Acquisition date: February 2020                                                                           16 properties                                             90.8% Occ.
                         Purchase price: $21.8 million                                                                93.6% Occ. (-2.0% vs ’19)
                                                                                                                          1.2M SF (-0.3M vs ’19)
                                                                                                                                                                 64 Properties               (+2.8% vs ’19)
                         Property type : Office                                                                                                                                              2.1M SF (-0.1M vs ’19)
                                                                                                                                                                    $895M
     2020 Dispositions

                                                                                                                                                                 26.4%
                                                                                                                                                                    Retail
                                                                                                                                                                12 properties
                         5600 ch. de la Côte-de-           311 Ingersoll St. South,         1001 Sherbrooke St. East,
                                                                                                                                                   95.6% Occ. (-2.6% vs ’19)
                         Liesse, Montréal (QC)             London (ON)                      Montréal (QC)                                             1.4M SF (Flat vs Q2’19)
                         Disposition date: March 2020      Disposition date: January 2020   Disposition date: June 2020
                         Sale price: $9.3 million          Sale price: $13.3 million        Sale price: $21.6 million
                         Property type : Industrial        Property type : Industrial       Property type : Office

                                                                                                        Q2
10
FINANCIAL OVERVIEW

     MATHIEU BOLTÉ
     VICE PRESIDENT
              & CFO

                            825 Lebourgneuf ‘‘Complexe Lebourgneuf Phase I’’, Québec

11
2020 Second Quarter Financial Results

                                                             Q2’20          COVID-19           Q2’20 Adj                    Q2’19             ∆     ∆ Adj

      Revenues                                              $23.1M              $0.9M ❶              $24.0M                $22.4M       + $0.7M    + $1.6M

      NOI                                                   $12.4M              $0.5M ❷              $12.9M                $12.2M       + $0.2M    + $0.7M

      Net income                                           $(1.1)M              $5.2M ❸                $4.1M                    $3.3M   - $4.4M    + $0.8m

      Recurring FFO per unit                                    7.5¢               2.5¢                 10.0¢                    9.5¢     - 2.0¢    + 0.5¢

      Payout ratio on FFO                                     114%               -29%                    85%                    111%      + 3%      - 26%

      Recurring AFFO per unit                                   6.7¢               2.5¢                   9.2¢                   8.5¢     - 1.8¢    + 0.7¢

      Payout ratio on AFFO                                    127%               -35%                    92%                    123%      + 4%      - 31%

      Wtd avg units o/s (000)                               63,115                                                         57,294

     ❶ $0.5M base rent; $0.4M 25% loss CECRA program
     ❷ $0.9M revenues; -$0.4M benefits for not operating at full capacity
     ❸ $0.5M NOI; $1.1M additional allowance for expected credit losses; $3.6M fair value adjustment on investment properties

12
Operating Revenues & NOI

             Operating Revenues ($M)                                              Net Operating Income ($M)

                                +2.8%
                                                                                                           +1.8%
                       22,4                    23,1                                               12,2                   12,4

                     Q2 2019                 Q2 2020                                            Q2 2019                Q2 2020

       YTD +6.5%
                                                                                   YTD +8.3% (NOI % from 52.7% in 2019 to 53.7% in 2020)
       Latest acquisitions strong performance (Pitfield, St-Hilaire, St-Bruno,
        Queensview). Net of sales +$1.7M.                                               •   100 bps YTD productivity from cost management

       Same-property -5.0% (YTD -1.9%)                                            Portfolio growth & capital recycling strong performance +$1.0M
              CECRA Program -$0.4M
                                                                                   Same-property -7.1% (YTD -1.8%) mainly impacted by the
              Tenant bankruptcies related write-offs -$0.5M                        revenues related to CECRA program & some tenant bankruptcies

13
Recurring FFO & AFFO

                           FFO ($M)                                                           AFFO ($M)
                    9.5¢/u.
                                                                                        8.5¢/u.
                                           7.5¢/u.
                                                                                                               6.7¢/u.

                               -13.5%
                                                                                                   -13.2%
                      5,45
                                             4,71                                         4,88
                                                                                                                 4,24

                    Q2 2019                Q2 2020                                      Q2 2019                Q2 2020

       Payout ratio from 110.5% in Q2 2019 to 113.9% in Q2 2020            Payout ratio from 123.2% in Q2 2019 to 126.6% in Q2 2020

       FFO of 7.5¢/u., 2.0¢/u. lower than 2019, considering:               AFFO of 6.7¢/u., 1.8¢/u. lower than the prior year, considering:

             0.4¢/u. CECRA program                                                0.4¢/u. CECRA program

             1.8¢/u. allowance for expected credit losses                         1.8¢/u. allowance for expected credit losses

       Excluding the 2 elements, run rate of 10.0¢/u. and payout of 85%    Excluding the 2 elements, run rate of 9.2¢/u. and payout of 92%

14
Capitalization as of Q2 2020
                                                                                                                                              Weighted Avg.   Weighted Avg.
                                                                   Net Debt Breakdown ($M)                                  Amount
                                                                                                                                              Interest Rate       Term
                  5.6%         1.7%
                 Convertible   Bank borrowings                     Mortgages payable                                          $497              3.75%   (1)      4.8 yrs
                 debentures    ($15M)
                    ($51M)
                                                                   Convertible debentures                                      $51               6.60%           2.3 yrs

                                                                   Acquisition credit facility                                 $15            Prime + 3.25%
                                                                   ($19M Capacity)

                                                                   Total debt                                                 $563              4.02%   (2)

     55.0%
     Mortgages
      ($497M)
                  $904M                      37.7%
                                             Unitholders’ equity
                                             ($341M)
                                                                   Cash and restricted cash                                    (23)

                                                                   Net debt                                                   $540

                                                                   Gross book value                                           $923

                                                                   Net debt / GBV                                         58.6%        (3)
                                                                   (Incl. convertible debentures)

                                                                   1.   From 3.71% in Q1 2020 and 3.93% in Q2 2019
                                                                   2.   Weighted average interest rate for the mortgages and the debentures
                                                                   3.   From 59.3% in Q1 2020 and 61.4% in Q2 2019

15
Debt Maturities
     Well–spread debt maturities to mitigate renewal risks as of Q2 2020

               250

               200

               150
          $M

                                                                                               223
               100                                                                24
                                                                                                                     Mortgage payable
                                   27

                50
                                                                                  84
                                   60       61
                                                         33          36                                              Convertible debentures
                 0
                     Available   Q2 2020   2021         2022        2023         2024        2025 +
                     Liquidity

                                            Debenture

                                            Maturity December 2020: On-going discussions to complete refinancing by year-end

                                            Mortgages

                                            $60M maturing in 2nd half of 2020 with $28M completed in July and $32M
                                            to be refinanced in due course

16
CLOSING REMARKS

     MICHEL LÉONARD
     PRESIDENT & CEO

                           11590-11800 De Salaberry Boulevard – ‘‘Marché de l’Ouest’’ Dollard-Des-Ormeaux

17
You can also read