PERMROCK ROYALTY TRUST (NYSE: PRT) - OPERATIONAL UPDATE OCTOBER 2018
←
→
Page content transcription
If your browser does not render page correctly, please read the page content below
PERMROCK ROYALTY TRUST (NYSE: PRT)

OPERATIONAL UPDATE

OCTOBER 2018

                                     1
PermRock Royalty Trust – 2018 Operational Update
 NOTICE TO INVESTORS
This presentation includes certain forward-looking statements and projections provided by Boaz Energy II, LLC (“Boaz Energy”), including with regard to the
properties covered by the Trust’s net profits interest (the “Trust Assets”) included in PermRock Royalty Trust (the “Trust”). When used in this presentation, the
words “anticipate,” “believe,” “continue,” “estimate,” “expect,” “intend,” “may,” “will” and similar expressions are intended to identify forward-looking
statements. Any statements contained herein that are not statements of historical fact may be deemed to be forward-looking statements. Any such statements
and projections which reflect various estimates and assumptions by Boaz Energy concerning anticipated results of the Trust Assets are based on Boaz Energy’s
experience and perception of historical trends, current conditions, expected future developments and other factors it believes are appropriate.

All forward-looking statements are subject to risks and uncertainties. A number of factors, many of which are beyond the control of Boaz Energy and the Trust,
could cause actual results to differ materially from those implied or expressed by the forward-looking statements contained in this presentation. These factors
include, but are not limited to, the risks described under the heading “Risk Factors” in the Trust’s Quarterly Reports on From 10-Q and other public filings filed with
the Securities and Exchange Commission (the “SEC”) and include, in particular, the amount and timing of spending by our partners in acreage Boaz Energy does not
operate, resolution of Permian Basin take-away constraints and the success of development activities, including those by our partners in acreage Boaz Energy does
not operate. No representations or warranties are made by Boaz Energy, the Trust or any of their affiliates as to the accuracy of any such statements or
projections. While Boaz Energy bases these statements in good faith on assumptions that it believes to be reasonable when made, these forward‐looking
statements are not a guarantee of the Trust’s performance, and you should not place undue reliance on such statements. Accordingly, actual results may vary from
the projected results and such variations may be material.

Any forward-looking statement speaks only as of the date on which such statement is made and neither Boaz Energy nor the Trust undertakes any obligation to
correct or update any forward-looking statement, whether as a result of new information, future events or otherwise, except as required by applicable law.

This presentation has been prepared by Boaz Energy and includes market and other statistical information from sources believed by it to be reliable, including
independent industry publications, government publications or other published independent sources. Although Boaz Energy believes these sources are reliable, it
has not independently verified the information and cannot guarantee its accuracy and completeness.

Rate of return (“ROR”) and return on investment (“ROI”) disclosed in this presentation are calculated based on drilling and completion costs and estimated future
lease operating expenses and do not give effect to expenses of the Trust. In addition, these costs may be higher than we are projecting or may increase over
time. Estimated Ultimate Recovery or “EUR” refers to estimates of the sum of reserves remaining as of a given date and cumulative production as of that date
from a currently producing or hypothetical future well, as applicable. These quantities do not necessarily constitute or represent reserves as defined by the SEC.
We have not risked EUR estimates, and quantities that may be ultimately recovered from our interest may differ substantially from estimates.
A number of factors can impact ultimate recovery, including actual drilling results as well as geological and mechanical factors. Estimates of type/decline curves,
per‐well EUR, and resource potential may change significantly as development provides additional data. Additionally, initial production rates contained in this
presentation are subject to decline over time and should not be regarded as reflective of sustained production levels.

                                                                                                                                                                                             2
PermRock Royalty Trust – 2018 Operational Update
PERMROCK ROYALTY TRUST OVERVIEW
PermRock Royalty Trust offers investors many of the benefits of direct ownership in oil and gas properties.
▪ PermRock Royalty Trust (“PermRock”) or (the “Trust”) is a perpetual
Favorable Structure royalty trust formed by Boaz Energy II, LLC (“Boaz Energy”) through a
conveyance of an 80% net profits interest (“NPI”) in oil and natural gas
producing properties located in the Permian Basin.
▪ The organizational structure incentivizes continued prudent development
Aligned Interest of the Underlying Properties. PermRock unitholders and its sponsor, Boaz
Energy, share comparable economics.
▪ The NPI represents the Trust’s right to receive 80% of cash flow after lease
Net Profits operating expense (“LOE”), severance and ad valorem taxes and capital
Calculation expenditures. The remaining 20% of the NPI is retained by Boaz Energy.
Tax Advantaged ▪ PermRock is a pass-through entity making monthly distributions with
Monthly unitholders receiving an annual form 1099 and information to assist in
Distribution calculating any applicable depletion allowance for tax purposes.
▪ PermRock’s distributions are influenced by various factors. Basin
Operational Update differentials and capital investments are examples of factors that have
had a significant influence on the distributions during Q2 and Q3.
3PermRock Royalty Trust – 2018 Operational Update
FAVORABLE STRUCTURE
PermRock is a perpetual royalty trust formed by Boaz Energy through a conveyance of 80% net profits interest in
oil and natural gas producing properties located in the Permian Basin.
▪ PermRock is a Delaware statutory trust
Who is formed to own a perpetual interest in oil and
PermRock? natural gas producing properties.
Who is the ▪ The Trust was established in 2017 through
Trustor and a trust agreement among Boaz Energy as
Trustor, Simmons Banks, as Trustee and
Trustee? Wilmington Trust, as Delaware Trustee.
▪ No leverage is permitted at the Trust
Conservative level.1 New Mexico
Structure Texas
▪ Units of PermRock are treated as mineral
Ownership of royalty interests and are a tax advantaged
Real Property investment reported on a Form 1099.
Permian Shelf Permian Platform
▪ The Trust has a perpetual ownership in Permian Clearfork Permian Abo
Perpetual defined assets. These assets represent a
Trust significant resource base with additional
development opportunities. 4
1. Under limited circumstances, the Trustee may cause the Trust to borrow funds to pay Trust liabilities .PermRock Royalty Trust – 2018 Operational Update
ALIGNED INTEREST
The organizational structure incentivizes continued prudent development of the Underlying Properties. PermRock
unitholders and the Trust’s sponsor share comparable economics.
Trustee
(Simmons Bank)
Boaz Energy II, LLC
(Sponsor)
Public
Unitholders
5,915,732 Trust units
(48.6% beneficial interest)
20% of net profits from the
Underlying Properties
6,250,000 Trust units
(51.4% beneficial interest)
Net Profits Interest PermRock Royalty Trust
Underlying Properties (80% of net profits from
NYSE: PRT
the Underlying Properties)
(Trust)
5PermRock Royalty Trust – 2018 Operational Update
NET PROFITS CALCULATION
The NPI represents the Trust’s right to receive 80% of cash flow after lease operating expenses (“LOE”), severance
and ad valorem taxes and capital expenditures. The remaining 20% of the NPI is retained by Boaz Energy.
▪ Mature, conventional Permian
Conventional Basin oil fields. Monthly Net Profits
Properties
Calculation
Revenue from Underlying Properties
▪ Shallow, predictable decline
Shallow rates. Five-year average proved -- Lease Operating Expenses
Decline developed decline of 7.2%.1
-- Severance & Ad Valorem Taxes
-- Development Capex
▪ 89% oil reserves and 74%
Oil Focused proved developed reserves.1 Net Profits (100%)
20% 80%
Boaz PermRock Royalty Trust
▪ +
Energy
$15.71 per BOE operating Hedge Impact3
High Margin expense. (includes LOE, taxes, tax accruals, and
Properties the operator’s administrative overhead charges)2
Distribution to Trustee
-- Trust Expenses
▪ Boaz Energy is the operator of
High % of
89% of current net production.2 Distribution to Unitholders
Operational
Control 1. 12/31/2017 SEC reserve report; prepared by Cawley, Gillespie & Associates
2. Based on the distribution announced 9/18/2018. 6
3. Hedge impact can only be positive as the Trust was conveyed the right to any profits on
certain NYMEX Oil put options purchased by Boaz Energy through 2019.PermRock Royalty Trust – 2018 Operational Update
NET PROFITS CALCULATION
The NPI is distributed monthly to unitholders using a modified cash basis of accounting. As a result, distributions
may very from month to month based on the nature of oil and gas operations.
Distribution Mechanics for 9/18/2018 Announcement
July 2018 August 2018 September 2018 October 2018
Determines and
Operations and Accounting and Distributions
Announces
Production Reporting Paid
Distributions
▪ Oil and gas produced ▪ Boaz Energy receives ▪ July NPI reported to the ▪ Distribution paid to
from Underlying payment from Trustee unitholders on or about
Properties hydrocarbon sales and ▪ Trustee calculates 10 business days after
invoices for operational distribution per unit record date
▪ Product marketed costs.
(spot basin prices ▪ Current month Trust
G&A expenses deducted
applicable)
▪ Reduced by any reserve
deemed appropriate
▪ Production and
overhead costs ▪ Distribution announced
incurred ▪ Distribution record date (last
business day of the month)
▪ Trust receives net profits
from Boaz Energy
7PermRock Royalty Trust – 2018 Operational Update
TAX ADVANTAGED INVESTMENT
PermRock is a pass-through entity making monthly tax advantaged distributions with unitholders receiving an
annual form 1099 for tax reporting purposes.
What is a Tax ▪ Units in PermRock are treated as mineral royalty interest and distributions are taxed as
ordinary income subject to a depletion deduction. The basis of the unit is adjusted accordingly,
Shield
creating a potential income tax shield until the unit is ultimately sold.
▪ Depletion is a form of depreciation that allows for a deduction from taxable income to reflect
Depletion declining production reserves over time. Unitholders take the greater of either percentage
Deduction depletion or cost depletion.
▪ An investor purchases 10,000 units of at a price of $17.00/unit in January and holds the units
throughout the calendar year.
Original Basis: $170,000 10,000 units x $17.00/unit
How is the Depletion Factor: 0.05
Tax Shield Depletion Amount: $8,500 Original Basis x Depletion Factor
Calculated?
Adjusted Basis: $161,500 Original Basis – Depletion Amount
(Example Scenario) Yearly Distribution: $17,500 10,000 x $1.75/unit
PermRock Yield is Tax
Taxable Income: $9,000 $17,500 - $8,500
Advantaged. The estimated
Tax Advantage: $8,500 or 48% Tax Shield for investors at
IPO exceeded 45%. 8PermRock Royalty Trust – 2018 Operational Update
OPERATIONAL UPDATE - BASIN DIFFERENTIALS
PermRock’s distributions are influenced by various factors including basin differentials to NYMEX.
▪ Basin differentials are the difference in the price
Midland-Cushing Prompt History & Forward Curve
received for oil & natural gas sales in a specific
region relative to the monthly average price traded $5.00
on the NYMEX. Midland-Cushing Prompt History & Forward Curve $-
$5.00
▪ The oil price received by the Trust is subject to basin $(5.00)
differentials. Historically the differentials have more $-
Basin closely tracked the NYMEX price, but due to the $(10.00)
$(5.00)
Differential rapid growth in oil production in the Permian Basin, $(15.00)
$(10.00)
take-away capacity in the region has been strained,
Outlook causing these differentials to widen substantially in $(15.00)
$(20.00)
recent months.1 Argus, CME Group $(20.00)
$(25.00)
Argus, CME Group
▪ The forward curve suggests that the basin $(25.00)
differentials will return to normal levels as
Argus Midland-Cushing prompt Argus Midland-Cushing forwards
numerous pipeline projects come online over 2018 Argus Midland-Cushing prompt Argus Midland-Cushing forwards
Argus Midland-Cushing spot
and 2019. Argus Midland-Cushing spot
Production NYMEX Oil Price PermRock Oil Implied Differential
Declaration Date
Month for the Month Price Received to NYMEX
Jan-18 5/4/2018 $63.55 $61.57 ($1.98)
Feb-18 5/4/2018 $62.16 $60.16 ($2.00) As an example, using oil production from
2018 Review the distribution announced 9/18/2018, a
Mar-18 5/18/2018 $62.87 $59.64 ($3.23) $3.00 increase in the received price for oil
of Received
Apr-18 6/19/2018 $66.33 $62.83 ($3.50) adds approximately $0.01/unit to the
Oil Price distribution.
May-18 7/20/2018 $69.89 $62.96 ($6.93)
Jun-18 8/21/2018 $67.32 $56.45 ($10.87)
Jul-18 9/18/2018 $70.74 $60.55 ($10.19) 9
1. The average oil differential including transportation fees on the underlying properties in 2017 was minus $3.31 from NYMEXPermRock Royalty Trust – 2018 Operational Update
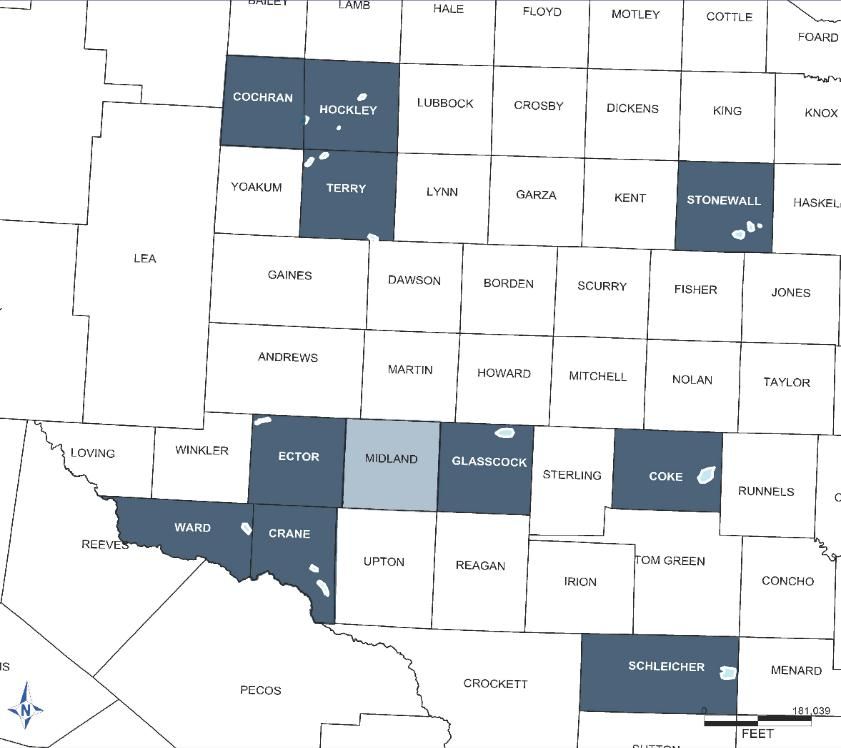
OPERATIONAL UPDATE - CAPEX
Area Map
PermRock’s distributions are influenced by the amount and timing of capital invested in development.
CAPEX by Distribution Month Distribution and CAPEX per Unit
$500 $0.20
$400
$0.15
M$
$300
$/Unit
$0.10
$200
$100 $0.05
$0 $0.00
IPO₁ IPO₁ May-18 Jun-18 Jul-18 Aug-18 Sep-18 IPO₁ IPO₁ May-18 Jun-18 Jul-18 Aug-18 Sep-18
PropertyCapex
Summary Monthly Distribution Capex Initial Distribution
Investment Opportunities Investment Philosophy
▪ The underlying properties include both Boaz Energy ▪ Boaz Energy remains committed to a disciplined capital
operated and non-operated acreage. At IPO, Boaz Energy program that includes a focus on return to Unitholders.
had not booked any undeveloped reserves on non- Boaz Energy will continue to invest capital in high quality
operated acreage electing instead to maintain a more projects while striving to maintain steady distributions to
conservative outlook. unitholders.
▪ Since IPO, Boaz Energy has reinvested $1.76 MM ($1.41
MM net to PRT) in order to further develop and expand its 10
reserve base.
1. The 1st distribution following the IPO was 2 months of net profits (Jan. 18 & Feb. 18) effective 01/01/2018.PermRock Royalty Trust – 2018 Operational Update
OPERATIONAL UPDATE - CAPEX
Area Map
Developmental Drilling
Boaz Energy is participating in an active drilling program as a
non-op partner. This program represents a significant portion
of the Trust’s CAPEX to date.
Drilling Program Example1
▪ Location: Crane and Ward Counties
▪ Type of Projects: Vertical Wolfcamp Producers
▪ D&C Costs: $1.2 MM gross ($0.1 MM net to PRT)
▪ Type Curve Economic Outputs: ($60 oil flat and $3 gas flat)
▪ ROR = 137%
▪ ROI = 6.1
▪ Payout = 1.05 years
Property Summary
Type Curve Future Development
5 20
IP (30) = 141 BO & 392 MCF ▪ Since the IPO of the Trust, Boaz Energy has participated
4 Gross EUR = 309 MMBOE
15 in several successful vertical Wolfcamp wells which have
MBO per Month
MMcf per Month
3 proven up additional drilling locations.
10
2
▪ Economics on the vertical Wolfcamp wells are
1 5
compelling and Boaz Energy has elected to continue
0 0 participating in the developmental program.
0 12 24 36 48 60 72 84 96 108 120
11
Oil Gas
1. Boaz Energy internally generated type curve and EUR based on offset producing Wolfcamp wellsPermRock Royalty Trust – 2018 Operational Update
PERMROCK ROYALTY TRUST INVESTMENT OVERVIEW
Perpetual structure, no leverage permitted and limited bankruptcy risk
Tax benefits of owning oil and natural gas assets, including a tax advantage and the simplicity of a Form 1099
Attractive, long-term investment opportunity in Permian Basin oil
Mature, low-risk reserves with predictable, low-decline production profile
Substantial waterflood operations in place with limited capex required
Significant resource base with potential development opportunities not reflected in value of proved reserves
Low cost operator controlling over 89% of production as of September 18, 2018
Sponsor interest aligned with the Trust
12You can also read