2Q 2019 Investor Presentation - August 2019 1 - AWS
←
→
Page content transcription
If your browser does not render page correctly, please read the page content below

2Q 2019 Investor
    Presentation
          August 2019

                        1
Important Disclosures
Forward-Looking Statements and Risk Factors
The information in this presentation includes “forward-looking statements.” All statements, other than statements of historical fact included in this presentation,
regarding our strategy, future operations, financial position, estimated revenues and losses, projected costs, prospects, plans and objectives of management are
forward-looking statements. When used in this presentation, the words “could,” “believe,” “anticipate,” “intend,” “estimate,” “expect,” “project” and similar
expressions are intended to identify forward-looking statements, although not all forward-looking statements contain such identifying words. These forward-
looking statements are based on certain assumptions and expectations made by Roan Resources, Inc. (“Roan” or the “Company”), which reflect management’s
experience, estimates and perception of historical trends, current conditions and anticipated future developments. Such statements are subject to a number of
assumptions, risks and uncertainties, many of which are beyond the control of the Company, which may cause actual results to differ materially from those
implied or anticipated in the forward-looking statements. When considering these forward-looking statements, you should keep in mind the risk factors and other
cautionary statements found in the Company’s filings with the Securities and Exchange Commission, including its annual report on Form 10-K, and any
subsequently filed quarterly reports on Form 10-Q or current reports on Form 8-K. We caution you that these forward-looking statements are subject to all of the
risks and uncertainties, most of which are difficult to predict and many of which are beyond our control, or incidental to the development, production, gathering
and sale of oil, natural gas and NGLs. These risks include, but are not limited to, commodity price volatility, inflation, lack of availability of drilling and production
equipment and services, environmental risks, drilling and other operating risks, regulatory changes, the uncertainty inherent in estimating reserves and in
projecting future rates of production, cash flow and access to capital, the timing of development expenditures and the other risks.
You are cautioned not to place undue reliance on any forward-looking statements, which speak only as of the date of this presentation. Except as otherwise
required by applicable law, we disclaim any duty to update any forward-looking statements, all of which are expressly qualified by the statements in this section,
to reflect events or circumstances after the date of this release.
Our production forecasts and expectations for future periods are dependent upon many assumptions, including estimates of production decline rates from
existing wells and the undertaking and outcome of future drilling activity, which may be affected by significant commodity price declines or cost increases.
Non-GAAP Measures
Adjusted EBITDAX, Adjusted Net Income, Adjusted Net Income per Share, cash G&A and Net Debt are financial measures not presented in accordance with
generally accepted accounting principles in the United States (“GAAP”). Reconciliations of these non-GAAP financial measures to the most directly comparable
GAAP measures can be found in the appendix to this presentation.
Industry and Market Data

This presentation has been prepared by Roan and includes market data and other statistical information from sources believed by Roan to be reliable, including
independent industry publications, government publications or other published independent sources. Some data is also based on Roan’s good faith estimates,
which are derived from its review of internal sources as well as the independent sources described above. Although Roan believes these sources are reliable,
they have not independently verified the information and cannot guarantee its accuracy and completeness.

                                                                                                                                                                             2
2Q 2019 Highlights

                              Enhanced liquidity by ~$100MM                                                                                 Production of 50.8 MBoe/d (26% oil,
                              through term loan facility                                                                                    29% NGLs, 45% gas), up ~4% QoQ

                              Adjusted EBITDAX(1) of ~$79.3MM,                                                                              Drilled 17 wells(2) and turned online 22
                              up 9% QoQ                                                                                                     wells(3)

                              CAPEX of ~$114MM, down ~34%                                                                                   Drill and completion costs per foot
                              QoQ                                                                                                           reduced by 25% and 20%,
                                                                                                                                            respectively, QoQ

                              Entered into definitive agreements                                                                            LOE of $2.44 per Boe, down ~28%
                              for crude oil to be gathered, blended                                                                         QoQ
                              and shipped, expected to decrease
                              crude transportation costs on
                              gathered barrels by ~50%

1)   Adjusted EBITDAX is a non-GAAP measure, please see slide [21] for a reconciliation of this measure to the most directly comparable GAAP measure
2)   Gross, operated wells that have been rig released
3)   Gross, operated wells
                                                                                                                                                                                  3
Roan Snapshot
 Company Overview                                                                                                Largest Contiguous Acreage Position in Core of Anadarko Basin
• ~50.8 MBoe/d current net production(1) with 26% being oil
                                                                                                                                                                        Acreage Position
• 3 rigs running                                                                                                                                                            (Net Acres)
• 22 wells turned online 2Q’19                                                                                                                                      Merge                 117,300

• 2Q’19 Adjusted EBITDAX(2) of ~$79.3MM                                                                                                                             SCOOP                  27,200

                                                                                                                                                                    STACK                   7,400
• ~$150 million of liquidity as of 6/30/19
                                                                                                                                                                    Other                  30,100
• Well hedged for 2019 with over 95% of oil hedged at $60.39 and                                                                          STACK                     Total                 182,000
     ~75% of gas hedged at $2.90
• Focused on achieving free cash flow positive by YE 2019 while
     growing production 15% to 22% FY 2018 to FY 2019
• ~117,300 of contiguous acreage in the Merge
             ‒ ~75% of acreage is in the oil and liquids-rich windows in Merge
             ‒ ~66% average working interest in Merge
                                                                                                                                                        MERGE

Average Daily Production (MBoe/d)

                                                                 54.1
                                                 46.5                            48.9           50.8
                  37.7            36.1                                                                                                                      SCOOP
     25.7

     4Q'17        1Q'18           2Q'18          3Q'18           4Q'18          1Q'19           2Q'19
                                                                                                                   48 rigs running in the Anadarko Basin on this map
1)    Current net production is as of 2Q’19                                                                                                                                                         4
2)    Adjusted EBITDAX is a non-GAAP measure, please see slide [21] for a reconciliation of this measure to the most directly comparable GAAP measure
2019 – Focus, Focus, Focus

Liquidity • Focus on enhancing current liquidity position
           - Secured $100MM term loan facility
          • Focus on achieving cash flow neutrality/positive by YE’19

 Results • Focus on optimizing locations and well spacing
         • Focus on delivering on guidance
           - 2Q’19 beat on production, CAPEX & EBITDAX

Strategic • Exploring strategic alternatives to enhance value for shareholders
Alternatives
           - Outright sale
           - Basin consolidation
           - Non-core, credit-enhancing asset divestitures

          • Focus on reducing completed well costs
           - Currently trending at ~$7MM, below original projections
 Costs    • Focus on reducing LOE and G&A
           - LOE down ~28% QoQ; G&A down ~22% QoQ

                                                                                 5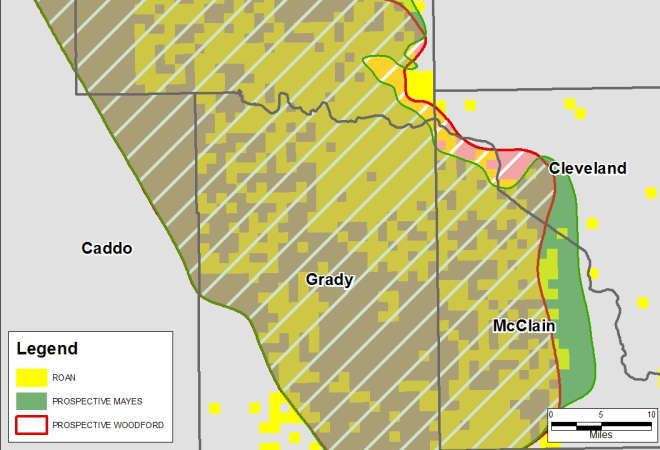
2Q 2019 Results
2Q 2019 results:                                               2Q 2019 Activity Map:
• All 22 gross operated wells turned online:
                                                                  Red Bullet /                      Earl
       • Average per well 30-day IP rate of 1,165 Boe/d (42%                                      (6 wells)
                                                                  Silver Charm
         oil, 23% NGLs, 35% gas) from a normalized 10,000-
         foot lateral                                               (4 wells)

       • Average well cost of ~$7.3 million                                                         Victory Slide
                                                                                                      (3 wells)
Highlight 2Q 2019 results:                                      Mad Play
• Mad Play unit:                                                (4 wells)
       • Average per well 30-day IP rate of 1,601 Boe/d (44%            WEST
         oil, 20% NGLs, 36% gas) from a normalized 10,000-                       CENTRAL
         foot lateral
• Red Bullet / Silver Charm unit:
                                                                                           EAST
       • Average per well 30-day IP rate of 1,545 Boe/d (41%
         oil, 26% NGLs, 33% gas) from a normalized 10,000-
         foot lateral
• Earl unit (3 Mayes wells):
       • Average per well 30-day IP of 1,466 Boe/d (39% oil,
         24% NGLs, 37% gas) from a normalized 10,000-foot
         lateral
• Victory Slide (2 Mayes wells):                                                                              Zenyatta
       • Average per well 30-day IP rate of 1,170 Boe/d (67%                                                  (2 wells)
         oil, 15% NGLs, 18% gas) from a normalized 10,000-
         foot lateral
• Zenyatta unit:
       • Average per well 30-day IP rate of 1,104 Boe/d (32%
         oil, 32% NGLs, 36% gas) from a normalized 10,000-
         foot lateral                                                                                                     6
Merge Cross Section
Multiple zones Required      Multiple zones possible where Reservoir is present       Reservoir acting as one zone

                   WEST
                                             CENTRAL
                    Upper                                                                       EAST
                    Mayes
                                                                            Upper
                                                                            Mayes

                    Lower                                                  Lower                                           Lower
                    Mayes                                                  Mayes                                           Mayes

                                                                         Woodford
                 Woodford

                                            Merge Central:                               Merge East:
Merge West:                                 • Multiple zones possible where quality      • One primary target zone
• Multiple zones are required                 reservoir is present and sufficient        • Target Lower Mayes for access
  due to quality reservoir and                thickness                                    to both Mayes and Woodford
  sufficient thickness                      • Target Lower Mayes, Upper Mayes
• Target Lower Mayes, Upper                   and Woodford where high quality
  Mayes and Woodford                          reservoir exists
                                                                                                                             7
West Merge - Mad Play Unit

Mad Play unit:
• Average per well 30-day IP rate of
  1,601 Boe/d (44% oil, 20% NGLs, 36%
  gas) from a normalized 10,000-foot
  lateral from 4 wells                                                         WEST
                                                                                                  EAST
• Average per well 90-day IP rate of                                Mad Play
                                                                      unit
  1,240 Boe/d (42% oil, 20% NGLs, 38%
  gas)                                                                                CENTRAL

• Actual average lateral length of 6,780
  feet
• 2 Woodford / 2 Mayes wells drilled;
  500’ horizontal spacing between
  wellbores
• Average well costs of under $7MM per                                  Mad Play unit (7-well design)
  well                                                              Mayes

• First unit in West Merge, considerable
  operated running room in this area for
                                                                                         Future
  Roan
                                                                                          wells
Future units will target Upper Mayes,
Lower Mayes and Woodford

                                                                    Woodford

                                                                                                         8
Note: Offset well rates are 30-day IP rates normalized to 10,000’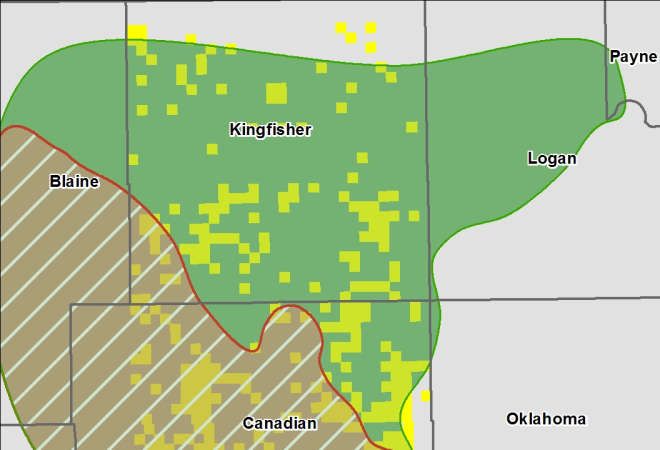
West Merge – Red Bullet / Silver Charm
Red Bullet / Silver Charm unit:
                                                 Red
• Average per well 30-day IP rate              Bullet /
  of 1,545 Boe/d (41% oil, 26%                  Silver
  NGLs, 33% gas) from a                        Charm
  normalized 10,000-foot lateral               WEST                 EAST
  from 4 wells
• Actual average lateral length of                        CENTRAL
  9,500 feet
• 2 Woodford / 2 Mayes wells
  drilled; 800’ to 1,160’ horizontal
  spacing and ~200 vertical
  spacing between wellbores
• Average well costs of ~$8MM          Red Bullet / Silver Charm unit (5-well design)
  per well                             Mayes

• Turned to first sales middle of
  June
Future units will target Upper
Mayes, Lower Mayes and
Woodford
                                       Woodford

                                                                                        9
Central Merge - Earl Unit

 Earl unit (3 Mayes wells):
 • Average per well 30-day IP of 1,466
   Boe/d (39% oil, 24% NGLs, 37% gas)
   from a normalized 10,000-foot lateral
   for the 3 Mayes wells
                                                                                WEST             EAST
 • Average per well 90-day IP of 1,222
   Boe/d (32% oil, 24% NGLs, 44% gas)                                          Earl unit
 • Actual average lateral length of 10,160                                                 CENTRAL
   feet
 • Average well costs of approximately
   $7.4MM per well

 • 3 Woodford / 3 Mayes wells; 500’-800’
   horizontal spacing between wellbores                                          Earl unit (6 wells)
              • Learning: the 3 Woodford wells                      Mayes
                were not optimal because Mayes
                wells communicated with the
                Woodford due to the Woodford
                wells being spaced too close to
                the Mayes wells

                                                                    Woodford

                                                                                                        10
Note: Offset well rates are 30-day IP rates normalized to 10,000’
East Merge - Victory Slide
Victory Slide (2 Mayes wells):
• Average per well 30-day IP rate of
1,170 Boe/d (67% oil, 15% NGLs,
18% gas) from a normalized 10,000-
foot lateral for the 2 Mayes wells
WEST
• Average per well 60-day IP rate of EAST
1,091 Boe/d (64% oil, 17% NGLs,
19% gas) CENTRAL
• Actual average lateral length of 9,900’
2Q’19 Victory
• Average well costs of ~$6MM per well Slide wells
• Woodford well not optimal for unit
• Learning: suboptimal
completion design for rock
Victory Slide
• Extensive operated running room in Mayes
this area for Roan
• Several strong offset operated
producing wells
Future
wells
Woodford
11
Note: Offset well rates are 30-day IP rates normalized to 10,000’Southern SCOOP - Zenyatta
Zenyatta:
• Average per well 30-day IP rate of
1,104 Boe/d (32% oil, 32%
NGLs, 36% gas) from a
Zenyatta
normalized 10,000-foot lateral
• Average per well 90-day IP of
1,004 Boe/d (27% oil, 34%
NGLs, 39% gas)
• Actual average lateral length of
9,750 feet
• 2 Woodford wells drilled with
~1,000’ horizontal spacing
between wellbores Zenyatta pad (2 wells)
• Tested two different zones within
the Woodford Upper Woodford
• Multiple potential benches for Middle Woodford
future drilling
12Anticipated Remaining 2019 Drill Schedule
2019 anticipated drill plans:
2019 Focused Activity Map:
• Activity focused in core areas of the Merge
• Barbara Campbell – completed drilling & will be WEST CENTRAL EAST
turned to first sales in August (3 Mayes wells)
• Battleship pad (3 Mayes wells) Whirlaway
• Big Brown pad (4 Mayes wells)
Northern
• Birdstone – completed drilling (2 Mayes wells) Omaha Skywalker
Dancer
& Tater
• Don’s Ranch – completed drilling & will be turned to
Gallant
first sales in August(3 Mayes wells) Fox Finn
• Duke (3 Woodford wells) Birdstone
Unbridled (completed drilling)
• Eight Belles (4 Mayes wells)
• Finn (3 Mayes wells) Don’s
Battleship Duke
Ranch
• Gallant Fox (2 Mayes wells) (completed drilling)
• Northern Dancer (3 Mayes well)
Big Brown Barbara
• Omaha (2 Woodford wells, 1 Mayes well) Campbell
Eight (completed drilling)
• Skywalker (2 Mayes wells) Belles
• Tater (2 Mayes wells) ROAN DRILL UNIT
ROAN LEASEHOLD
• Unbridled (2 Mayes wells, 1 Woodford well)
• Whirlaway (2 Mayes wells, 1 Woodford)
• Several strong offset producing wells 1310+ Years of Quality Inventory
• 2018 tested Woodford and Mayes
designs, co-completions and
independent spacing
STACK
• 2019 program will co-develop of
Woodford and Mayes to produce
maximum unit efficiency within our
large, contiguous acreage position
MERGE
• Operated and non-operated spacing
tests have demonstrated unit
intensity of 5 to 8 wells will
appropriately balance unit returns
and per well capital efficiency
• Provides 10+ years of drilling at
SCOOP
current pace
1) Operation control assumed if leasehold exceeds 37.5% working interest in a unit 14
2) Excludes horizontal developed locations2019 Cost Optimization
Strategic focus on reducing completed well costs
• ~$200k reduction in drilling costs 2019 improvement in per well CWC ($ in MM) :
• Decreased drill times $9.0 $8.5 ~$0.2
• Increased equipment efficiency ~$0.8
• ~$800k reduction in completion costs $7.5 ~$0.5
~$7.0
• Service cost reductions
• Design optimization
$6.0
• In-basin sand
• Recent 2-mile well completions have come in at
~$7MM per well
• ~$500k better than 2019 target
• Further design optimization $3.0
Strategic focus on reducing operating costs
• LOE
• Water disposal agreement with Blue Mountain
Midstream began early 2Q’19, which we expect will $0.0
save ~$8MM in 2019 2018 A Drilling Completion 2019 Target 2019 Cost Current CWC
Reductions Reductions Reductions
• G&A
• Focus on overall reduction of G&A costs
15Updated 2019 Guidance Summary
May 2019 Updated 2019 2019 Plan Highlights
Guidance Guidance
Total Capex ($MM) $515 - $555 $495 - $525 • Reducing capital activity to focus
Production (MBoe/d) 51.5 – 55.5 50.5 – 53.5 on generating free cash flow by
Oil Mix 25.5% – 27.5% 25.5% – 27.5% fourth quarter 2019
Liquids Mix 51.5% – 59.5% 51.5% – 59.5%
• Capital activity anticipated to be
LOE ($/Boe) $2.90 - $3.20 $2.80 - $3.10
Cash G&A ($/Boe)(1) (non-GAAP) $1.95 - $2.15 $2.00 - $2.20 $495 - $525MM, a ~34%
Production Taxes (% of Production Revenues) 5.2% – 5.4% 5.2% – 5.4% reduction as compared to 2018
Gross Operated Spuds (Rig Released) ~60 ~60
and $30MM lower from the top
Gross Operated Wells Turned Online ~70 ~70
end of the range of previous
Capex ($ in MM) Production (MBoe/d) guidance
• Development activity expected to
$773
50.5 – 53.5 result in ~15%-22% Y/Y production
$495 – $525
43.7 growth
• 2H’19 wells are focused on de-
risked core areas and optimal well
spacing
2018 2019 (Estimate) 2018 2019 (Estimate)
Notes: Guidance now assumes ethane rejection for remainder of year 16
1) Cash G&A is a non-GAAP measure and is equal to total G&A less equity-based compensation expense and expense for allowance for doubtful accounts.Appendix
17Merge Spacing Assumptions
Merge is divided into 3 regions Gross Thickness (Mayes+Woodford)
• East – Woodford + Mayes < 275’
• Central – Woodford + Mayes = 275’ – 375’ WEST
• West - Woodford + Mayes > 375’
Spacing assumptions for each region A
• East = ~5 wells/unit EAST
‒ One primary target zone (Lower Mayes)
• Central = 5-7 wells/unit
‒ Multiple zones possible (Upper Mayes, Lower
Mayes, Woodford) CENTRAL A’
• West = 8 wells/unit (potential upside)
‒ Multiple zones (Upper Mayes, Lower Mayes,
Woodford)
WEST CENTRAL EAST
A A’
Upper
Mayes
Lower
Mayes
Woodford
Hunton
375’ 275’
18Updated Production Guidance Walk
Ethane
recovery vs
2019 Guidance as of: May 14, 2019
rejection
August 7, 2019
impact
Full-Year Production (MBoe/d) 51.5 – 55.5 (~1.9) 50.5 – 53.5
Oil Mix 25.5% – 27.5% - 25.5% - 27.5%
Liquids Mix 51.5% – 59.5% - 51.5% - 59.5%
Reasons for changes in production guidance
• May 2019 guidance assumed ethane recovery for June and 2H’19
• Updated guidance now reflects ethane rejection for June and 2H’19
• Ethane recovery vs. rejection impacts monthly production by ~3.3 MBoe/d;
• ~3.3 MBoe/d x 7/12 = ~1.93
19Current Hedge Summary
As of August 7, 2019:
3Q19 4Q19 Bal 2019 2020 2021
Oil Hedges
Volume Hedged Daily (Bbls/d) 14,151 13,051 13,601 9,370 4,740
Average Hedge Price ($/Bbl) $60.04 $60.74 $60.39 $60.57 $56.08
Natural Gas Hedges
Volume Hedged Daily (MMBtu/d) 110,000 120,000 115,000 43,730 9,863
Average Hedge Price ($/MMBtu) $2.91 $2.90 $2.90 $2.64 $2.86
NGL Hedges
Volume Hedged Daily (Bbls/d) 3,000 3,000 3,000 1,500 -
Average Hedge Price ($/Bbl) $32.25 $32.25 $32.25 $24.50 -
Gas Basis Hedges
Volume Hedged Daily (MMBtu/d) 80,000 80,000 80,000 30,000 -
Average Hedge Price ($/MMBtu) ($0.60) ($0.60) ($0.60) ($0.49) -
20Non-GAAP Reconciliations
Adjusted EBITDAX is a non-GAAP financial measure. We define Adjusted EBITDAX as net income (loss) adjusted for interest expense, income tax (benefit) expense, depreciation,
depletion, amortization and accretion, exploration expense, non-cash equity-based compensation expense, aborted offering costs expense, severance and employee matters expense,
expense for allowance for doubtful accounts, (gain) loss on sale of other assets, loss (gain) on derivative contracts, and cash (paid) received upon settlement of derivative contracts,
including amounts on contracts settled prior to contract maturity. Adjusted EBITDAX is not a measure of net income (loss) as determined by GAAP. Our accounting predecessor, Roan
LLC, passed through its taxable income to its owners for income tax purposes and thus, we have not incurred historical income tax expenses.
Net Debt is a non-GAAP financial measure equal to long-term debt outstanding on the credit facility and term loan, exclusive of any discounts or fees, less cash on hand.
Roan’s computations of Adjusted EBITDAX and Net Debt may not be comparable to other similarly titled measures of other companies or to such measure in our credit facility or any of
our other contracts.
Adjusted EBITDAX Reconciliation Net Debt Reconciliation
(in thousands) 1Q 2019 2Q 2019 2Q 2018 (In thousands) 2Q 2019
Net Income (Loss) ($58,056) $27,246 ($22,757) Credit Facility $659,639
Plus Adjustments: Term Loan, net 44,924
Unamortized original issue discount
Interest Expense 1,250
6,744 8,462 1,087 on Term Loan
Deferred financing costs on Term
Income Tax (Benefit) Expense
(22,897) 13,410 - Loan 3,826
Depreciation, Depletion, Amortization & Accretion
41,572 44,893 24,601 Funded Debt $709,639
Exploration Expense
12,488 11,406 10,633 Less: Cash 5,428
Non-Cash Equity-Based Compensation
3,065 (3,222) 2,835 Net Debt $704,211
Aborted Offering Costs -
2,155 -
Severance and Employee Matters -
687 -
Allowance for Doubtful Accounts
1,481 3,857 -
(Gain) Loss on Sale of Other Assets
(664) 50 -
Loss (Gain) on Derivative Contracts
83,642 (37,054) 54,602
Cash Received (Paid) Upon Settlement of Derivative Contracts(1)
5,382 7,361 (9,773)
Adjusted EBITDAX $72,757 $79,251 $61,228
Annualized $291,028 $317,005 $244,912
21
1) Includes cash received upon settlement of derivative contracts prior to the original contractual maturityInvestor Relations
Alyson Gilbert
Phone: 405-896-3767
Email: ir@roanresources.com
22You can also read