API Industry Outlook First Quarter 2020 - March 19, 2020 - American Petroleum Institute

Page created by Sherry Lopez
 
CONTINUE READING
API Industry Outlook First Quarter 2020 - March 19, 2020 - American Petroleum Institute
API Industry Outlook
First Quarter 2020

March 19, 2020
API Industry Outlook First Quarter 2020 - March 19, 2020 - American Petroleum Institute
Key points – Q1 2020
              Even before the coronavirus (COVID-19) appeared, strong U.S. oil & gas productivity plus new pipelines
              enabled February 2020 production records despite low prices and less drilling activity. Implications:
              ➢   WTI-Brent price differentials narrowed with Permian pipeline growth – to par in March with oil near $20/Bbl
              ➢   EIA projects U.S. oil & natural gas production to decrease year-on-year starting in Q4 2020
              Markets have responded to COVID-19 prevention measures that EIA projects will dissipate in coming
              quarters, but with oil prices that could remain low due to OPEC supply increases. Implications:
              ➢   EIA and IEA forecasts previously assumed OPEC would increase supply cuts, rather than supply
              ➢   Low oil prices have corresponded with a more rapid decrease in U.S. drilling – and less expected
                  associated natural gas and natural gas liquids (NGL) production per EIA
              Silver linings that have reinforced market resilience:
              1. Low energy prices bolster household budgets and disproportionately benefit low-income households
              2. New U.S. trade agreements with China, Mexico and Canada should eventually boost U.S. energy exports (EIA)
              3. IMO 2020 regulatory changes since January 1 have been smooth
              4. Natural gas generation rose to a record 38% of U.S. net electricity generation in 2019
www.api.org
API Industry Outlook First Quarter 2020 - March 19, 2020 - American Petroleum Institute
API industry health dashboard – Q4 2019
                                                                                   Increase vs.    Decrease vs.
       Key to the graphic:                                                         prior quarter   prior quarter             U.S. petroleum
                                                                                                                                demand
                                     5-year range                                                                                                              Revenues
                                                                                                                               20.7 mb/d
              minimum                                            maximum             Quarterly increase to                                                      $680 B
                                                                                      top of 5-year range

       Quarterly highlights
              Demand at the top of the 5-year range                                                                U.S. refinery                                             Net
                                                                                                                   throughput                                              income
              Despite drilling activity at a 5-year low and having fallen in Q4
                                                                                                                    16.9 mb/d                  U.S. drilling              $(14.6) B
              2019, record oil & gas production continued due to                                                                                 activity
                                                                                                                                                 821 rigs
              productivity gains and new pipeline capacity enabling drilled
              but uncompleted wells to come on stream
              Capital expenditures increased along with ongoing project
              commitments                                                                                                  U.S. oil & total                     Capital
                                                                                                                           gas production                    expenditures
              Net income fell with fourth quarter write-offs that were in the                                               33.7 mb/doe     Q4 2019 averages   $69.0 B
              middle of the 5-year range (vs. 2015 lows)                                                                                   Brent       $63.41/bbl
                                                                                                                                           WTI         $56.96/bbl
                                                                                                                                           NGL composite $5.36/mmbtu
       * Financial compilation based on API 200 companies with shares listed on U.S. stock exchanges                                       Henry Hub     $2.40/mmbtu
       sources: EIA, API MSR, Bloomberg, Baker Hughes, API Team Analysis
www.api.org
API Industry Outlook First Quarter 2020 - March 19, 2020 - American Petroleum Institute
Investing for the long-haul: the industry’s capital expenditures
      totaled $69 billion in Q4 and $266 billion for 2019
              Capital expenditures increased by 6.0% between the third and fourth quarters, with increases in most sectors but
              less in the midstream due to major pipeline completions

      Capital expenditures by industry segment
      Billion dollars
      100
                                                                                                                   Q4 2019 change
                                                                                                                       (%q/q)
       80
                                                                                                                    Total: 6.0

       60
                     Global Integrated                                                                                   18.0

       40
                     Upstream                                                                                             -7.4

       20
                                                                                                                          -9.6
                      Midstream
                      Downstream                                                                                          +31.5
                      Specialty Petrochemical                                                                             -+41.1
                      Equipment, Services and EPC                                                                           +8.6
         0
         Mar-18                      Jun-18                      Sep-18   Dec-18   Mar-19     Jun-19           Sep-19              Dec-19
        * All other oil & gas industry companies
        sources: Bloomberg, publicly-available company reports
www.api.org
API Industry Outlook First Quarter 2020 - March 19, 2020 - American Petroleum Institute
Industry capital projects map
              Across the energy value chain, an estimated 161 oil & gas-related projects are under construction

                                                                                                     24
                                                                                                                                    76
                                                                                                  Refinery
                                                                                                                                 Pipelines
                                                                                                 expansions
                                                                                                   $27.3 B
                                                                                                                                  $20.1 B

                                                                                                                                                  36
                                                                                                                   14 LNG                      PetChem
                                                                                                                   $189 B                       $108 B

                                                                       Refineries
                                                                                                   11 Gas
                                                                                                   storage                            344       Billion
                                                                                                                                   in estimated industry
                                                                                                   $145 M
                                                                       LNG                                                      projects under construction
                                                                       Petrochemical
                                                                       Gas Storage
                                                                       Pipeline        sources: S&P Market Intelligence, Oil & Gas Journal, American
www.api.org                                                                            Chemistry Council, API Team calculations as of Feb. 1, 2020
API Industry Outlook First Quarter 2020 - March 19, 2020 - American Petroleum Institute
Global economy & oil markets

www.api.org
Petroleum demand uncertainties and Non-OPEC production
      growth

www.api.org
API’s economic indicator: The API D-E-I™ - Feb. 2020
              The D-E-I™ value of -0.3 for February 2020 and three-month average of -0.2 suggests a continued slowing of
              industrial production

      Industrial production                                                                                                                                           API D-E-I™
      Percentage change year-over-year (3-month average)                                                                        Percentage change year-over-year (3-month average)
      15                                                                                                                                                                           3
                                                              Recession (left axis)                       Industrial production (left axis)              DEI (right axis)
      10                                                                                                                                                                           2

        5                                                                                                                                                                          1

        0                                                                                                                                                                          0

       -5                                                                                                                                                                          -1

     -10                                                                                                                                                                           -2

     -15                                                                                                                                                                           -3

     -20                                                                                                                                                                           -4
        2007            2008           2009          2010           2011           2012            2013   2014      2015       2016       2017      2018       2019         2020
         sources: API Monthly Statistical Report, EIA, CME Group, Moody’s, Federal Reserve Board
www.api.org
The U.S.-China phase one trade deal calls for
      increased U.S. energy exports
      China’s commitments to buy U.S.
      energy exports                                                                      China committed cumulatively to purchase $52.4 billion of
      Billion dollars                                                                     U.S. energy over two years, over and above a 2017 baseline
      50                                                                                  amount, including crude oil, LNG, metallurgical coal and
              Crude oil                      Refined products      LNG       Coal         specific refined products*

      40
                                                                    $33.9 B               API estimates the two-year commitment could include more
                                                                                          than 1.0 mb/d of crude oil, 0.5 mb/d of refined products
      30                                                                                  and 100 LNG cargoes, but these volumes rise as prices fall

                                                         $18.5 B
      20                                                                                  Given EIA’s expected growth in U.S. production, export
                                                                                          capacity and marine logistics – including ability to utilize the
                                                                                          Panama Canal – at least some of China’s purchases are
      10                                                                                  likely not to be incremental growth of U.S. exports, but
                                                                                          directionally should boost U.S.-China energy trade, provide
                                                                                          a welcome de-escalation of trade tensions, and spur new
        0                                                                                 opportunities for engagement on phase two trade issues
                  2017 Baseline                          Year 1     Year 2
                  sources: ITC , China customs statistics                           * Refined products under the agreement include naphtha, methanol, petroleum coke, propane, butane and other LPGs

              source: API Monthly Statistical Report (Dec. 2019)
www.api.org
Global economic growth has consistently required
       fossil fuels
              Linkages between global GDP growth and energy demand in total and for oil and natural gas have remained consistent

      Global primary energy demand versus GDP*
       Quadrillion Btu
       750
                   Total primary energy
                   Oil                                                                                                                    2019
                   Natural gas                                                  Great Financial Crisis
       600                                                                          (2008-2009)

       450

       300
                   1970

       150

          0
              15                          35                             55                                        75                                     95
                                                                 Real GDP (Trillion 2010$)     *Market exchange rate basis
www.api.org                                                                                    sources: EIA, IEA, Bloomberg, IMF, API Team calculations
EIA’s short-term projected changes in global oil
      demand and supply

      Global oil demand changes - EIA                                      Global oil supply changes - EIA
                       Million barrels per day                                          Million barrels per day
                       0         0.5         1                                         -4      -2      0      2

                                                 China’s demand                                                   OPEC expands
                           2019                  picks up in 2021                                       2019      production
              China        2020                                               OPEC                      2020
                           2021                                                                         2021

                                                 U.S. demand                                                      U.S. supply
                                                 grows slightly                                                   contracts in 2021
               U.S.                                                             U.S.

                                                 Rest of World
       Rest of World                             demand growth      Rest of Non-OPEC                              Non-OPEC
                                                 hampered in                                                      growth in 2020
                                                 2020
                       source: EIA                                                     source: EIA

www.api.org
After a near-term dip, EIA expects the global oil
      market to rebalance by Q4 2020

      EIA global supply/demand and Brent price estimates as of March 2020
      Million barrels per day                                                                                                         2020$/Bbl
      2.5                                                                                                                                   120
                                                Supply less demand   Brent crude oil prices          Column1          EIA estimates
      2.0
                                                                                                                                           100
      1.5
                                                                                                                                           80
      1.0

      0.5                                                                                                                                  60

      0.0
                                                                                                                                           40
     -0.5
                                                                                                                                           20
     -1.0

     -1.5                                                                                                                                  0
               2015                       2016               2017         2018                2019             2020       2021
              sources: EIA STEO (Mar. 2020), Bloomberg
www.api.org
U.S. oil cost effectiveness and productivity improved, but
      market prices have recently fallen
               BTU Analytics’ estimated breakeven prices fell among most major crude oil production areas, while EIA’s productivity
               estimates rose

      Oil estimated breakeven prices by production                                             U.S. oil productivity – monthly new well
      area – Feb. 2020*                                                                        production per rig
                                        Dollars per barrel ($/Bbl.)
                                      0        20         40        60                         Barrels per day oil-equivalent
                                                                                               3,000
                                         Feb. 2020
          Eagle Ford - West                                                                                                                 Eagle Ford
                                                Feb. 2019                                      2,500

                         Bakken                                                                2,000
                                                                              WTI spot price                                                Bakken
                                                                              Mar. 9, 2020     1,500
              Eagle Ford - East
                                                                                               1,000
        Permian - Delaware
                                                                                                500
                                                                                                                                            Permian
          Permian - Midland                                                                        0
         *Half cycle breakevens assuming 10% discount factor and play-specific costs
                                                                                                    2015             2016            2017             2018   2019   2020
         source: BTU Analytics                                                                      source: EIA Drilling Productivity Report(Mar. 2020)

www.api.org
During initial months of IMO 2020, the refining
      industry has been flexible to consumers’ benefit
                                                                                                               IMO 2020: Maximum marine fuel
              As we have suggested since 2018, the U.S. refining industry has been well                        sulfur content
              positioned for IMO2020                                                                            Sulfur content, %
                                                                                                                5
                                                                                                                4
              Initial months of IMO2020 implementation show the industry has flexibly been                      3    Outside emissions control
                                                                                                                2    areas (ECAs)
              able to produce less residual fuel oil and more ultra-low sulfur fuel oil, with a                 1    Within ECAs
              muted price response and inventory adjustments                                                    0
                                                                                                                  2005       2010       2015     2020   2025

      Residual fuel oil inventories and production                                U.S. residual fuel oil and diesel prices
      Million barrels                                   Million barrels           Dollars per gallon
      50                                                           300            4
                   Rest of World inventories
      40                                                                              Ultra-low sulfur diesel (ULSD)
                                                                                  3
                      U.S. inventories                            200
      30
                                                                                  2
      20
                                                                  100                 Residual fuel oil No. 6 (1% sulfur) *
                     U.S. production                                              1
      10
        0                                                         0               0
         2010                    2013            2016    2019                      2010                    2013                     2016            2019
         sources: JODI Oil World Database, EIA                                    sources: New York Harbor prices, CME Group and Bloomberg

www.api.org
Motor gasoline and diesel fuel prices have generally moved
      with crude oil, and EIA expects limited impact from IMO 2020

      Crude oil, retail gasoline and diesel fuel prices, adjusted for consumer price inflation
      2020$ per gallon
      4
                                                                                                                         EIA estimates

       3

       2

       1

              sources: EIA, AAA, Bloomberg, BLS
       0
           2015                   2016                   2017                2018             2019                2020
                         West Texas Intermediate crude oil      Gasoline - U.S. average   Diesel - U.S. average

www.api.org
U.S. household spending is disparate by income group
          Seven spending categories account for the majority of household expenditures
          The lowest 40% of households by income generally outspend their after-tax income, so every dollar matters

   2018 U.S. household spending by category as a share of after-tax income
    %         Housing ex energy    Food    Transportation ex fuels   Healthcare   Energy   Education   Personal insurance         Entertainment
  200

  175

  150

  125

  100

   75

   50

   25

     0
               Average U.S.       Lowest 20% income    Second 20% income     Third 20% income   Fourth 20% income     Highest 20% income
www.api.org
                household
                                                                                                               source: BLS Consumer Expenditure Survey
Lower household energy spending since 2014
                                          has helped low-income households the most
                                               For the average U.S. household, decreased energy prices and expenditures freed 1.6% of after-tax income for other
                                               spending needs between 2014 and 2018
                                               The percent of income freed up for non-energy spending was twice as high for the lowest 20% income quintile

   Change in household energy spending as a share of after-tax income, 2014-2018
                                                      Average U.S.
  Change in percent of after-tax income

                                                       household                 Lowest 20% income   Second 20% income       Third 20% income    Fourth 20% income      Highest 20% income
                                          0

                                          -1

                                          -2

                                          -3
                                                                                                               Electricity     Gasoline and motor fuels   Natural gas      Fuel oil

www.api.org
                                          -4
                                               source: BLS Consumer Expenditure Survey
Natural gas

www.api.org
Global LNG prices have been below historical
      levels but still generally twice those of the U.S.
       Global natural gas landed prices (dollars per million Btu) – December 2019

                                                                           UK
                                                                          $4.66
                                                                                  Belgium
                                                      Canada                       $5.32
                                                       $6.83      Spain                               Korea
                                                                  $4.53                                $5.42   Japan
                                                  Lake Charles                                      China      $6.70
                                                     $2.21                                          $5.42
                                    Mexico                                                  India
                                     $4.60                                                  $5.22

                                                          Argentina
                                                            $5.05
        sources: U.S. FERC (Mar. 2020) and METI
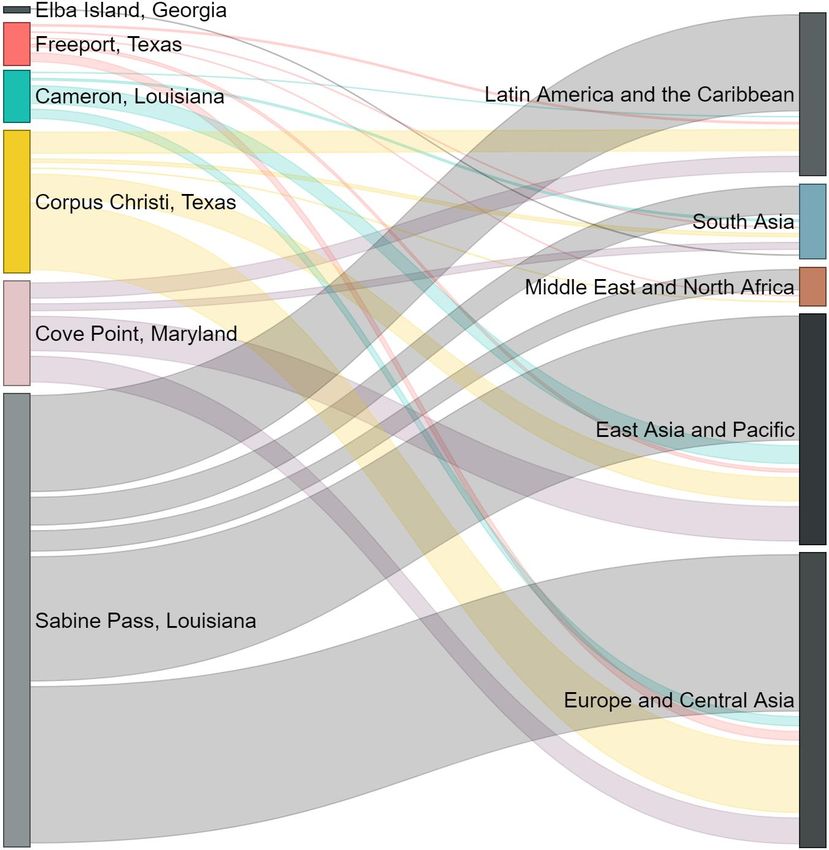
www.api.org
In 2019, U.S. LNG exports were from just six
      terminals, but served global markets
      2019 U.S. LNG exports by terminal
      Trillion cubic feet (Tcf)
      1.20

      0.90

      0.60

      0.30

      0.00
               Sabine             Corpus Cove Point Cameron   Freeport Elba Island
                Pass              Christi
               source: U.S. DOE
www.api.org
U.S. natural gas production growth has been
      supported by cost effectiveness and productivity
                BTU Analytics estimates breakeven prices among most natural gas-producing regions improved over the past year
                EIA estimates Appalachia’s new well productivity slipped in Q1 2020

      Natural gas estimated breakeven prices by                                                         U.S. natural gas productivity – new
      production area – Feb. 2020*                                                                      production per rig
                                          Dollars per million Btu (mmBtu)
                                                   0               1               2           3        Thousand cubic feet per day nat. gas-equivalent
                                                                                                        25,000
                                                       Feb. 2020
                               Haynesville
                                                     Feb. 2019
                                                                                    Henry Hub spot      20,000
                                                                                   price Mar. 9, 2020                                           Appalachia
              Appalachia - Northeast
                       PA                                                                               15,000

          Appalachia - Southwest                                                                                                                Haynesville
                                                                                                        10,000
                   PA

                                                                                                         5,000
                      Appalachia - Ohio

                                                                                                             0
              *Half cycle breakevens assuming 10% discount factor and play-specific costs
              source: BTU Analytics
                                                                                                              2015           2016            2017            2018    2019   2020
                                                                                                              source: EIA Drilling Productivity Report (Mar. 2020)
www.api.org
Real natural gas prices in Q1 2020 have been the
      lowest on record for the quarter in 45 years
              Since the advent of shale gas production, which accelerated after 2010, U.S. natural gas prices and price volatility
              have fallen by about half compared with history

      U.S. natural gas spot prices*
      2020 dollars per million Btu
      20

       16

       12

                                                                                                                                          Lowest Q1 prices
        8                                                                                                                                    on record

        4

        0
         1976                1981                 1986                1991                 1996                2001      2006   2011   2016
      * sources: EIA spot prices at Henry Hub (1997-Present), WSJ and Reuters (1989 to 1996), EIA wellhead (1976-1988)
www.api.org
Where enabled by pipeline connectivity, the energy revolution
      has lowered prices across the eastern United States
                                                                                                                              Dawn
              In 2010, before the energy revolution, prices at most natural
                                                                                                               Chicago
              gas hubs were greater than those at Henry Hub, Louisiana                                                                             Algonquin

              As Pennsylvania and Ohio became major gas producers,
              prices fell across the eastern U.S. except in New England,
                                                                                                                                            Dominion South Point
              which largely failed to expand its pipeline infrastructure
                                                                                                                                            Rockies East

      Natural Gas Spot Price Differences from Henry Hub                                                                        Florida Z2
      (annual averages)
                                                                                                                            Henry Hub
      Dollars per million Btu                                                                                            New England: A higher premium due
      1.0                                                                                                                to a lack of infrastructure

      0.5         Paid a premium above Henry Hub                                            2010       2019

      0.0

     -0.5
                 Received a discount below Henry Hub
     -1.0
                       Chicago    Florida Gas Transmission Rockies Express Pipeline   Dominion South Point    Dawn                      Algonquin
                                           Zone 2           (East) into Midwestern
              source: Bloomberg
www.api.org
In 2019, natural gas grew to a 38% percent share of
      U.S. electricity generation and led gains by all sources
              Natural gas achieved a record 38% share of U.S. net electricity generation in 2019
              As natural gas and renewables have replaced coal in power generation since 2010, U.S. power sector CO2 emissions fell
              by 22%, while the region’s SO2 and NOx emissions decreased by 71% and 40%, respectively

       U.S. electricity net generation                                       Power sector emissions by pollutant (million metric tons)
       (million megawatt hours)                                              CO2                                                SO2 and NOx
      5,000                                                     Renewables
                                                                             2400                                                         6

                                                            Solar
      4,000                          Wind
                                     Hydroelectric
                                                                             2000                                                         4
      3,000                          Natural gas
                     Oil

      2,000          Other           Nuclear
                                                                             1600                                                         2
      1,000
                                     Coal

              0                                                  1200                                                                     0
               2010 2011 2012 2013 2014 2015 2016 2017 2018 2019                    2010 2011 2012 2013 2014 2015 2016 2017 2018
              source: EIA                                                           sources: EIA Electric Power Annual (2018)

www.api.org
Resources: Chief Economist’s section at www.api.org

www.api.org
You can also read