HIAG Immobilien Holding AG Business Year 2017 - 19 March 2018
←
→
Page content transcription
If your browser does not render page correctly, please read the page content below
HIAG Immobilien Holding AG
Business Year 2017
19 March 2018

© HIAG, 19.03.2018           1
Disclaimer

The financial data as well as the other information presented herein constitute selected
information.

The information in this presentation does not constitute an offer or invitation and may not be
construed as a recommendation by us to purchase, hold or sell shares of HIAG Immobilien
Holding AG. This information or any copy thereof may not be sent or taken to or distributed in
any jurisdiction in which such transmission or distribution is unlawful. This document may
contain certain “forward-looking” statements. By their nature, forward-looking statements
involve risk and uncertainty because they relate to future events and circumstances. Actual
outcomes and results may differ materially from any outcomes or results expressed or implied
by such forward-looking statements.

HIAG                                                                                             2
Agenda

1.     Highlights
2.     Financial Results Year-End 2017
3.     Major developments
4.     Market and outlook
5.     Financial calendar

HIAG                                     3
Highlights Collected property income raised by 6.5% to CHFm 55.8 Increase in annualised property income by 3.6% WALT increase to 7.9 years after successful rental agreement renewals and new signings Growth of portfolio to CHFm 1’283 Weighted average maturity of liabilities increased to 3.6 years after the successful third bond issuance of CHFm 150 in May 2017 Successful Launch Event HIAG Data as of March 15 Increase of dividend by 5.6% to CHF 3.8 HIAG 4
Acquisitions in proximity to existing sites
                                                                           Office

                                                                               2                          6
                                                                       1                                                                                                2
                                                                                                                          Office
                                                                   1                                          8
                                                                                            1                                          1
                                                                           1
                                                                                                                                       2                  1
                                                                   1           1            2
                                                                                                      8                                                                                 3
                                                Basel                          2                                                           1
                                                               1                                                          4
                                                                                                                                   1
                                                                                        1                                          1
                                                                                                1             1
                                                                                                              1       4                3
                                                                                    1                                                      4
                                                                                                                      Zurich                   9                            St Gallen
                                                                                                          1
                                                               3                                                                               2
                                                                                                                  1           1
                                                                                                                                       1           1
                                                               8                                                      1

                                                                                                                      3
                                    1

                                                                                                Lucerne                                                             3

                                   Neuchâtel

                            1                           Bern

                                                                                                                                                                                            Davos

               Office   Lausanne

                                        1
           1
           1
                                            1
       2
       1
               1
                                                   Sion                                                                                                Bellinzona

           Geneva

HIAG                                                                                                                                                                                                5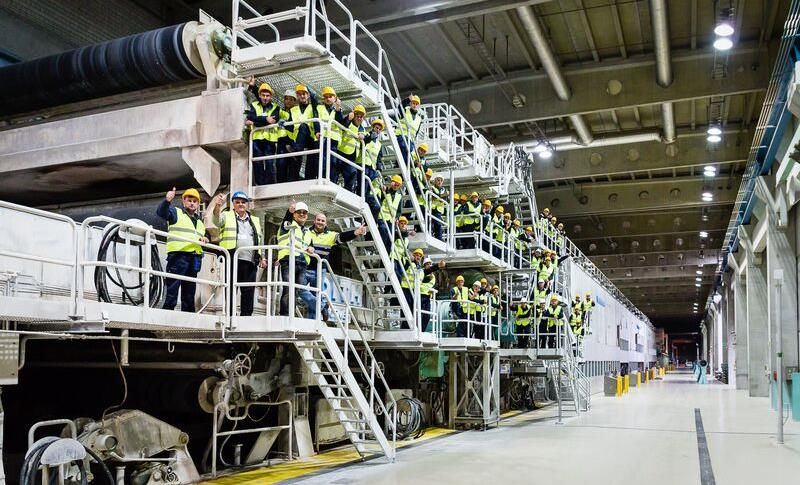
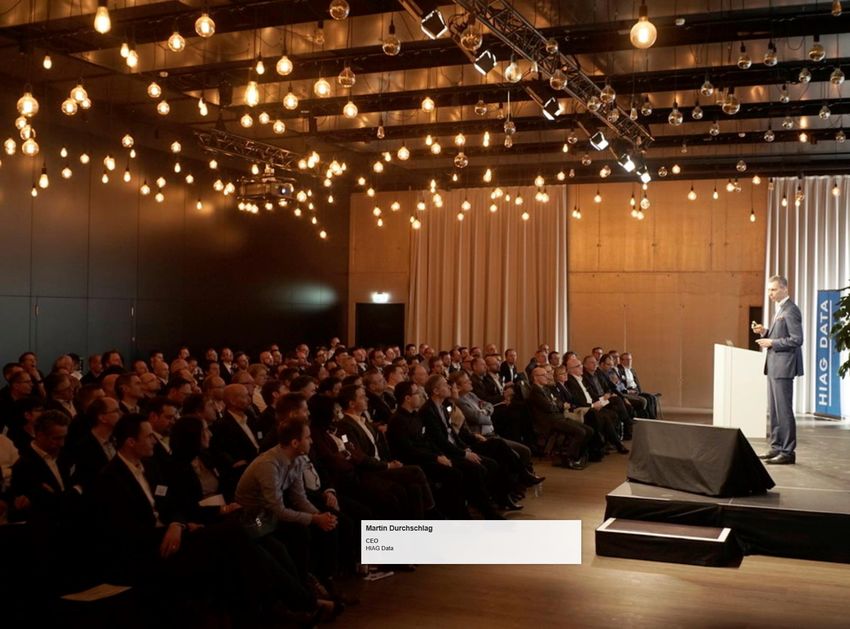
HIAG Data launch event
HIAG
HIAG Data
Key Elements of Cloud Success

                                    END TO END SLA

                                      Multi Cloud 4.0
       HYBRID CLOUD SUPPORT                                END TO END SECURITY
                                     COMPLIANT

                              PRIVATE CLOUD CONNECTIVITY

HIAG                                                                             7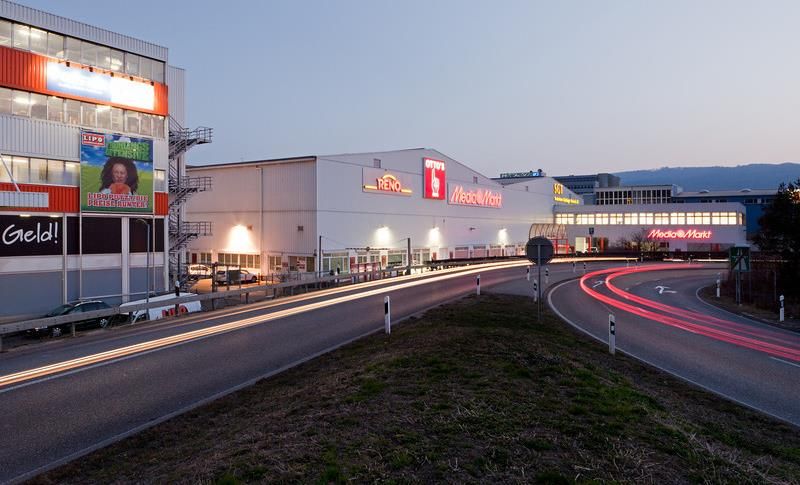
HIAG Data
 Network Centric Multi Cloud 4.0

                                                               AZURE DIRECT

  CUSTOMER SITE
 PRIVATE CONNECT

                                                               O365 DIRECT

                                MULTI CLOUD 4.0
                     •   END TO END PRIVACY
   ON PREMISE /
                     •   READY FOR EDGE COMPUTING
LEGACY INTEGRATION
                     •   GDPR COMPLIANT
                     •   REALTIME CAPABLE (IOT / MEDIA / ..)
                                                                INTERNET

 HIAG                                                                8
HIAG Data
A 100% indirect partner model

              National- & Global-Customers

       ISV   CSP      MSP        SaaS        …..

                   HIAG Data CIS 4.0

HIAG                                               9
HIAG Data – Our Mission We want to empower infrastructure for cloud native business models. We bring the cloud to within the companies walls, as if it was in the basement. We help transform the CSPs customers existing environment into a true end to end cloud experience. HIAG 10
HIAG Data
Cloud Business Services - Roadmap

  VM Backup as a
 Service & VEEAM
   Backup SaaS      Shielded VM’s          GPU supported VM    Container World

                   Microsoft Elastic
                    SQL DB PaaS                                Enhanced Partner
                                                               Service Catalog to
                                                              support PaaS/SaaS
                                             Cloud Service
                                             Orchestrator

       Q2/2018                         Q3/2018                         Q4/2018

HIAG                                                                                11
Stable and attractive mix of uses with
only little exposure to office markets
Others
5.2%
Building land
9.7% Industry,
Commercial
30.0%
Office
11.7%
Industry, Commercial and
Distribution, Logistics
40.3%
Retail
13.0% Distribution,
Logistics
10.3%
Residential / Residential
Commercial 4.8% 15.5%
Residential 20.3%
Based on GAV as of 31.12.2017
HIAG 12A strong, stable and diversified tenant base Top 10 tenants (Group) based on annualised property income as of 31.12.2017 Tenants and credit rating Share of annualised rental Cumulative share of (Moody’s, S&P) income: annualised rental income: Doka Schweiz AG, industry 4.3% 4.3% ABB Group, industry (A2/A) 4.3% 8.6% Sieber Transport AG, logistics 4.0% 12.6% OTTO’s AG, retail 3.3% 15.9% Jeld-Wen Schweiz, industry 3.0% 18.9% BRUGG Rohrsysteme, industry 2.9% 21.8% Athleticum Sportmarkets AG, retail 2.8% 24.6% Planzer Transport AG, logistics 2.8% 27.4% Hewlett Packard Enterprise (HPE), IT 2.8% 30.2% HP International (HP), IT 2.7% 32.9% Residential households* 17.2% 50.1% * includes residential/commercial properties HIAG 13
Increase in weighted average lease term
to 7.9 years
Expiry profile

                                                                                                     38.0%
                                                                       Letting to residential
                                                                       tenants and in redeve-
                                                                       lopment segment

                                                                                          25.0%

                                                           Incl. Stadler, BRUGG
                                                           Rohrsysteme, Dachser,
                                                           HPE, HP Inc., Media
  13.0%
                                                           Markt, Jeld-Wen…

                                                  7.0%
                  5.0%            5.0%                         4.0%         3.0%

  2018            2019            2020             2021         2022        2023        2024-2080   Perpetual*

Expiry profile based on property income as of 31.12.2017

HIAG                                                                                                         14
Robust project pipeline – upcoming projects
with expected investment of CHFm 139
2018 2019 2020 2021 2022 2023 2024- Effective Expected
construction
2026 area to be investment
developed: volume:
Under
1 Commercial
15’000 m² CHFm 46
2 Residential
1 Commercial
(next 3-years)
1 Commercial
Upcoming
2 Commercial
2 Residential, Commercial
33’000 m² CHFm 139
1 Residential
1 Residential & Commercial
6 Residential, Commercial
3 Residential, Commercial
Total area of
603’000 m² to
5 Residential, Commercial
be developed
4 Residential, Commercial
Long term
with an expected
5 Commercial
investment
Other
5 Residential, Commercial volume of
3 Residential, Commercial CHFbn 1.7
6 Commercial, Residential 555‘000 m²
48 projects 603‘000 m² CHFbn 1.7*
Timelines based on currently expected project timelines. Investment volume subject to assumptions on future developments
HIAG 15Agenda 1. Highlights 2. Financial Results Year-End 2017 3. Major developments 4. Market and outlook 5. Financial calendar HIAG 16
Income statement as of 31.12.2017 in CHFm 31.12.2017 31.12.2016 CHFm % Property income 55.8 52.4 +3.4 +6.5% Revaluations of properties 33.3 20.0 +13.3 Total operating income without revaluations 67.0 53.8 +13.1 +24.7% Total operating expenses -27.1 -17.8 -9.4 +52.7% EBITDA 73.1 56.0 +17.1 +30.5% EBT 66.6 50.7 +15.9 +31.4% EBT without revaluations 33.3 30.7 +2.6 +8.4% Net income 57.5 46.4 +11.1 +23.9% EPRA Earnings 33.1 30.5 +2.5 +8.2% Cash Flow from operating activities incl. sales promotion 62.1 72.3 -10.2 HIAG 17
Increase of annualised property income by CHFm 2.0 (+3.6%) in CHFm 31.12.2015 31.12.2016 31.12.2017 CHFm % Target annualised property income 61.0 63.9 65.4 +1.5 +2.4% Actual annualised property income 51.4 54.2 56.1 +2.0 +3.6% Actual property income 51.2 52.4 55.8 +3.4 +6.5% Like-for-Like increase in annualised property income by CHFm 1.3 (2.4%) HIAG 18
Further decrease of vacancy rate
to 14.3%
in % 31.12.2017 31.12.2016
Yielding properties 12.3% 11.7%
Yielding properties undergoing repositioning* 36.8% 32.5%
Redevelopment properties 13.1% 15.2%
Total Portfolio 14.3% 15.3%
The property Lorzenparkstrasse 2-16 ZG has been newly classified as a yielding property
in the reporting period (12.0% as of 31.12.2017, 32.7% as of 31.12.2016)
Like for like vacancy rate (without acquisiton of Meyrin site)
Yielding Portfolio: 12.4%
Total Portfolio: 14.4%
* Mandachstrasse 50-56 (Niederhasli), Sternenfeldpark 14 (Birsfelden) as of 31.12.2017
HIAG 19Revaluation of properties above expectations …. in CHFm 31.12.2017 31.12.2016 Revaluations of properties +33.3 +20.0 Thereof revaluation promotion -2.2 +2.4 Thereof adjustment costs for environmental risks -0.2 -0.0 Positive contributions: Cham, Kleindöttingen, Meyrin, St. Margrethen and Wetzikon Negative contributions: Baar and Menziken HIAG 20
… with a slightly lower discount rate
8.00%
7.00% 7.00% 7.00% 7.00%
7.00%
Decrease in yielding
6.30% 6.30% portfolio driven by
6.00% new rental
Lowest agreements and
discount
5.00% 4.88% 4.78% rate
rental agreement
4.73%
4.44% 4.44% 4.33% renewals
Weighted avg.
4.00%
4.00%
discount Promotion projects
3.90% rate
3.00% discounted at 2.0%,
Highest
discount
«promotion» effect
2.00% 2.50% 2.50% rate will disappear after
2.25%
2.00% units are sold
1.00%
–
2012* 2013** 2014** 2015** 2016** 2017**
31.12.2017 31.12.2016
Weighted average real discount rate yielding portfolio** 4.31% 4.55%
Weighted average real discount rate redevelopment portfolio** 4.41% 4.14%
Weighted average real discount rate total portfolio** 4.33% 4.44%
* except land and building rights incl. power plant
** except land, building rights and power plant
HIAG 21Increase in operating expenses due to
segment IaaS and one time effects
in CHFm 31.12.2017 31.12.2016 CHFm %
Personnel expenses 9.3 5.6 +3.7
Maintenance and repairs 5.9 3.6 +2.3
Insurance and fees 1.0 0.9 +0.1
Energy costs and building maintenance 2.1 2.4 -0.3
Rent and leases 1.6 1.5 +0.1
Other expenses 7.2 3.8 +3.5
Total operating expenses 27.1 17.8 +9.3 +52.6%
from which segment IaaS 4.1 1.2 +2.9
from which external services related to asset sales 0.7 - +0.7
Total operating expenses excl. segment IaaS &
22.3 16.5 +5.8 +35.1%
asset sales
HIAG 22Real estate operating expenses impacted
by one time effects
in CHFm 31.12.2017 31.12.2016 CHFm %
Personnel expenses 8.0 5.0 +3.0 +59.1%
Maintenance and repairs 4.2 3.6 +0.7 +18.8%
Insurance and fees 1.0 0.9 +0.0 +5.0%
Energy costs and building maintenance 2.1 2.4 -0.3 -11.8%
Rent and leases 1.4 1.3 +0.1 +7.9%
Other expenses 6.3 3.3 +3.0 +91.0%
Total operating expenses 23.0 16.5 +6.5 +39.2%
from which external services related to asset sales 0.7 - +0.7
Total operating expenses excl. external
22.3 16.5 +5.8 +35.1%
services related to asset sales
HIAG 23Key financial figures per share
in CHF 31.12.2017 31.12.2016
Earnings per share 7.2 5.8
Earnings per share without revaluation 3.0 3.3
Earnings per share without revaluation, non cash taxes and segment IaaS 4.6 4.7
EPRA Earnings per share 4.1 3.8
Time-weighted average number of shares 8’035’289 8’000’787
Swiss GAAP FER NAV per share 94.5 90.7
EPRA NAV per share 103.7 99.2
Number of outstanding shares 8’047’629 8’035’885
Planned dividend payout (cash distribution out of capital contribution)* 3.8 3.6
Payout ratio in %** 82% 77%
Cash yield in %*** 3.1% 3.4%
* Proposition to the annual General Meeting on 19 April 2018 for the business year 2017: cash distribution out of
capital contribution reserves
**
HIAG
Distribution per share in relation to earnings without revaluation, non cash taxes and segment IaaS 24
*** Distribution per share in relation to share price at end of periodBalance sheet as of 31 December 2017 in CHFm 31.12.2017 31.12.2016 CHFm % Properties 1’251.6 1’176.3 Properties held for sale 31.1 66.0 GAV 1’282.7 1’242.3 +40.4 +3.3% LTV Ratio 37.6% 36.2% Swiss GAAP FER NAV 760.7 729.1 Swiss GAAP FER NAV per share* 94.5 90.7 Capital contribution reserves 47.7 75.5 -27.8 Equity ratio 54.4% 54.7% Return on Equity 7.9% 6.6% EPRA NAV 834.1 797.3 EPRA NAV per share* 103.7 99.2 * Number of outstanding shares 8’047’629 as of 31.12.2017 and 8’035’885 as of 31.12.2016 HIAG 25
Further increase in the financing duration
in CHFm 31.12.2017 31.12.2016
Bank financing 155.7 297.7
Bonds (CS rating: Low BBB stable / Vontobel rating: BBB stable) 365.0 215.0
Leasing financing 8.4 -
Total 529.1 512.7
Bonds represent 69% of financing structure (42% as of 31.12.2016)
New leasing financing related to HIAG Data equipment
Current LTV ratio of 37.6% (36.2% as of 31.12.2016)
Target LTV ratio unchanged of below 50%
Increase of the duration (from 3.1 years to 3.6 years)
Interest coverage ratio of 8.3x (7.4x as of 31.12.2016)
Average cost of debt of 1.0% (1.1% as of 31.12.2016)
Bond of CHFm 150 with a coupon of 0.8% and a maturity of 5 years issued in May 2017.
The proceeds where primarily used for the repayment of bank financing.
HIAG 26Steady increase of NAV, dividend and
share price since IPO
128.00
120
110
100
90
80
75.40
2015 2016 2017 2018
HIAG 27Agenda 1. Highlights 2. Financial results Year-End 2017 3. Major developments 4. Market and outlook 5. Financial calendar HIAG 28
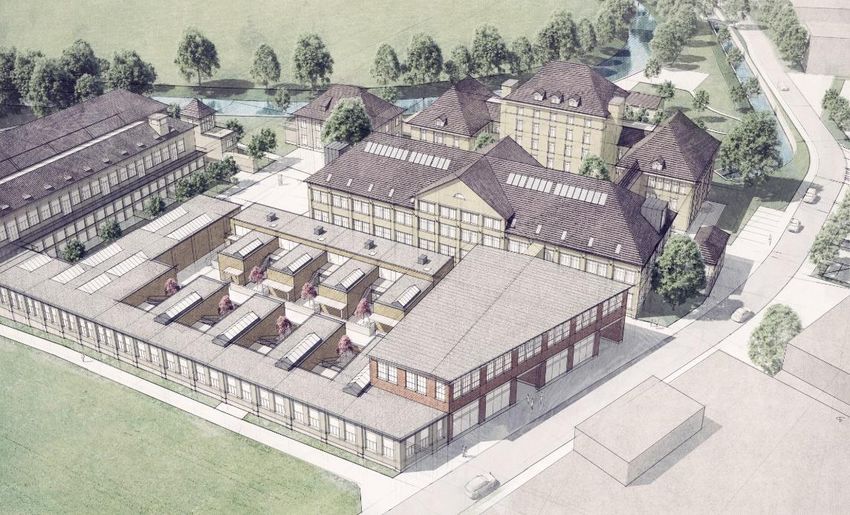
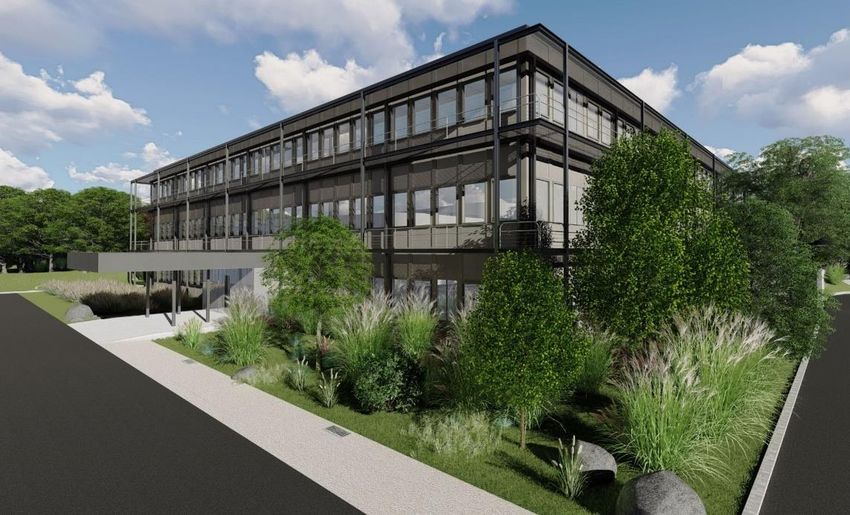
Frauenfeld «Walzmühle»
Building new villages
Under construction
•      First construction phase started in July 2017, comprising 8 loft houses and 10 loft
       apartments as well as 2’300 m2 office and commercial space (www.walzmuehle.ch)
•      Total expected investment volume of first stage amounting to roughly CHFm 25

HIAG                                                                                    29
Niederhasli
Strengthening the Swiss Industry
Under redevelopment
• Long term lease agreement with Doka Schweiz for a new development giving
space for development of about 300 apartments around railway station
• Office building of 2‘600 m 2 and commercial halls of 4‘200 m 2 to be developed
• Planning zone repealed, building permit granted, start of construction in 2018
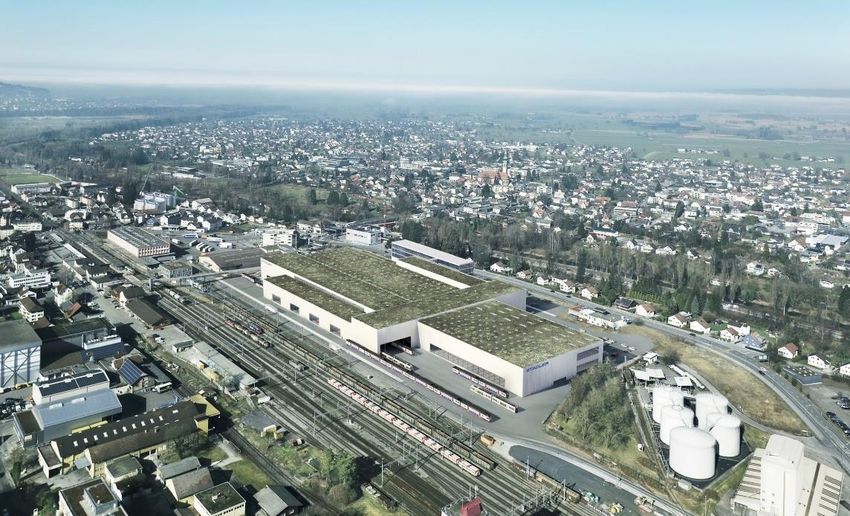
HIAG 30St. Margrethen
Focusing on long-term collaborations
Under redevelopment
• Building lease for about 70’000 m 2 signed by Stadler Rail in April 2017 with
contractual period until 2080
• Groundbreaking ceremony scheduled for 24 April 2018
HIAG 31Dietikon
Retailing at good locations will remain
Yielding / under redevelopment
• 10-year extension of rental agreement with Media Markt for 5’500 m2
• 15-year rental agreement signed with an international renowned retail company for
a total space of 20’000 m 2 to become the largest tenant in HIAG’s portfolio
HIAG 32Biberist «Papieri»
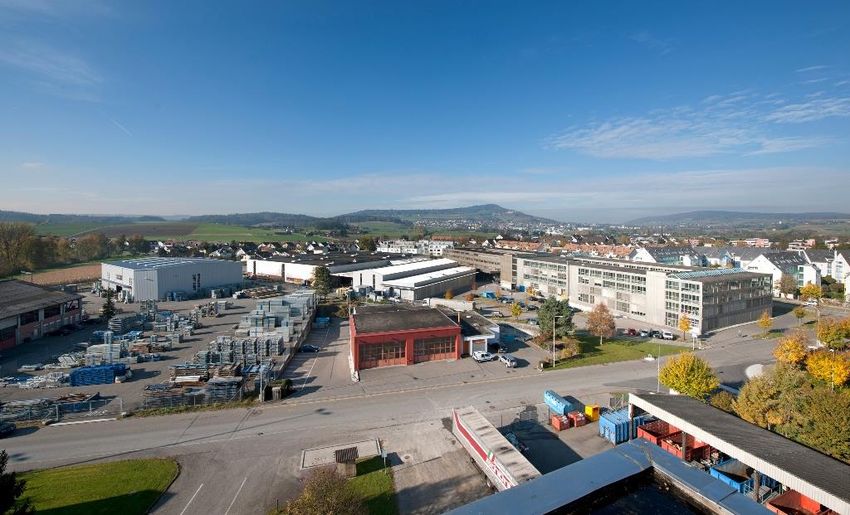
Setting the stage for new opportunities
Yielding/under construction/under redevelopment
• Dismantling of PM 9 to be completed in summer 2018
• Sale agreements for PM 6 and PM 8 signed, dismantling finished by early 2019
• HIAG Data operational headquarter and testing DC operational, construction for
dark-site-DC ‘Walzenhalle’ planned to start in 2018
HIAG 33Meyrin «The Hive»
Creating clusters
Completion / Under refurbishment
• In Q2 2017, new building for HPE/HP Inc. completed below budget and delivered
ahead of schedule
• Refurbishment of ‘Hive 1’ initiated and new rental agreement signed with Regus
• Ongoing negotiations about ‘Hive 3’ and planning of a cooking school / restaurant
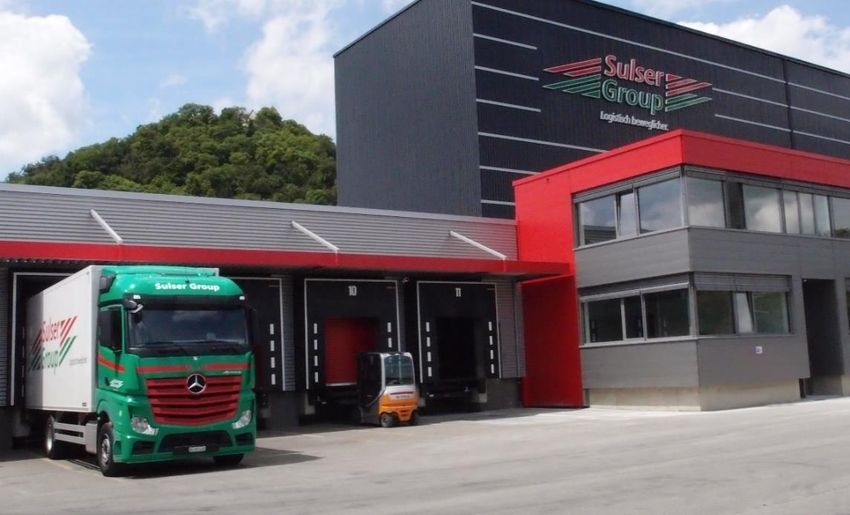
HIAG 34Brunegg
Identifiying valuable locations
New acquisition
• Sale-lease back transaction with Sulser Logistik AG comprising an area of total
28’000 m2
• Land reserve of 5’000 m2 adding to existing logistic space and high-rack
warehouse to be developed in 2018
HIAG 35Agenda 1. Highlights 2. Financial results Year-End 2016 3. Major developments 4. Market and outlook 5. Financial calendar HIAG 36
Market Positive economic outlook supporting long term investment decisions Interest rate environment not expected to change fundamentally. Expectations on possible increase still have no impact on transaction prices Initiatives to increase productivity in construction processes by means of new technology start to show first effects Open ecosystems to speed up transformation to cloud solutions HIAG 37
Outlook Property income expected to increase slightly about 1% HIAG is continuously evaluating opportunities but not willing to dilute portfolio yield Revenue contribution of HIAG Data for 2018 to increase sharply following the launch of ‘Network Centric Multicloud 4.0’ HIAG Data EBITDA contribution to approach breakeven in 2018 Unchanged dividend payout policy of 4% of NAV HIAG 38
Agenda

1.     Highlights
2.     Financial results Year-End 2017
3.     Major developments
4.     Market and outlook
5.     Financial calendar

HIAG                                     39
Financial calendar
19 April 2018       Annual General Meeting in Windisch
3 September 2018    Publication half-year results 2018

investor.relations@hiag.com
www.hiag.com

HIAG                                                     40
Appendix

HIAG       41
Portfolio key figures
in CHFm                              31.12.2017   31.12.2016

Portfolio                                 1’283        1’242

Yielding Portfolio                         901          756

Redevelopment Portfolio                    381          487

Annualised property income                 56.1         54.2

Number of properties                       111          112

Number of redevelopment properties          44           50

Number of projects                          48           50

Vacancy rate                             14.3%        15.3%

HIAG                                                      42
Portfolio split by type of use and region

                             Other
                                                                                      Other
                             3.4%
                                                                                      8.4%
           Building land                                               Baselland
                   9.7%                            Industry,             6.7%
                                                   commercial
                                                   30.2%                                          Aargau
                                                                                                  27.3%
       Office
       11.7%
                                                                   Solothurn
                                                                     8.7%

         Retail
        13.0%                                                         Geneva
                                                                      12.5%
                                                   Distribution,
                                                   Logistics
                                                   10.3%                                      Zurich
                                                                                              26.5%
           Residential and
              commercial             Residential                                    Zug
                     5.2%            14.7%                                         9.3%

GAV as of 31.12.2017

HIAG                                                                                                       43
Yielding Portfolio – Overview
Description Top 5 yielding sites
• HIAG’s Yielding Portfolio includes the properties for
which currently no redevelopment is planned and which Klein-
(in CHFm) Dietikon döttingen Klingnau Niederhasli Meyrin
are intended to generate a stable and predictable
income
• HIAG’s Yielding Portfolio includes 68 properties located
Value 126.2 91.4 79.7 77.8 76.4
on 26 sites accounting for a GAV of CHFm 901, 70% of
total GAV 50% of total Yielding Portfolio
• The annualised rental income of the Yielding Portfolio
amounted to CHFm 47.1 as of 31 December 2017
Net yield 5.1% 4.2% 4.9% 5.6% 4.5%
Rental income by main use
Lettable
Others 38'097 64'714 45'844 31'678 17’679
area in m²
6% Residential
Office 18%
13%
Annualised Annualised
rental property rent 6.5 3.8 3.9 4.3 3.4
Logistics income 2017: in CHFm
18% CHFm 47.1 Industrial
26%
Retail Occupancy
95.3% 64.6% 80.0% 79.9% 99.0%
19% rate
HIAG 44Redevelopment Portfolio – Overview
Portfolio segmentation Selected redevelopment sites
Under With partial use of existing substance:
Marketing construction Mid-term Long-term (in CHFm) Biberist Brugg Neuchâtel
Expected main
On-going On-going 3-5 years 5-10 years Value 48.1 22.6 17.1
redevelopment steps
Net site area
m² to be redeveloped - c. 15’200 c. 33’200 c. 555’100 265’069 44’585 11’397
(m²)
Annualised
Number of properties 3 3 7 32 1.2 1.7 0.8
property rent
Number of projects 3 3 8 37 Net yield 2.5% 7.5% 4.8%
Without use of existing substance:
Wetzikon Hausen-
(in CHFm) Cham Dornach Lancy Meyrin
Rental income by main use (Schönau) Lupfig
Logistics 6%
Others 5% Value 43.5 32.1 30.5 18.0 16.8 23.7
Net site area
Residential & 26’236 136’685 25’322 8’783 62'168 28’464
(m²)
Res. Mix. 9%
Industrial
73% CHF / m² 1’659 235 1’204 2’047 270 833
Office Annualised
7% rental Annualised
income 2017: property rent - 0.8 0.2 0.6 - -
CHFm 8.4 (CHFm)
Net yield - 2.7% 0.8% 3.3% - -
HIAG 45Condominium sales
Spinnerei III, The Cloud, Feinspinnerei,
Project
Windisch Baar Windisch
Status Marketing Marketing Marketing
Targeted completion of construction Completed Completed Completed
# of condominiums 50 100 29
% of units sold as of 31.12.2017 98% 91% 72%
% of units sold and signed reservations as of 31.12.2017 98% 93% 79%
% of units sold as of 28.02.2018 98% 93% 76%
% of units sold and signed reservations as of 28.02.2018 98% 94% 79%
HIAG 46Continuous portfolio growth
33
14
24 20 44
63
(51)
(28)
1'242 1'283
1'224
729 761
709
2016 2017
NAV GAV Sale Acquisitions NAV GAV Sale Acquisitions NAV GAV
Investments Revaluation Investments Revaluation
in CHFm
NAV defined as shareholders’ equity per Swiss GAAP FER
HIAG 47Solid credit metrics and capital structure in CHFm 31.12.2017 31.12.2016 GAV 1’282.7 1’242.3 Cash & cash equivalents 38.9 52.4 Gross financial debt 529.1 502.3 Thereof bonds 365.0 215.0 EBITDA before revaluation of properties 39.9 36.1 Net financial result -4.8 -4.9 LTV ratio 37.6% 36.2% Interest coverage ratio* 8.3x 7.4x Duration (in years)** 3.6 3.1 Average interest rate 1.0% 1.1% Fixed interest rate over 1 year*** 82% 65% * EBITDA before revaluation of properties / net financial result ** Weighted average duration *** Excl. building credit and short term bank debt HIAG 48
Cash flow
in CHFm                                                     31.12.2017   31.12.2016
Cash Flow from operating activities incl. sales promotion       +62.1        +72.3

Cash Flow from Investments                                       -65.3        -38.5

Cash Flow from Financing                                         -20.6        -23.4

HIAG                                                                             49
EPRA key financial figures
in CHFm except figures per share in CHF                                             31.12.2017   31.12.2016
EPRA Earnings                                                                             33.1         30.5

EPRA Earnings per share (CHF)                                                              4.1          3.8

Average number of shares                                                             8’035’289    8’000’787

EPRA NAV                                                                                834.1        797.3

EPRA NNAV                                                                               760.4        729.6

EPRA NAV per share (CHF)                                                                103.7          99.2

Number of outstanding shares (diluted)                                               8’047’629    8’035’885

EPRA vacancy rate (yielding portfolio)                                                  14.3%        15.3%

Adjusted EPRA vacancy rate (yielding portfolio excl. properties in repositioning)       12.3%        11.7%

HIAG                                                                                                     50
Reconciliation Swiss GAAP FER - EPRA
in CHFm                                   31.12.2017   31.12.2016
Swiss GAAP FER NAV                            729.1        708.7

Effect Incentive Plan / Treasury shares         +0.5         -0.0

Deferred Tax Liabilities                      +67.6        +63.2

EPRA NAV                                      797.3        771.9

Swiss GAAP FER Earnings                         57.5         46.4

Revaluation of properties                      -33.3        -20.0

Deferred Tax / Tax losses carry forward         +8.9         +3.9

Other                                              -         +0.2

EPRA Earnings                                   33.1         30.5

HIAG                                                           51
Strong NAV growth

                               2016                         2017

in CHFm
NAV defined as shareholders’ equity as per Swiss GAAP FER
HIAG                                                               52
2017 Share price performance Share price in CHF 2017 High 128.0 Low 104.4 End of period 120.9 Market capitalisation in CHFm 2017 End of period 973.3 Issued shares 2017 End of period 8’050’000 HIAG 53
Shareholder structure as of 31.12.2017
                                                          Other
                                                          6.4%

                              Other Switzerland
                                   25.4%

                               Free float                                    SFAG Holding AG
                                 34.7%                                           49.8%

                               Management
                                    3.6%
                         Salome Grisard Varnholt                           Anchor shareholders
                                 3.5%                                            65.3%
                                       Andrea Grisard
                                           4.8%
                                                   Dr. Felix Grisard
                                                        7.2%
Major shareholders                                                         31.12.2017
SFAG Holding AG*                                                               49.8%
Dr. Felix Grisard                                                                7.2%            Anchor shareholders:
Andrea Grisard                                                                   4.8%                   65.3%

Salome Grisard Varnholt                                                          3.5%
Management                                                                       3.6%
                                                                                                      Free Float:
Other Switzerland                                                              24.4%
                                                                                                        34.7%
Other                                                                            6.7%
Total                                                                         100.0%
* Owned by Salome Grisard Varnholt, Dr. Felix Grisard and Andrea Grisard

HIAG                                                                                                                    54
You can also read