Analyst Meeting Results of the Six Months ended September 30, 2019 - AUTOBACS SEVEN CO., LTD.
←
→
Page content transcription
If your browser does not render page correctly, please read the page content below
Translation

    Analyst Meeting

Results of the Six Months
ended September 30, 2019

      October 31, 2019

AUTOBACS SEVEN CO., LTD.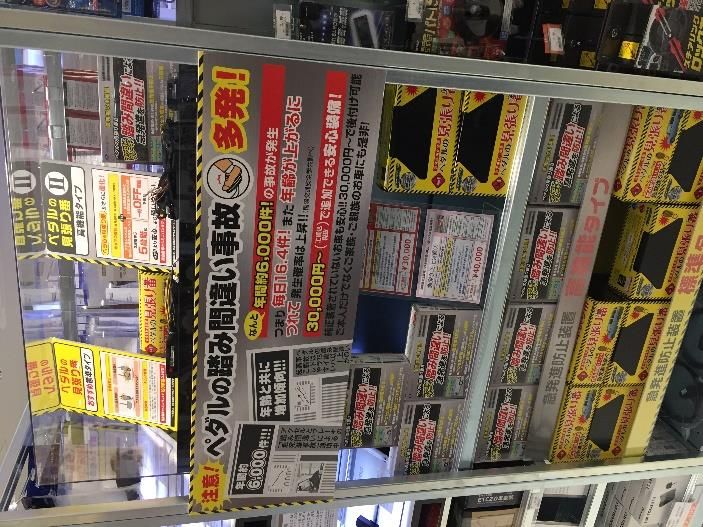
Results of the Six Months
        ended September 30, 2019
                    and
Forecasts for Second Half of FY March 2020

                     Officer,
       Finance & Accounting, Legal and IR & PR

              Noritaka Hiraga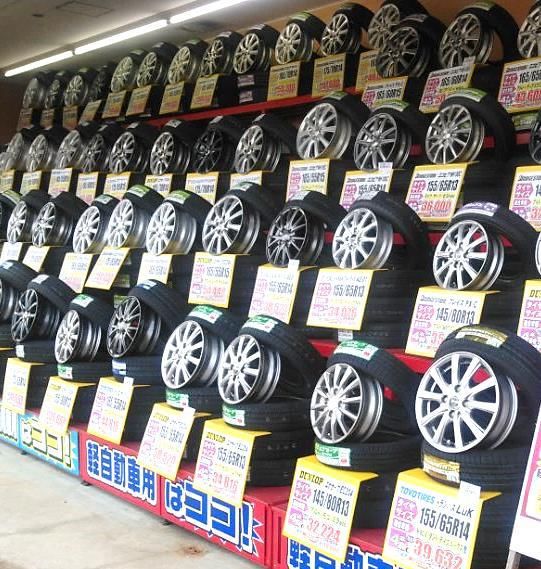
First Half of FY March 2020 Consolidated P/L
                                                                                                       (Billion Yen)
                                     Six months ended September 30, 2019                         Six months
                                                                                                   ended
                           Initial         Actual          YoY change         Change from       September 30,
                          Forecast         results            ratio             forecast
                                                                                                    2018
Net sales                  105.0             111.0          +13.8%                   +6.0                  97.5
Gross margin                 33.6              35.5         +15.3%                   +1.9                  30.7
Gross margin ratio          32.0%             32.0%              +0.4pt             ±0.0pt                31.6%
SG&A                         31.6              31.0             +6.1%                 -0.5                 29.2
Operating income               2.0               4.4       +194.8%                   +2.4                    1.5
Operating income ratio       1.9%               4.0%             +2.5pt             +2.1pt                  1.5%
 Non-operating income          1.0               1.1             -0.2%               +0.1                    1.1
 Non-operating expenses        0.8               0.9          +10.9%                 +0.1                    0.8
Ordinary income                2.2               4.6      +153.9%                    +2.4                    1.8
 Extraordinary gains                 -           0.0            -4.3%                +0.0                    0.0
 Extraordinary losses                -           0.4         -50.5%                  +0.4                    0.9
Net income                     1.4               2.8       +375.5%                   +1.4                    0.5
                                                       Amounts are rounded down to the nearest hundred million yen.

                                                                                                                       1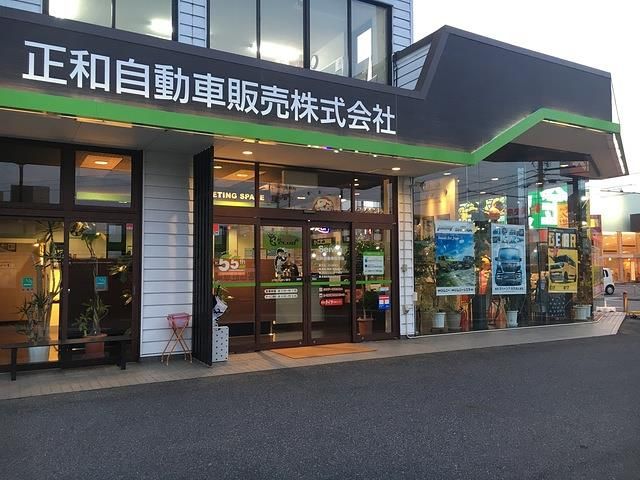
Key Figures for the First Half of FY March 2020

    Net sales                   YoY         +13.8%
      Domestic AUTOBACS                             AUTOBACS SEVEN
                                 YoY    +11.2%/ Wholesale     +12.3%
          chain retail sales

                       Gross Margin Ratio            LY
    Gross Margin          32.0%             ← 31.6%
    SG&A                   YoY     +1.77 BY
            New consolidated            +0.9 BY
                                  YoY
                subsidiary

                                               LY
   Operating Income       4.44 BY ← 1.5 BY
      Operating Income
           Ratio
                          4.0%    ← 1.5%
                                                                       2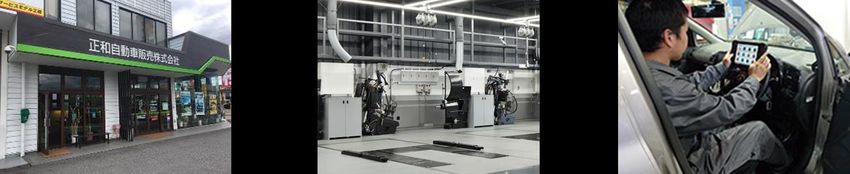
Key points for the First Half of FY March 2020
✓ Sales of tires increased significantly, partially because of the
rush in demand caused by the consumption tax hike and the
announcement of a price rise from October.
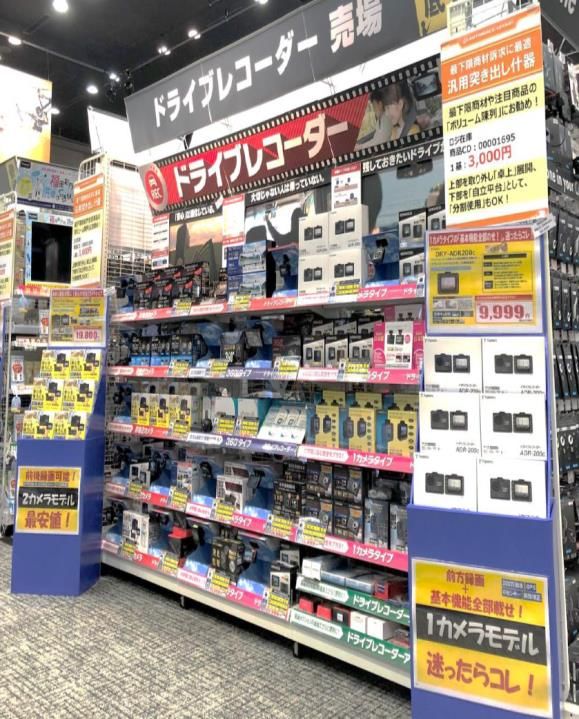
✓ Responding to press reports on tailgating incidents, sales of
car electronics increased backed by the increased interest of
customers in dashcams.
✓ Although advertising expenses such as TV commercials for
tires and statutory safety inspections increased, the total
SG&A remained within the planned amount.
✓ In the overseas business, the operating loss shrank due to the
enhancement of wholesale in addition to retailing.
✓ In the BtoB business, the revenues from wholesale business
subsidiaries, which were reorganized during the previous term,
were improved.
3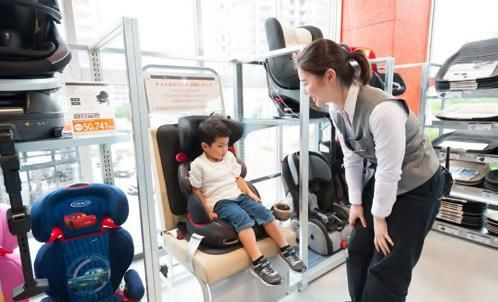
Sales and profits by Reporting Segments
                                Sales                                                   Profits
(Million     Yen)                                          (Million   Yen)
100,000                                                  8,000
                       91,035                                             7,735
                                                                                                       H1 FY2019
             81,021                                               5,394
                                                         6,000
 80,000                                                                                                H1 FY2020

                                                         4,000
 60,000
                                                         2,000
                                                                                                      255 235
 40,000
                                                              0
                                                                                 -210          -121
                                         18,045                           -357          -786
 20,000                             14,357              -2,000
                           6,042
                        5,374                                                                             -2,997 -3,190
                                             1,120 1,074 -4,000
         0

Round down to the million Yen
Before elimination of transaction                  ※ Corporate expenses not allocated to each reporting segment,
between segments                                   mainly general and administrative expenses                             4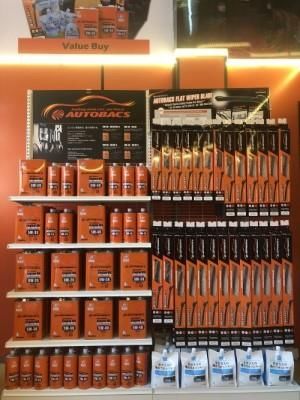
Segment Information
                                                                                            (Million Yen)
                                    Six months     Six months ended
                                 ended September    September 30,      YoY                  Summary
                                     30, 2019            2018

              Sales                     91,035             81,021     +12.4%     Sales and gross margin
                                                                                 increased due to strong sales of
Domestic      Gross margin              28,777             25,063     +14.8%     tires and dashcams. SG&A
AUTOBACS                                                                         expenses increased because of
Business      SG&A                      21,042             19,668     +7.0%      the conversion of FC stores into
                                                                                 subsidiaries, but profit
              Operating income           7,735              5,394     +43.4%     increased significantly.

              Sales                      6,042              5,374     +12.4%     Due to making a wholesale
                                                                                 company in Australia into a
Overseas      Gross margin               2,735              2,700     +1.3%      subsidiary in October LY,
                                                                                 opening a new store in Thailand,
Business      SG&A                       2,946              3,057      -3.6%     and increasing wholesale sales
                                                                                 in China, sales grew and
              Operating income            -210               -357            -   operating loss shrank.

Imported
              Sales                     18,045             14,357     +25.7%     Operating loss shrank
                                                                                 significantly because of
Car dealer,   Gross margin               3,611              2,657     +35.9%     increased sales in the dealer
BtoB and                                                                         business, as well as the
Internet      SG&A                       3,733              3,443     +8.4%      improved profitability of a
Business                                                                         wholesale subsidiary in the
              Operating income            -121               -786            -   BtoB business.

              Sales                      1,074              1,120      -4.1%
                                                                                 Although sales declined,
Other         Gross margin                 386                376     +2.6%      operating income equivalent to
Business                                                                         that in the previous term was
              SG&A                         151                121     +24.7%     secured.
              Operating income             235                255      -7.9%
              Operating
Adjustment                              -3,190             -2,997            -
              income                                                                                                5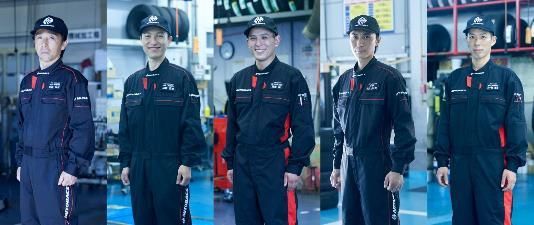
Domestic AUTOBACS Business
   Retail revenue improvement
   ・ Expanded sales of Safety and Security merchandise

        Tires and wheels       Dashcams           Pedal Watcher

   ・ Converted franchisees into company-owned units
     7 stores at Gifu, Nagano and Aichi prefecture(March 1, 2019)
     8 stores at Kumamoto prefecture(November 1, 2019)
                                                                  6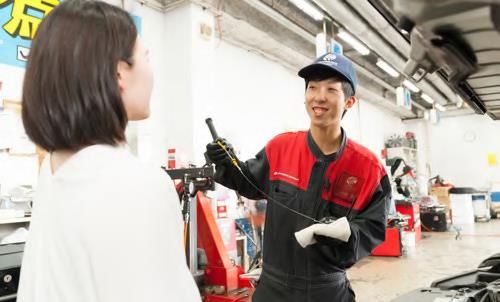
Domestic AUTOBACS Business
  Revitalization of existing stores and development of
  new store format
Before                    After

 Store renovation(59 stores finished in 1st half)      JACK & MARIE Grandberrypark
                                                       (Opening on Nov. 13, 2019)

    Development of human resources

               AUTOBACS GUYS 2019              AUTOBACS chain joint welcome ceremony 7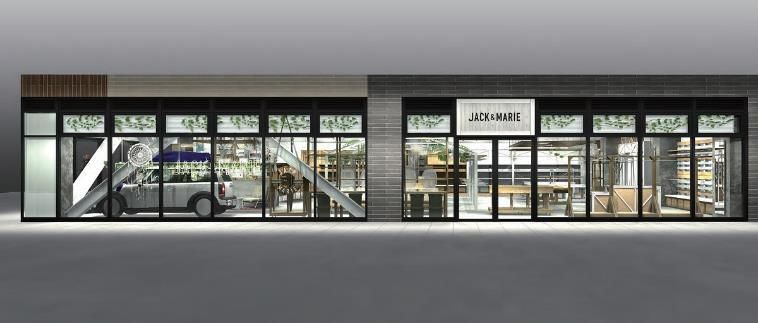
Overseas Business
 ・ Strengthened wholesale of private brand products
 for overseas

                                                      8
Car Dealer, BtoB and Internet Business
Car Dealer Business
・A subsidiary that supervises the car dealer business was
established, which enhanced the sales operations at each base.
The enhancement of services, not only new car and used car
sales, was promoted.
BtoB Business
・Profit was improved due to the optimization of sales activities
at the wholesale subsidiaries, which were reorganized during
the previous term. In addition, sales of dashcams, etc.
increased in the fleet business.
Internet Business
・The merchandise lineup and promotions were renewed while
preparations were made for updating the Group’s website.
9Retail Sales in Total AUTOBACS Group Stores
Retail Sales Including FCs: 134.1 billion yen (+11.2% YoY)
(Billion Yen)
160
120.5 134.1
140 Second hand goods & Fuel: 2.3BY (-10.6% YoY)
2.3
10.0 Statutory safety inspection: 10.0BY (+7.4% YoY)
120 2.6
14.9 Number of cars inspected: 322,000cars (+7.9% YoY)
9.3
Number of fully certified & designated stores: 424 stores
100 13.3 (421 stores at March 31, 2019)
80 Car purchase & sales: 14.9BY (+12.2% YoY)
Number of cars sold: 16,374 cars (+13.2% YoY)
60 Number of fully certified & designated stores: 400 stores
106.8
95.1 (401 stores at March 31, 2019)
40
Car related goods & services:
20 106.8BY (+12.2% YoY)
• Sales at all domestic store formats
0 (Excluding “AUTOBACS Car Purchase Specialty Store”)
H1 FY2018 H1 FY2019
10Sales Trend: Retail & Wholesale (Oct. 2018 – Sep. 2019)
【YoY change for the last 12 months】
50% 46.9%
Sales Wholesale
40% 41.7%
30%
Increased wholesale 24.0%
Strong sales of winter items due to advance
20% due to the cold wave delivery for GW
products
11.0%
10.3% 9.5%
10% 9.0% 6.0%
4.7% 4.4% 11.1%
2.0% 3.4%
0%
0.2% 2.6% 3.9% 4.3% 3.0%
0.3% -2.9%
-5.5%
-4.6%
-10% Decreased sales of
winter items as a
-10.0% reaction to the cold
wave last January -15.4%
-20%
Oct Nov Dec Jan Feb Mar Apr May Jun July Aug Sep
2019
• Retail sales at all domestic store formats (AUTOBACS, Super AUTOBACS, AUTOBACS
CARS, AUTOBACS Secohan Ichiba and AUTOBACS EXPRESS)
• Wholesale from AUTOBACS SEVEN to all domestic AUTOBACS stores 11Total Number of Purchasing Customer and
Average Purchasing Price Per Customer
【YoY change for the last 12 months】
30.0% 27.7%
Total Number of Purchasing Customer
25.0% Average Purchase Price Per Customer
20.0%
15.0% 10.6%
11.2%
10.0% 8.8% 7.1%
7.3%
4.8%
5.0%
4.0% 3.7% 4.1%
1.7%
0.5% -4.3% 0.0% 3.3%
0.0%
1.3%
-0.3% 0.8% 0.5%
-5.0% -2.3% -2.1%
-6.1%
-6.2% -7.5%
-10.0%
-15.0%
-20.0%
Oct Nov Dec Jan Feb Mar Apr May Jun Jul Aug Sep
2018 2019
* Sales at all domestic store formats (AUTOBACS, Super AUTOBACS,
AUTOBACS CARS, AUTOBACS Secohan Ichiba and AUTOBACS EXPRESS) 12Sales Variance by Merchandise (H1 FY2020)
Sales* changes by merchandise category
(Million Yen)
(YoY change in amount; total store basis)
5,000
4,340 Summer tires: +2,610 MY
Winter tires: +1,430 MY
4,000 3,667
Car Navitgation devices: -120 MY
Dashcams: +3,050 MY
3,000
Electronic devices installation services: +1,330 MY
1,889 Tire & wheel installation services : +440 MY
2,000
Motor Sports
Motorcycle
1,000 581
Goods
Goods
372 327 291
135 101 68
0
-57
Oil
Wheels
Parts
Car Repair
Batteries
Items
Tires
Services
(excl. Inspections/
Maintenance)
Goods
Car Leisure
Maintenance
Accessories
-48
Car Electronics
-1,000
-2,000
* Include sales at domestic AUTOBACS-chain stores including FCs; all store formats (AUTOBACS,
Super AUTOBACS, CARS, AUTOBACS Secohan Ichiba and AUTOBACS EXPRESS)
13Performance Results of Franchisees
(Billion Yen)
Ordinary Income of Franchise Companies (Preliminary)
80
60
40
32.70
20
0 1.80
-1.60
-20 Total of profit-making FCs
-27.40 Total of profit-making subsidiaries
-31.30 Total of loss-making FCs
-40 Total of loss-making subsidiaries
Combined ordinary income of H1
Combined ordinary income of full year
-60
FY March 2016 FY March 2017 FY March 2018 FY March 2019 FY March 2020
*Excluding three listed companies
*Including some FC’s latest estimates
14Performance by Overseas Subsidiaries (Million Yen)
France Thailand Singapore China Malaysia Australia
Number of
11 16 3 0 4 0
stores*
Q2 Q2 Q2 Q2 Q2 Q2 Q2 Q2 Q2 Q2 Q2 Q2
Period
FY2020 FY2019 FY2020 FY2019 FY2020 FY2019 FY2020 FY2019 FY2020 FY2019 FY2020 FY2019
Net sales 3,705 4,172 369 223 661 623 549 251 30 23 692 ╴
SG&A 1,911 2,197 164 143 262 285 99 100 20 34 212 ╴
Operating
24 3 -55 -72 13 7 10 -11 -9 -23 12 ╴
income
Although SG&A
Although
Although sales expenses were
Operating customers
decreased due to generated in
income increased Wholesale sales decreased due to
the transfer of advance in line
due to increased of PB oil, etc. air pollution by In October 2018,
the business with the opening
wholesale mainly increased smoke, AudioXtra PtyLtd.
rights of a store of small stores,
Business of PB substantially for operating loss was made into a
in July, operating operating loss
conditions maintenance China’s domestic narrowed, new subsidiary in
income increased was reduced due
items for market, partially because order to promote
due to reduced to increased
convenience becoming of the local wholesale.
advertising sales. In July,
stores and profitable. restructure
expenses and one store was
hypermarkets. conducted in the
other costs. transferred to
previous term.
the PTG Group.
*including FC stores Amounts are rounded down to the nearest million yen. 15Shareholders Return
Dividends per share Dividends and share buyback
(Yen) (Billion Yen)
Amount of share buyback
80 1st Half 2nd Half 12 Dividend paid
70 10
60
8
50
30 30 30 2.91
40 6 2.08
0.00
30 4
20
30 30 30 2 4.95 4.95 4.78
10
0 0
FY March 2018 FY March 2019 FY March 2020 FY March 2018 FY March 2019 FY March 2020
(E) (E)
16Assumptions for the business environment for the second half
Business environment
[Positive Factors]
- The increased interest of customers in dashcams continued.
- The area applicable to the order to use tire chains was expanded.
- Demand for smartphone-related items increased in line with the tightening of the
regulations on driving while talking on a cell-phone.
[Negative Factors]
- Reaction to the rush in demand caused by the consumption tax hike
- Reaction to the rush in demand caused by the price increase of tires from October
- Demand for statutory safety inspections declined due to the decrease in the number of
cars that need to undergo statutory safety inspections.
Domestic store sales (YoY)
1st half(Results) 2nd half(revised) Full Year(No change)
Same store Total store Same store Total store Same store Total store
sales sales sales sales sales sales
+11.4% +11.2% -6.9% -6.8% +1.3% +1.3%
Sales at all AUTOBACS chain stores
17Estimates of FY March 2020
The results for the first half exceeded the internal plan; however, we are
maintaining the full-year earnings forecasts unchanged, considering the severe
business environment in the second half.
(Billion Yen)
H1 H2 Full Year
Results YoY Forecasts YoY Forecasts YoY
Consolidated Sales 110.0 +13.8% 111.9 -3.7% 223.0 +4.3%
Gross Margin 35.5 +15.3% 35.0 -4.6% 70.6 +4.5%
% 32.0% +0.4pt 31.3% -0.3pt 31.7% +0.1pt
SG&A 31.0 +6.1% 31.5 +2.3% 62.6 +4.2%
Operating Income 4.4 +194.8% 3.5 -40.5% 8.0 +7.0%
% 4.0% +2.5pt 3.2% -2.0pt 3.6% +0.1pt
Recurrent Income 4.6 +153.9% 4.0 -37.0% 8.7 +6.1%
Net Income 2.8 +375.5% 2.9 -37.0% 5.8 +5.7%
ROE ╴ ╴ ╴ 4.7% +0.3pt
Round down to the 10 million Yen
YoY comparisons are calculated in Yen
18Initiatives under the Five-year
Rolling Plan 2019
CEO, President
Kiomi KobayashiFive-year Rolling Plan 2019
■Our mission
We constantly create a new car lifestyle culture.
- We will get closer to people's living, car and society, and offer more
satisfying and value-added services to customers -
■What we aim to achieve in the Five-Year Rolling
Plan
We will establish and link the six networks to
provide services suited to the scenarios in which
customers use cars.
19Six Networks
AUTOBACS
Chain
Next-generation
Pit Service
maintenance
Online
Overseas
Multi-dealer
Alliance
33Six Networks
Network is not a business itself but an infrastructure that connects
customers to our brand
✔ AUTOBACS chain network
✔ Pit service network to provide best service
✔ Maintenance network to adapt to next-
generation technology
AUTOBACS
Chain
✔ Multi-dealer network Next-
generation
Pit Service
maintenanc
✔ Overseas Alliance network e Online
✔ Online network to enhance relationships
Overseas Multi-
with customers Alliance dealer
21AUTOBACS chain network
✓ Build a foundation of Online network
Examples...
AUTOBACS
Customer base of 7 million active members and its Chain
purchasing data, customer's car information, T-card
transaction data and car parts identification data, etc
✓ Targeting partners :
Online
AUTOBACS group stores, other automotive parts
chain, hardware stores, online retailer, and
gas stations, etc
22Pit service network to provide the best Service
✓ Increase the connection point of customers that
purchase items or receive services at other
channels
✓ Increase the access to new customer data base
✓ Targeting partners :
Pit Service
electrical installers, automobile repair
and maintenance shops, auto body
Online
repair shops, and gas stations, etc
23Maintenance network to adapt to next-generation
technology
✓ Enhance collaboration with partners that deal
with next-generation technologies, regardless
of their name or size
Next-
✓ Handle information of maintenance that generation
requires next-generation technologies, maintenance
facilities, maintenance operation skills and Online
customers that each business partner holds
✓ Targeting partners :
Automobile repair and maintenance shops,
auto body repair shops and car dealers, etc
24Multi-dealer network
✓ Handling information of next-generation
vehicles through the car dealership
business and make the best use of it
with other networks Online
✓ Targeting partners :
Domestic and overseas car dealers, used car
dealers, car rental and car leasing companies, etc. Multi-dealer
25Overseas Alliance network
✓ Incorporate technological innovations and business
models from alliance companies
✓ Contribute to the development of a domestic value
chain by start trading with foreign suppliers and
wholesalers
Online
✓ Targeting partners :
Car sharing companies, startup companies
related to automobile,
Overseas
autoparts manufacturers, local retailers, etc Alliance
26Online network to enhance relationships with
customers
✓ Integrate all the data, technologies, skills, etc. of each
network, and build a database that visualizes "people's
lives"
Domestic AUTOBACS
国内オートバックス事業
Business
Overseas Business
海外事業
海外事業
Online Car Dealer Business
ディーラー事業
ディーラー事業
BtoB business
Internet Business
27AUTOBACS SEVEN VISON
2050 Create Future Together
Professional and Friendly
28Appendix
Non-Consolidated and Domestic Store Subsidiaries
                                                                   (H1 FY2020)
                                                                                           (Million Yen)

                    Non-consolidated                       Domestic Store Subsidiaries

                 Results                YoY                  Results                      YoY

 Net Sales           79,545              +9,049                   27,983                      +3,638
 Gross               16,789              +2,027                   12,241                      +1,832
 margin(%)           (21.1%)              (+0.2pt)                 (43.7%)                   (+0.9pt)

 SG&A                14,046                 +830                  11,013                         +769

 Operating
 Income
                      2,743              +1,196                     1,228                     +1,063
                                                       ・Sales and profit increased.
             ・Sales and profit increased.
                                                       ・Sales and gross margin increased because
             ・Wholesale of tires, wheels, and car
                                                       of the conversion of franchisees into
             electronics, etc. remained strong.
                                                       subsidiaries and the strong sales of tires
             ・Profit increased significantly by
                                                       and dashcams, etc.
             controlling the increase of SG&A
                                                       ・Gross margin ratio improved due to strong
             within the range of increase of the
                                                       sales of services including statutory safety
             gross margin.
                                                       inspections.

                                              Amounts are rounded down to the nearest hundred million yen.
                                                                                                             29
Store Openings and Closings (Plan)
Domestic stores
Fiscal year ending March 31, 2020
No. of
No. of H1 (results) No. of H2 (Plan) stores as of
stores as of stores as of March 31,
March 31, New S/B・R/L Close Sep. 30, New S/B・R/L Close 2020
2019 2019 (Plan)
AUTOBACS 493 +2/-2 -2 491 +3 -2 492
Super AUTOBACS 74 74 74
AUTOBACS
Secohan Ichiba 7 7 7
AUTOBACS EXPRESS 11 11 11
AUTOBACS CARS 8 -5 3 3
Total 593 +2/-2 -7 586 +3 -2 587
Overseas stores S/B=Scrap & Build, R/L=Relocation
FY March 2019 (Results & Forecasts)
No. of stores as of
Country / Region
No. of stores as of H1 No. of stores as of H2 March 31, 2020
March 31, 2019 (results) Sep. 30, 2019 (Plan) (Plan)
France 11 11 -1 10
Thailand 15 +1 16 +1 17
Singapore 3 3 3
Taiwan 7 7 -1 6
Malaysia 4 4 4
Indonesia 3 -1 2 2
Philippines 3 3 3
Total 46 +1/-1 46 +1/-2 45 30Automobile purchase and sales business
BtoB Sales Retail
Details No. of cars sold Details No. of cars sold
To AUTOBACS 1,590 Used cars 4,121
SEVEN
Sales to AA via 2,533 New cars 2,369
AUTOBACS
SEVEN
Direct sales 5,762
from stores
BtoB total 9,884 Retail total 6,490
Total 16,374 cars
YoY +13.2%
※Include sales at all domestic AUTOBACS CARS stores
31Balance Sheets / Assets
Total Assets Total Assets
181.3 185.0
Billion Yen Billion Yen
25.7 Major items changed
30.6 Cash and
deposit
Notes and accounts 28.3
25.1 receivable Domestic AUTOBACS
Business :+1.5BY
19.6 Inventory 21.6
Others :+0.7BY
Other accounts
22.6 receivable 25.1
Other
9.7 current assets 9.1
Property, plant,
41 and equipment 44.6 Right-of-use assets:+3.6 BY
Intangible Land: +0.1 BY
6 assets 6
Investments and
26.4 other assets 24.3
At Mar 31, 2019 September 30, 2019
* Billion Yen
* Round down to the 10 million Yen
32Balance Sheets / Liabilities and Net assets
Liabilities and Liabilities and
net assets net assets
181.3 185.0
Billion Yen Billion Yen
Notes and accounts
payable
Short-term loans
21.2 payable
21.4 Major items changed
2.4 Accounts payable - 1.1
13.5 other 15.4
Other current
8.1
1.3 7.1
liabilities 1.9
11.4
Long-term
14.5 Lease liability:+3.1BY
loans payable
Other
non-current
liabilities
Total Dividends Paid :-2.4BY
Profit attributable to owners
124.1
Net assets of parent :+2.8BY
122.3
Acquisition of Own Shares :
-2.0BY
At Mar. 31, 2019 September 30 2019
* Billion Yen
* Round down to the 10 million Yen
33CAPEX and Depreciation
CAPEX Depreciation
(Billion Yen) (Billion Yen)
7 6
6.12
5.89
6
5.4 5
4.57 4.20
4.84 4.16 4.03
5 4.61
4
3.84 3.73
4 3.58
3
3
2
2 2.21
1 (H1)
1
1.43
(H1)
0 0
2015/3 2016/3 2017/3 2018/3 2019/3 2020/3 2015/3 2016/3 2017/3 2018/3 2019/3 2020/3
(E) (E)
34Cash Flow
Consolidated Cash Flow
(Million Yen)
(First Half FY2020)
4,000
1,810
2,000
Cash balance:
0 25.6Billion Yen(Sep.30, 2019)
-1,172
37.3 Billion Yen (Sep.30, 2018)
-2,000
-4,000
-6,000 -5,504
Operating CF Investment CF Financial CF
Breakdown of investment items (including items other than CAPEX)
- Renovation of existing stores
- Information technology investment
35Domestic Store Subsidiaries: Management Restructuring
Conversion of franchisees into a subsidiary
・Acquisition of Shares of franchise company, running 7 stores in Gifu,
Nagano and Aichi Prefecture.(March 1, 2019)
・ Planned acquisition of Shares in franchise company, running 8
stores in Kumamoto prefecture.
(November 1, 2019)
As of September 30, 2018, Domestic store subsidiaries:
110 stores operated by 14 companies
As of November 1, 2019, Domestic store subsidiaries:
123 stores operated by 16 companies
36“Safety and Security” merchandise
Goods for security and safety are currently attracting attention
from customers, because of multiple reports in the media of
accidents due to mistakenly pressing down the accelerator
instead of the brake.
Pedal WatcherⅡ
Price:40,000 yen
(electric wiring for each car type,
installation fee included, tax excluded)
In several local governments including Tokyo, there is
a growing trend for products that support safety
driving by elderly drivers to be covered by subsidies.
37Domestic AUTOBACS Business:
JACK & MARIE Fifth store
■ Promotion of opening of stores
Fifth store: JACK & MARIE Grandberry Park
(open on November 13, 2019)
Location: Machida-shi, Tokyo (inside Grandberry Park)
38Conversion of a statutory safety inspection
provider to a subsidiary
To develop a new network, of maintenance
business a statutory safety inspection provider has
been converted into a subsidiary in June 2019.
Company name : Seiwa Automobile Sales Co., Ltd.
Location:Rittou-shi, Shiga Prefecture
Business description:Car repair and maintenance
Capital:10 Million Yen
39Making a wholesale business company
a subsidiary
Company name:HSC Planning ,Ltd
Location : Onojo-shi, Fukuoka Prefecture
Business description:Planning, development and
import wholesale business of wheels
Capital: 10 Million Yen
Stock acquisition date: July 31, 2019
40Forward-Looking Statements These materials include forecasts regarding the Company’s future plans, strategies, and performance. This information is based on judgments and estimates made in accordance with information currently available. Actual results may differ materially from forecasts due to such factors as changes in operating circumstances.
You can also read