Presentation - Q4 2017/18 - October, 2018 - Dustin Group
←
→
Page content transcription
If your browser does not render page correctly, please read the page content below
Presentation – Q4 2017/18
October, 2018

YEAR-END REPORT 2017/18

Dustin at a glance
     255,000 hardware and software products…                                                                               …sold online…                                            Net sales
                                                                                                                                                                  SEK
                                                                                                                                            Dustin (B2B)
Software and services                                      Hardware                                                                                               million
       ~12%                                                                              Offline
                                                                                         ~20%                                                                     10,000

                                                 Clients                 Servers                                                                                  8,000
                                                           Software
                                                                                                                                                                  6,000
                                                                                                                                         Dustin Home (B2C)
                                                                                                                                                                  4,000
                                                    OS                    SaaS
                                                           Services                                                                                               2,000

                 Hardware                                                                              Online                                                     0,000
                  ~88%                                                                                 ~80%
                                                Financing             Cloud solutions
    Refers to financial year 2017/18                                                    Refers to integrated operations financial year 2017/18

                       …across the Nordics…                                                                    …to B2B customers                                            Adjusted EBITA and margin
                                                                                                                                                                  SEK
                Netherlands*                                                                 % net sales          Customers      Offering            Avg. order
                                                                                                                                                                  million
                    ~2%
          Norway                                                                                                                                                  500                                   6,0%
           ~16%                                                                                                   SMB            Full assortment     SEK 7,000
                                                                                                                                                                  475
Denmark                                                                                       94%                                                                 450                                   5,5%
 ~16%                                                                                                             Public/Large   Replienishment IT SEK 11,000     425
                                                                                                                                                                  400                                   5,0%
                                                                                                                                                                  375
                                                                                                6%                B2C            IT products         SEK 2,000    350                                   4,5%
                                                                                                                                                                  325
           Finland              Sweden
                                                                                                                                                                  300                                   4,0%
            ~16%                 ~50%                                                                                 1.2 million orders
    Refers to financial year 2017/18 *Consolidated as of July 4, 2018.                  Refers to financial year 2017/18

2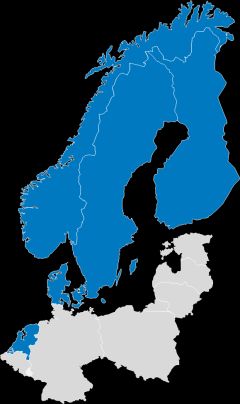
YEAR-END REPORT 2017/18

Q4 17/18 High operational activity in the quarter

Operational Highlights
New framework agreement in Denmark
    •   Danish government, municipalities and regions. Annual value estimated at around DKK 500 million
New agreement in Norway
    •   Cloud-based services (back-up and storage) with public service company NRK.
Acquired DAV Partner in Sweden
Acquired ITaito in Finland
Acquired Vincere Groep
    • One of the leading Managed Services companies within SMB in the Netherlands
    • Dustin’s addressable market increases from SEK 162 to SEK 262 billion
.

Operational Highlights after the end of the fourth quarter
New organisation announced
    • To create greater clarity within segments and further increase scalability of support functions
Preferential rights issue
    • To continue existing growth strategy in existing markets in the Nordic region and the Netherlands
Extraordinary General Meeting
    • Approval of announced rights issue

3
YEAR-END REPORT 2017/18

Strong rationale for the acquisition of Vincere Groep

            Substantial increase of the addressable market          Increased share of recurring revenues
            Growth from approximately 162 BSEK to 262 BSEK          High share of recurring Managed Services contracts

            A perfect platform for expansion and consolidation      Low customer dependency
            Ample consolidation opportunities in the Dutch market   Largest customers accounts for less than 5% of total sales

            Highly experienced and driven management team           High customer satisfaction
            Similar corporate values as Dustin                      Loyal client base ensuring low customer churn

             Very attractive financial profile                      Highly interesting growth components
             Substantial earning contribution already in 2018/19    E.g. further consolidation and launch of Dustin online platform

4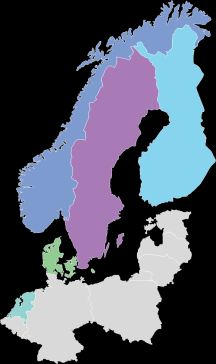
YEAR-END REPORT 2017/18

Q4 17/18 Higher service content strengthening profitability

Financial Highlights                                                           Net sales and adjusted EBITA margin
Net sales grew by 11.6% to 2,524 (2,262) MSEK
                                                                                      3,000                                       10%
    • Organic growth of -4.7% in constant currency, of which SMB 8.0%,
      LCP -13.4% and B2C 1.1%                                                                                     2,524
                                                                                      2,500
Gross profit of 417 (325) MSEK                                                                   2,262                            8%

    • Gross margin of 16.5% (14.3%)

                                                                                                                                        Adjusted EBITA margin
                                                                                      2,000
Adjusted EBITA of 119 (92) MSEK                                                                                                   6%

                                                                               MSEK
    • Adjusted EBITA margin of 4.7% (4.1%)                                            1,500
                                                                                                                   4.7%
                                                                                                  4.1%
Items affecting comparability of 3.6 (-0.8) MSEK                                                                                  4%
                                                                                      1,000
Earnings per share increased to 0.91 (0.64) SEK
                                                                                                                                  2%
                                                                                      0,500
Cash flow from operating activities of 59 (-14) MSEK
Net debt of 1,731 (998) MSEK                                                          0,000                                       0%
    • Net debt/adjusted EBITDA up to 3.3x (2.3x) in the past 12-month period                    2016/17          2017/18

The Board proposes a total dividend of SEK 239 (213) MSEK                                     Net sales   Adjusted EBITA margin

5
YEAR-END REPORT 2017/18
Financial Development – SMB
Solid growth in the SMB segment Net sales and segment margin
Net sales growth in SMB of 38.9% y/y 1,154
1 200
• Organic growth of 8.0% in constant currency 20%
1 000
Segment margin
831
Segment result increased 45.5% to 132 (91) MSEK 800 15%
MSEK
11.4%
• Segment margin improved to 11.4% (10.9%) 600
10%
Acquisitions and strong online performance 400 10.9%
5%
• Acquired and consolidated ITaito (June 1), DAV Partner (July 2) and 200
Vincere Groep (July 4) 0 0%
• Robust sales performance, primarily in Sweden and Denmark 2016/17 2017/18
Net sales Segment margin
Favorable product mix drives margin improvement
• A general improvement in the product mix in comparable units as MSEK
Q4 Q4 Organic Q4 y/y
well as completed acquisitions drives margin development 2017/18 2016/17 growth growth
• Positive margin contribution from higher private label product sales Net sales 1,154 831 8.0% 38.9%
• The customer base for SaaS configurations grew to 1,227 active Segment result 132 91 – 45.5%
customers (980), corresponding to 53,988 users (30,150)
Segment margin 11.4% 10.9% – –
6YEAR-END REPORT 2017/18
Financial Development – LCP
Selective approach towards lower margin contracts Net sales and segment margin
Net sales growth in LCP of -5,1% y/y 20%
1 500
• Organic growth of -13.4% in constant currency 1,296 1,230
1 250
Segment margin
15%
Segment result slightly lower at 74 (76) MSEK
MSEK
1 000
• Segment margin improved to 6.0% (5.9%) 750 10%
5.9% 6.0%
Selective approach to lower margin volume transactions 500
5%
• More selective in lower margin volume transactions under certain 250
framework agreements for the public sector, particularly in Finland, 0 0%
Denmark and Norway 2016/17 2017/18
Net sales Segment margin
• Robust sales performance in the Large Corporate customer group in all
markets, with a reported total growth of slightly more than 26%
Q4 Q4 Organic Q4 y/y
• Deliveries within Danish framework agreement starts in the first quarter MSEK
2017/18 2016/17 growth growth
and is expected to generate a positive effect on growth going forward
Net sales 1,230 1,296 -13.4% -5.1%
Slightly improved margins
Segment result 74 76 – -3.2%
• Margin improved slightly, mainly as a result of a more favorable sales
balance between the large corporate and public sector customer groups Segment margin 6.0% 5.9% – –
7YEAR-END REPORT 2017/18
Financial Development – B2C
Stable growth – focus on margin Net sales and segment margin
Net sales growth in B2C of 3.3% y/y 200 12%
• Organic growth of 1.1% in constant currency 140
10%
Segment margin
150 135
Segment result slightly lower at 7.2 (8.1) MSEK 8%
MSEK
100 5,2% 6%
• Segment margin at 5.2% (6.0%) 6,0%
4%
Complement segment representing around 6% of total sales 50
2%
• Positive sales development in Denmark and Norway
0 0%
• Strong sales in the mobile phones and infrastructure product 2016/17 2017/18
categories Net sales Segment margin
Continued focus on margin Q4 Q4 Organic Q4 y/y
MSEK
2017/18 2016/17 growth growth
• Pricing discipline and flexible cost base
Net sales 140 135 1.1% 3.3%
• Valuable segment to understand market trends and to get
access to consumer assortment Segment result 7.2 8.1 – -10.3%
Segment margin 5.2% 6.0% – –
8YEAR-END REPORT 2017/18
Net Working Capital
Continued low net working capital
Net Working Capital
• Net working capital was -192 MSEK (118)
250 1,3% 0,9%
• Account payables still high due to temporary favorable credit terms from 0,5%
distributors. The effect was slightly higher than in prior periods, mainly due 200
-0,2% -0,1% -0,4%
to higher share or purchases from these distributors 150 -0,9%
-1,8%
• Account receivables higher than last year, primarily as a result of higher 100
sales volumes 50
• Inventory level slightly higher, due to higher sales volumes and increasing 0
share of Dustin private label products -50
-100
x
-150
-200
-250
NWC Average LTM NWC as % of LTM sales
9YEAR-END REPORT 2017/18
Cash flow and capex
Improved operating cash flow
• Cash flow for the quarter was -121 (-24) MSEK Cash Flow
• Cash flow from operating activities, before changes in working capital, 150
increased to 97 (79) MSEK, mainly due to higher profits +55
50 +18
• Changes in working capital was positive by 55 MSEK versus last year,
mainly as a result of higher account payables -50
-24 +559
• Cash flow from investing activities decreased due to completed -150 -121
acquisitions during the quarter
-250
• Cash flow from financing activities improved by 559 MSEK, affected by a
new bank agreement and repayment of previous financing -350
-450
Continued low levels of capex
-550
• Total capex at 0.9% (0.2%) of net sales
-650
• Capex related to IT development (integrated IT-platform and other
long term strategic IT-systems) of SEK 5.1 (3.1) million -729
-750
Q4 16/17 Operating Changes in Investing Financing Q4 17/18
• Other capex of SEK 17.1 (2.3) million, of which the majority refers activities working activities activities
to computer purchases for internal use capital
10YEAR-END REPORT 2017/18
Leverage above target range
Higher net debt in relation to adjusted EBITDA
Net debt and Net debt/adjusted EBITDA
Net debt increased to 1,731 (998) MSEK
Net debt/adjusted EBITDA up to 3.3x (2.3x) at the end of 2017/18 1,731
• Above target of a net debt/adjusted EBITDA of 2-3x
• Acquisitions of Norriq ICS, Core Services, JML System, DAV
Partner, ITaito and Vincere Groep in 2017/18
3.3x
998
Leverage limits execution of current acquisition strategy x
• Future cash flow generation will be enough to reach target range in 2.3x
2018/19
• Limited execution of current acquisition strategy
• Retained dividend, no change in dividend policy
2016/17 2017/18
Net debt Net debt/adjusted EBITDA
11YEAR-END REPORT 2017/18
Rationale for the rights issue
Proven growth story Drive market consolidation
Average net sales growth (CAGR) of 13.6 percent (2012/13 - Ability to respond to increased market activity and continue to be
2017/18) of which organic growth corresponded to 8.6 percent active and a driving part in the current market consolidation
Maintain current acquisition strategy Further strengthen position
Flexibility and ability to maintain the current acquisition strategy Further strengthen position as the leading IT partner online in the
within the existing markets in the Nordics and the Netherlands Nordic region
Increased transaction activity Continued margin expansion
Increased transaction activity in all markets. Driven by strong Broaden offering of more advanced services and solutions to
company performances combined with several successful further strengthen margins
transactions
Inflow of potential acquisition candidates Increase customer loyalty and share of recurring revenues
Current large inflow of potential acquisition candidates in all Higher share of services and solutions increases proportion of
existing markets. Dustin now seen as natural industrial recurring revenues and strengthens customer loyalty
partner/buyer for entrepreneurs and financial sellers
12YEAR-END REPORT 2017/18
Terms for the rights issue
7 old shares provides subscription rights to subscribe for 1 new Overview of terms for the rights issue
share # of shares pre-issue – Million shares 77.2
Pre-issue share price at closing on 4 Oct, 2018 – SEK 85.4
• For each share held in Dustin one (1) subscription right is obtained
• Seven (7) subscription rights entitle to subscription of one (1) new share
Terms 1:7 (1 new for 7 old)
# of new shares issued – Million 11.0
Discount to TERP of 23.7%1) Subscription price – SEK 63
• Subscription price: SEK 63 per new share Theoretical ex-rights price (TERP)1) – SEK 82.6
• Issue proceeds of c. SEK 695 million before the deduction of transaction
costs Discount to TERP1) – % 23.7%
Theoretical value of subscription right – SEK
1)
2.80
Dustin’s number of shares increase by c. 11,032,357 to c. Total issue size – MSEK 695.0
88,258,859 issued shares
# of shares post-issue – Million shares 88.3
New shares as % of total # shares post-issue 12.5%
1) Based on Dustin’s closing share price as of 4 Oct, 2018
13YEAR-END REPORT 2017/18
Rights issue timetable
DATE EVENT
OCTOBER 2018
17 Oct Record date for the rights issue
M T W T F S S
v40 1 2 3 4 5 6 7
v41 8 9 10 11 12 13 14
18 Oct Prospectus published v42 15 16 17 18 19 20 21
v43 22 23 24 25 26 27 28
v44 29 30 31
19 Oct – 7 Nov Subscription period
Trading in subscription rights (ends 5 Nov) and paid subscribed
19 Oct – 9 Nov
shares (BTA) NOVEMBER 2018
M T W T F S S
1 2 3 4
9 Nov Outcome of rights issue announced by press release v44
v45 5 6 7 8 9 10 11
v46 12 13 14 15 16 17 18
v47 19 20 21 22 23 24 25
13 Nov Settlement date for subscription without preferential rights v48 26 27 28 29 30
15 Nov First day of trading with new shares
14YEAR-END REPORT 2017/18
Summary FY 2017/18
Solid growth and positive margin trend
Net sales increased by 10.7% to SEK 10,300 (9,306) million
• Organic net sales growth of 2.0% in constant currency
• Robust growth in SMB and B2C, while volume volatility within LCP burdens total growth
Gross margin at 15.9% (14.8%)
• Positively affected by a more favorable product mix primarily from completed acquisitions
Adjusted EBITA margin of 4.9% (4.6%)
• Positively impacted by a higher gross margin and a more favorable mix between segments.
Earnings per share increased 27% to SEK 3.99 (3.14)
The Board proposes a total dividend of SEK 239 (213) million, corresponding to
SEK 3.10 (2.80) per share before consideration of proposed rights issue
High operational activity during the year, acquired Norriq ICS, Core Services,
JML-System, DAV Partner, ITaito and Vincere Groep
15CORPORATE PRESENTATION
Dustin at a glance
255,000 hardware and software products… …sold online… Net sales
SEK
Dustin (B2B)
Software and services Hardware million
~12% Offline
~20% 10,000
Clients Servers 8,000
Software
6,000
Dustin Home (B2C)
4,000
OS SaaS
Services 2,000
Hardware Online 0,000
~88% ~80%
Financing Cloud solutions
Refers to financial year 2017/18 Refers to integrated operations financial year 2017/18
…across the Nordics… …to B2B customers Adjusted EBITA and margin
SEK
Netherlands* % net sales Customers Offering Avg. order
million
~2%
Norway 500 6,0%
~16% SMB Full assortment SEK 7,000
475
Denmark 94% 450 5,5%
~16% Public/Large Replienishment IT SEK 11,000 425
400 5,0%
375
6% B2C IT products SEK 2,000 350 4,5%
325
Finland Sweden
300 4,0%
~16% ~50% 1.2 million orders
Refers to financial year 2017/18 *Consolidated as of July 4, 2018. Refers to financial year 2017/18
17CORPORATE PRESENTATION
High growth position in a large market
Large and fragmented addressable market Key trends driving Dustin’s underlying growth
Channel shift from offline
to online
Growth pockets within advanced
products and services
Higher growth for smaller
companies
*Compound Annual Growth Rate
Note: Market data based on calendar year. The addressable market refers to hardware sales to the B2B segment and selected parts of software and
services to the customer group small and medium enterprises.
Source: Dustin estimates based on market data from IDC and market analysis from a senior advisor.
18CORPORATE PRESENTATION
Dustin has a strong position in the value chain
~2,800 brands1) Dustin’s customer base2)
Hardware
~5k
customers
Public/
Large
Distributors corporations
~100k
SMB customers
Software
~350k
Consumers
customers
Value proposition to OEMs and distributors High barriers to entry Value proposition to customers
Distribution to customers that are difficult to serve Significant scale Wide product and service offering
>100k loyal B2B customers Long term experience High IT knowledge
Unique partner for campaigns / product launches Market leading brand Fast and reliable delivery
A LARGE NUMBER OF SUPPLIERS… ...NEED AGGREGATOR TO INTERACT WITH... …A LARGE NUMBER OF CUSTOMERS
1) Purchased from ~390 suppliers (OEMs or distributors). 2) Defined as customers that have made at least one purchase during last 18 months. For consumers, the unique identifier is account number rather than personal identification number.
19
19CORPORATE PRESENTATION
Unique position combining cost efficiency with high service level
High
ERP implementation
Illustrative
Strategic IT consultancy Atea
Advania
Integrated solutions
Degree of value added service
On-site services
Small and medium
Product-near services Small IT sized businesses
infrastructure
High IT knowledge and service
companies
Fast delivery
Wide offering of ~255k IT products
Komplett
Strong brand name
Verkkokauppa
Non-IT related consumer products
Low
Dustin’s focus areas Low Cost efficiency High
Non SMB related services Scale High online share Efficient execution Central functions
net sales (2013)
SG&A as % of
24% 21%
1) 2014. Refer to the financial year ended 31 August. 2014.
13% 11% 11%1)
Source: Annual reports. industry analysis and management analysis.
Caperio Atea Verkkokauppa Komplett Dustin
20CORPORATE PRESENTATION
Multi-channel approach to drive growth and margins
Product Customer needs Three tiered Customer needs
portfolio Basic Medium Advanced sales model Basic Medium Advanced
Stand-alone services
and solutions
CONSULTATIVE
Offline
SALES ~25%
of net sales
Cloud solutions MPS1)
Higher gross margin
Advanced products
OUTBOUND
SALES
Server SaaS Financing Online
~75%
of net sales
Basic products
ONLINE
SALES
Clients Software
21CORPORATE PRESENTATION
Financial targets
Financial targets Historical performance
8% organic
Dustin’s target is to achieve average annual organic net sales growth growth Period: 2013/14 – 2017/18
Net sales amounting to 8 percent over an economic cycle
growth Average per
year over a Average: ~8% organic growth per year
In addition, Dustin targets to grow through acquisitions
cycle
5–6% Period: 2017/18
Dustin’s target is to increase adjusted EBITA margin over time and in
Profitability Adj. EBITA
the medium term achieve 5–6 percent adjusted EBITA margin Actual: 4.9%
margin
Dustin´s capital structure shall provide a high degree of financial
flexibility and allow for acquisitions 2.0–3.0x Period: 2017/18
Capital
structure Net debt to adj.
Dustin targets to have a net debt, over time, amounting to a multiple of Actual: 3.3x adjusted EBITDA
EBITDA
2–3 times adjusted EBITDA for the last twelve months
Dustin’s target is to pay a dividend corresponding to more than 70
Period: 2017/18
Dividend percent of net profit >70%
policy Actual: Total dividend of SEK 239 million,
The dividend shall take into account acquisitions, the company’s Pay-out ratio
financial position, cash flow and future growth opportunities corresponding to 78% of reported net profit.
22CORPORATE PRESENTATION
Continue leveraging dynamic market trends and new service offerings
2017/18 2021/22
CAGR:
~10%
• Pan-Nordic footprint with one Net sales • One-stop shop for SMBs in all Net sales
common platform supporting
product and service offerings
SEK 10.3 bn Nordic countries and the
Netherlands
SEK ~15* bn
• Nordic governance structure with EBITA margin • Fully integrated online experience EBITA margin
highly skilled central online team
and local sales organization
4.9% • Based on financial target of 8% organic
for product and service sales
5-6%*
• Large Corporates to reach more
• Around 250 sales specialists Number of FTEs growth over a cycle than 50% sales share within LCP
addressing more than 10,000
1,152 • Bolt-on acquisitions in existing markets in segment
customers with a wide portfolio of the Nordics and the Netherlands • More than 4 bn SEK in advanced
IT-solutions
• Leverage integrated platform – infrastructure products and services sales driven
• Cloud portal securing growth in and customer offerings in all geographies by acquisitions and organic growth
SaaS and managed services
• Realize sales synergies of newly acquired • More than 1 bn SEK in recurring
offerings and expanding customer base revenues
Product split Segment split • Accelerate sales of managed services Product split Segment split
Services & towards SMB to increase recurring revenues Services &
Solutions Advanced B2C and margin expansion Solutions Advanced B2C
products products
• Continue consolidation of specialized VAR
market through M&A
LCP LCP
SMB SMB
Basic Basic
products products
Source: Dustin. *based on financial targets
23CORPORATE PRESENTATION
Well defined levers will contribute to the margin journey
Margin journey potential FY21/22
0.3-0.5%
0.6-0.8%
~6%
0.2-0.4%
0.1-0.3%
4.6%
Adjusted EBITA margin 16/17 Increased share of SMB Private label Value accretive M&A Managed services Adjusted EBITA margin 21/22
Increased share of SMB Private label Value accretive M&A Managed services
• SMB growing faster than LCP due • Targeting 25% of sales in each of • Target to raise share of advanced • Scalable platform aggregating a
to our cost efficient online platform the selected categories to reach products and services and recurring wide portfolio of SaaS to the B2B
to serve SMB customers and a annual private label sales of 400 revenue by adding 3-5 bolt-on market
continued focus on SMB offerings MSEK within 3 years with an acquisitions annually • Target to reach 10,000 customers
incremental EBITA margin of
• Supporting customer journey by adding 300 MSEK in sales within 3
around 10 percentage points on
driving both margin and loyalty years enabling 20-50% gross margin
average on incremental SaaS sales and
attached services
Source: Dustin, November 2017
24CORPORATE PRESENTATION
Dustin’s Cloud Platform - The one-stop-shop targeting SMBs
Dustin’s
customer base
~5k
customers
Public/
Large
corporations
~100k
SMB customers
~350k
Consumers
customers
Seats and customers Increasing share of high-margin recurring revenue
60,000 2,000
50,000 Scalable platform aggregating a wide portfolio of SaaS to the Nordic B2B market
1,500
40,000 Launch being Microsoft centric due to strong legacy and cloud services brand recognition
30,000 1,000 Fast growth within Dustin’s SMB customer base and significant cross-selling opportunities
20,000
0,500 SaaS bundled with in-house Dustin solutions. e.g. Office 365 migration and Helpdesk
10,000
0,000 0,000 Ease of use to order and manage subscriptions
Q4 Q1 Q2 Q3 Q4 Q1 Q2 Q3 Q4 Dustin’s multi-channel sales model ideal to convert and migrate transactional HW customers
15/16 16/17 16/17 16/17 16/17 17/18 17/18 17/18 17/18
Number of seats Number of customers
25
25You can also read