DbAccess Global Consumer Conference 2020 - June 10, 2020 - Nomad Foods
←
→
Page content transcription
If your browser does not render page correctly, please read the page content below
dbAccess Global
Consumer Conference 2020

       June 10, 2020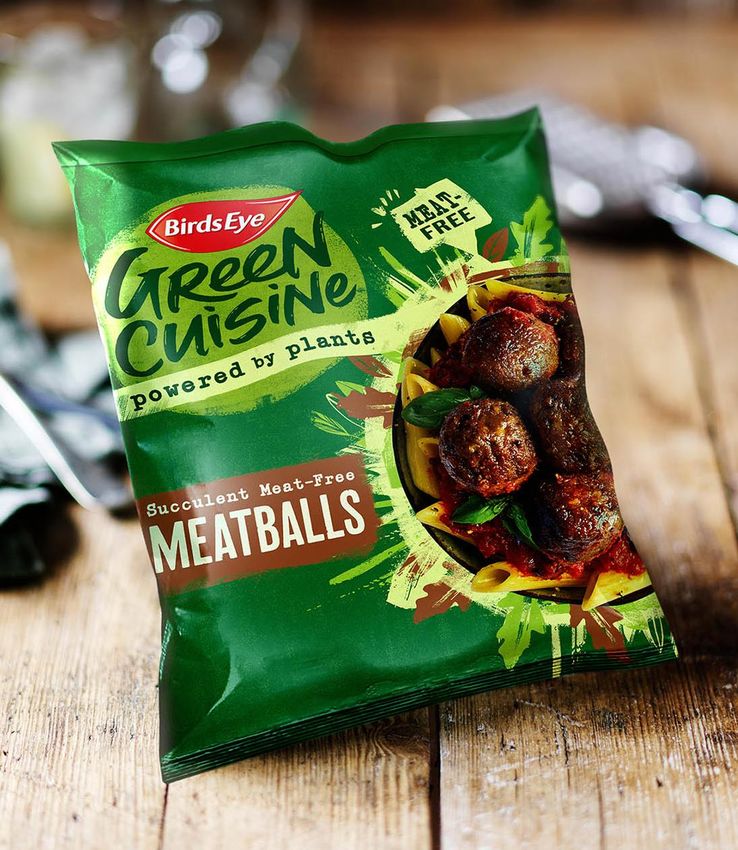
Disclosures

This presentation has been prepared and issued by Nomad Foods Limited (the "Company"). This Presentation has been provided solely for information and background. The information in this Presentation is provided as at the date of the
Presentation (unless stated otherwise). This Presentation does not constitute or form part of, and should not be construed as: (i) an offer, solicitation or invitation to subscribe for, sell or issue, underwrite or otherwise acquire any securities or
financial instruments, nor shall it, or the fact of its communication, form the basis of, or be relied upon in connection with, or act as any inducement to enter into any contract or commitment whatsoever with respect to such securities or financial
instruments; or (ii) any form of financial opinion, recommendation or investment advice with respect to any securities or financial instruments.

This Presentation includes preliminary results for the first two months of the second quarter of 2020. These preliminary results are based on management’s initial analysis of operations for the two-month period and are subject to change. The
Company’s actual financial results for the first two months of the second quarter of 2020 could differ materially from the preliminary estimates provided in this presentation as a result of the completion of closing procedures, final adjustments, or
other developments arising between now and the time that our financial results are finalized. The Company cautions that its results for the two-month period may not be indicative of results for future periods.

Certain statements and matters discussed in this Presentation, as well as the accompanying oral presentation, may constitute forward-looking statements. Forward-looking statements are statements that are not historical facts and may be
identified by words such as "aim", "anticipate", "believe", "continue", "estimate", "expect", "intend", "may", "should", "strategy", "will" and words of similar meaning, including all matters that are not historical facts. This Presentation includes forward-
looking statements regarding the Company’s (i) guidance with respect to organic revenue growth in the second quarter 2020; (ii) intentions to continue to develop “big bet” new product launches such as Green Cuisine; (iii) expectations regarding
the impact of the Green Cuisine business on the Company’s growth, the amount and timing of anticipated revenues from Green Cuisine; and (iv) the Company’s intention to use cash primarily for acquisitions and its goal to build and grow a
portfolio of best in class food assets.

The forward-looking statements in this Presentation speak only as of the date hereof and are based upon various assumptions, many of which are based, in turn, upon further assumptions. Although the Company believes that these assumptions
were reasonable when made, these assumptions are inherently subject to significant known and unknown risks, uncertainties, contingencies and other important factors which are difficult or impossible to predict and are beyond its control that
could cause actual results to differ materially from those expressed or implied by such forward-looking statements, including (i) the impact of the COVID-19 pandemic on the Company’s business, suppliers, co-manufacturers, distributors,
transportation or logistics providers, customers, consumers and employees; (ii) disruptions or inefficiencies in the Company’s operations or supply chain, including as a result of the COVID-19 pandemic, and the Company’s ability to maintain the
health and safety of its workforce; (iii) the duration, spread and intensity of the pandemic and related government restrictions and other government responses; (iv) the Company’s ability to successfully implement its strategies or strategic initiatives
and recognize the anticipated benefits of such strategic initiatives; (v) the Company’s ability to accurately predict the performance of its Green Cuisine brand and its impact on the Company’s growth; (vi) the commercial success of the Green
Cuisine brand of products, including as a result of its expansion into continental Europe, and other innovations introduced to the markets and the Company’s ability to accurately forecast the brand’s performance in light of COVID-19; (vii) the
Company’s ability to effectively compete in its markets; (viii) changes in consumer preferences, such as meat substitutes, and the Company’s failure to anticipate and respond to such changes or to successfully develop and renovate products; (ix)
the effects of reputational damage from unsafe or poor quality food products; (x) increases in operating costs, including labor costs, and the Company’s ability to manage its cost structure; (xi) fluctuations in the availability of food ingredients and
packaging materials that the Company uses in its products; (xii) the Company’s ability to effectively mitigate factors that negatively impact its supply of raw materials; (xiii) the Company’s ability to protect its brand names and trademarks; (xiv)
uncertainty about the terms of the trade agreement between the UK and the EU associated with Brexit, as well as the potential adverse impact of Brexit on currency exchange rates, global economic conditions and cross-border agreements that
affect the Company’s business; (xv) loss of the Company’s financial arrangements with respect to receivables factoring; (xvi) the loss of any of the Company’s major customers or a decrease in demand for its products; (xvii) economic conditions
that may affect the Company’s future performance including exchange rate fluctuations; (xviii) the Company’s ability to successfully interpret and respond to key industry trends and to realize the expected benefits of its responsive actions; (xix) the
Company’s failure to comply with, and liabilities related to, environmental, health and safety laws and regulations; (xx) changes in applicable laws or regulations; and (xxi) the other risks and uncertainties disclosed in the Company’s public filings
and any other public disclosures by the Company. In addition, these forward-looking statements and the information in this Presentation are qualified in their entirety by cautionary statements and risk factor disclosures contained in the Company’s
Annual Report on Form 20-F filed with the Securities and Exchange Commission on February 27, 2020. Given these risks and uncertainties, prospective investors are cautioned not to place undue reliance on forward-looking statements. Other
than in accordance with its legal or regulatory obligations, the Company is not under any obligation and the Company and its affiliates expressly disclaim any intention, obligation or undertaking to update or revise any forward looking statements,
whether as a result of new information, future events or otherwise. This Presentation shall not, under any circumstances, create any implication that there has been no change in the business or affairs of the Company since the date of this
Presentation or that the information contained herein is correct as at any time subsequent to its date. No statement in this Presentation is intended as a profit forecast or estimate.

This Presentation includes a key performance indicator which is considered a non-IFRS financial measures, organic revenue growth. Nomad Foods believes this non-IFRS financial measure provides an important alternative measure with which to
monitor and evaluate the Company’s ongoing financial results, as well as to reflect its acquisitions. Nomad Foods’ calculation of this financial measure may be different from the calculations used by other companies and comparability may
therefore be limited. You should not consider the Company’s non-IFRS financial measures an alternative or substitute for the Company’s reported results.
Today’s Agenda

      1   Company Overview

      2   COVID-19 and Beyond

      3   Green Cuisine
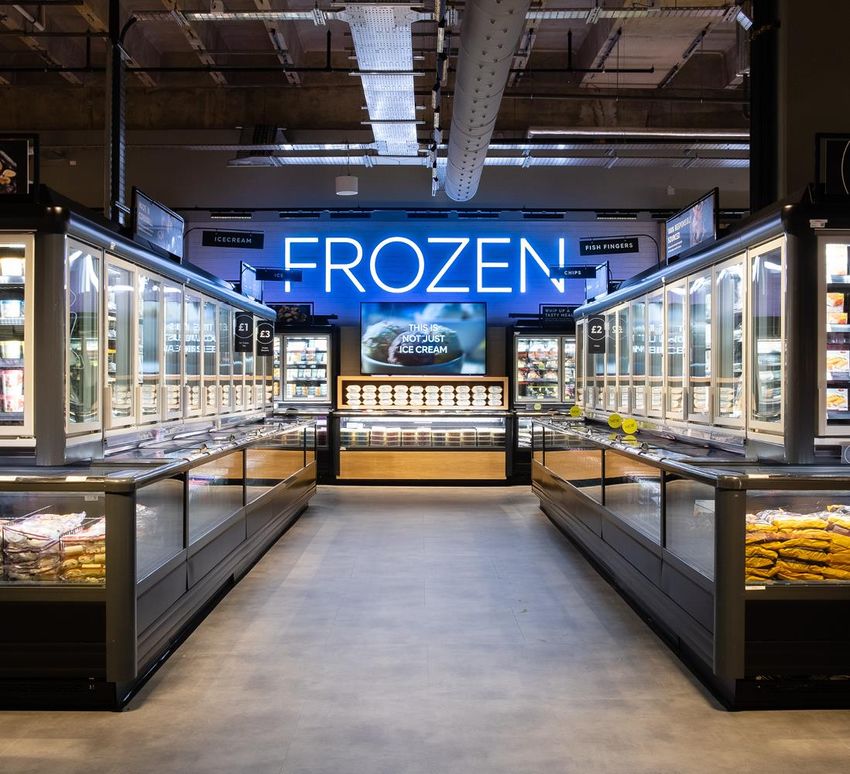
Nomad Foods is Europe’s Leading Frozen Food Company

                                                                               Revenue By Category

     €2b+
                                      net
                                      revenues    3   consecutive years of
                                                      organic revenue growth                 other
                                                                                       pizza 6%
                                                                                        8%

                        #1 market share
                                                                               poultry
                                                                                 8%                          fish
                                                                                              100%           40%
                               within Western Europe frozen food               meals        of revenues in
                                                                                9%           frozen food

    13                                                4,800
                           primary countries                                     potatoes
                                                                                   10%
                           across Western
                                                                                              vegetables
                           Europe                     company employees                          19%

Note: all figures above apply to full year 2019
                                                                                                                    4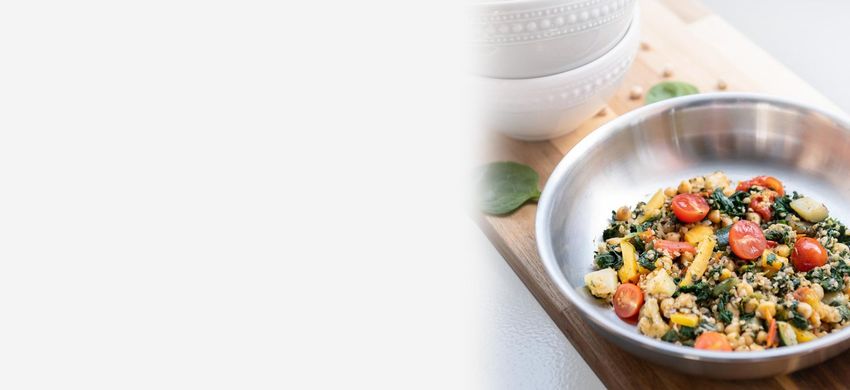
Nomad is the Undisputed Leader in European Frozen Food

                                                      Western Europe
                                                      Savory Frozen Food

                                                      €27B
                                                      Total Retail Sales Value

            Source: Euromonitor, 2019; branded only                              5
Sustainability Is a Fundamental Pillar of our Business

                                                         6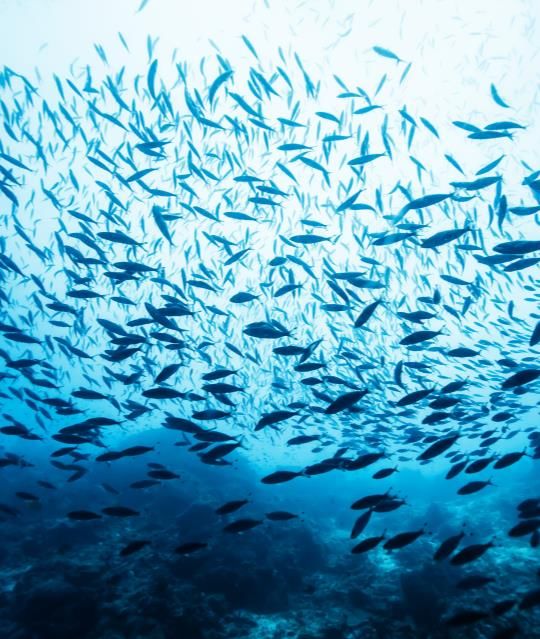
Creating Focus Through Strategic Portfolio Choices

                          CORE                                     SECONDARY BRANDED PRODUCTS
                        70% of revenues                                       10% of revenues
       strategic, fully funded and accretive to growth & margins          managed for margin & cash flow

                                                                     OTHER BRANDED PRODUCTS
                                                                               10% of revenues
                                                                              managed for cash flow

                                                                                                           7
Approaching a 14th Consecutive Quarters of
Organic Revenue Growth

                                                                                         NOMAD FOODS
                                                                                 Quarterly Organic Revenue Growth

                                                                                                                                                LDD%

                                                                                                                                         7.7%

                                     5.9%            5.6%
                                                                                                      4.2%
                    3.5%                                                                                            3.5%
                                                                     2.9%
                                                                                                                           2.5%
                                                                                               1.9%                               1.7%
    1.1%                                                                                1.3%
                                                                                                             0.9%

      Q1              Q2              Q3              Q4               Q1                Q2     Q3     Q4     Q1     Q2     Q3     Q4     Q1    Q2 (est)*
     2017            2017            2017            2017             2018              2018   2018   2018   2019   2019   2019   2019   2020    2020

 *Management expects Q2 2020 organic growth in the low-double digit percentage range.
                                                                                                                                                            8
Business Insights Throughout the COVID-19 Crisis

 Unprecedented Demand                  An Influx of                    Online at a                    Stabilizing
    for Frozen Food                  New Consumers                    Tipping Point                Commodity Costs

 Frozen has been one of the     Growth is being driven by new     Our e-commerce sales have       Commodity prices have
strongest categories with our    users through increases in      growth disproportionately and   stabilized after two years of
 brands gaining market share      household penetration         now represent 7% of our sales        significant inflation
                                                                                                                                 9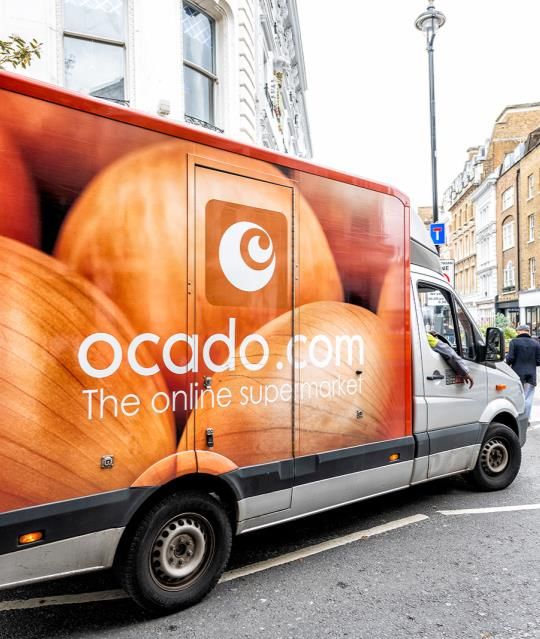
Frozen Consumption Has Grown Across All Occasions
Throughout the COVID Crisis
                                                          Average Number of Frozen Savory Meals per Month
                                                                                               by Occasion, UK Market
  600                                                                                                                                                                                                    0.8

                                                                                                                                                                                                         0.7
  500                                                                                           68%

                                                                                                                                                                                                         0.6
  400
                                                                                                                                                                                                         0.5

  300                                                                                                                                                                                                    0.4

                                         31%                                                                                                            30%                                              0.3
  200                                                                                                                                                                                            28%

                                                                                                                                                                                                         0.2
  100
                                                                                                                                                                                                         0.1

     0                                                                                                                                                                                                   0
                               Breakfast                                                 Lunch                                                 Teatime                                    Evening Meal

                                                                                          Pre-COVID              Post-COVID              % Change

Source: Kantar; pre-COVID period defined as the monthly average during the 52-week period ending March 22, 2020; post COVID period defined as the 4-week period ending April 19th, 2020                      10
Well Aligned with the Acceleration of Online Grocery
Nomad Foods Online Sales Growth
2020 Year-on-Year
✓ In 2019, e-commerce represented 5% of total Nomad sales
and grew high-single digits % 80%
✓ Since March 2020, e-commerce growth has accelerated
significantly and now represents 7% of total Nomad sales
✓ Online retailers have made significant investments
throughout the pandemic, unlocking fulfilment bottlenecks 43%
✓ Nomad’s market share online is 40% higher than in-store
with a greater percentage of volume sold at full price
15%
✓ Frozen food is a planned purchase and a category that is 9%
added earlier to consumers’ shopping carts online vs. in-
store
Jan 2020 Feb 2020 Mar 2020 Apr 2020
11Key Actions We are Taking to Convert Current
Momentum into Sustained Long-Term Growth
EDUCATE CONSUMERS ON THE BENEFITS OF FROZEN FOOD
▪ Most consumers recognize the convenience of frozen food…
▪ …however, they still underutilize their freezer, which is opened an average of 8x
per week versus the pantry door 24x and refrigerator 42x
▪ An opportunity to drive greater appreciation for value, quality and sustainability
STRENGTHEN RETAIL DISTRIBUTION IN-STORE AND ONLINE
▪ Baskets with frozen food are worth ~80% more than those without frozen
▪ Our market share is 40% higher online than in brick & mortar
DELIVER BREAKTHROUGH INNOVATION
▪ Continue to develop “big bet” new product launches such as Green Cuisine
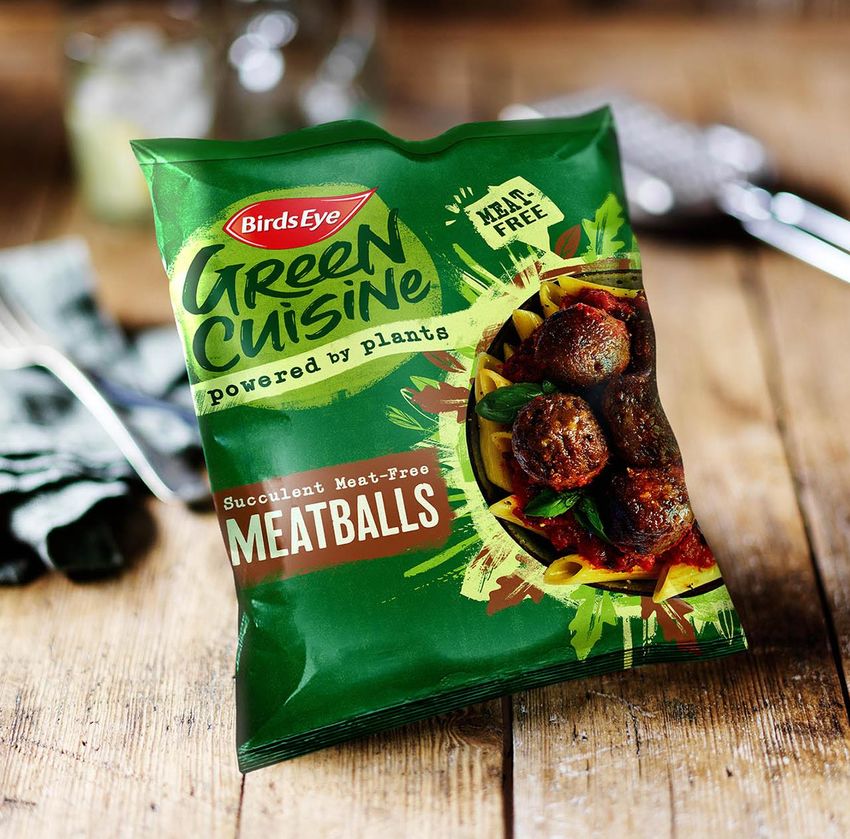
12Introduced in 2019, Green Cuisine is a New Range of
Frozen Products Powering Consumers’ Lives with Plants
• Serving consumers across all meat-free need states
• Leveraging European leadership in frozen
• New and improved recipe which is winning versus the competition
• Strong consumer-led positioning with modern and distinct design
• Supported by impactful multi-channel media investment
• Pan European launch in 2020
13Green Cuisine Adds a New and Exciting Dimension
to a Portfolio that is Already Flexitarian at Heart
Fish Vegetables Meat SubstitutesGreen Cuisine Has Expanded Across Various
Need States since Launching in the UK in 2019
15UK Market Update: Green Cuisine is Now the
#3 Brand in Frozen Meat-Free
Green Cuisine Market Share UK Frozen Meat Free
UK Frozen Meat Free Market Share
5%
Other Brands
17%
Brand A
launch 5% 37%
€245m
Retail Sales
private label Value
19%
Brand B
24%
Apr-19
Apr-20
Feb-19
Feb-20
Oct-18
Oct-19
Nov-18
Dec-18
Jul-19
Nov-19
Dec-19
Jul-18
May-18
Aug-18
Sep-18
May-19
Aug-19
Sep-19
May-20
Jun-18
Jan-19
Mar-19
Jun-19
Jan-20
Mar-20
Source: Nielsen
16Green Cuisine is a Pan-European Sub Brand Tailored
to Conform with Local Market Tastes and Preferences
FRANCE GERMANY
17Green Cuisine Will Be in 10 European Markets by July
2019
UK Ireland
Germany France Netherlands Italy
H1
2020
Spain Belgium Austria Portugal
Countries in green denote markets where Green Cuisine is
currently available to consumers.
18Green Cuisine Will be a
Significant Driver of Growth In the Coming Years
€100+ REVENUE
MILLION BY 2022
19Acquisitions Are the Primary Intended Use of Cash
CONSOLIDATE EUROPEAN FROZEN PURSUE UNIQUE OPPORTUNITIES
Across geographies, categories & channels Beyond European Frozen
QUALITY
Food
Assets
ACCRETIVE STRONG
to long-term Financial
shareholder Returns
value
LONG-TERM GOAL Generate top tier TSR by building and growing a portfolio of best in class food assets
20A Unique, Compelling and Sustainable Growth Story
within Packaged Foods
1 Consistent organic growth trajectory prior to COVID-19
2 Attracting new consumers and trial throughout the pandemic
3 Well positioned to capitalize on the shift to online
4 Breakthrough innovation in plant protein with strong momentum
5 Stabilizing commodity cost environment
6 Strong balance sheet with a focus on M&A
21QUESTIONS?
Appendix
Reconciliation of reported to organic revenue growth

                                                      Q2 To Date
                                    Q1 2020
                                                       2020 (b)
                                  YoY Growth          YoY Growth
Reported Revenue Growth             10.5%               13.0%

Of which:
- Organic Revenue Growth              7.7%               14.1%
- Acquisitions                        0.0%                0.0%
- Trading Day Impact                  3.2%                0.0%
- Translational FX (a)               (0.4%)              (1.1%)
Total                                10.5%               13.0%

                                   Q1 2019             Q2 2019             Q3 2019             Q4 2019              FY2019
                                  YoY Growth          YoY Growth          YoY Growth          YoY Growth          YoY Growth
Reported Revenue Growth             14.6%               10.2%                1.8%                2.2%                7.0%

Of which:
- Organic Revenue Growth              0.9%                3.5%                2.5%                1.7%                2.1%
- Acquisitions                       13.8%                7.0%                0.0%                0.0%                4.9%
- Trading Day Impact                  0.0%                0.0%                0.0%                0.0%                0.0%
- Translational FX (a)               (0.1%)              (0.3%)              (0.7%)               0.5%                0.0%
Total                                14.6%               10.2%                1.8%                2.2%                7.0%
(a) Translational FX is calculated by translating data of the current and comparative periods using a budget foreign exchange rate that is set
once a year as part of the Company’s internal annual forecast process
(b) During the period April 1, 2020 through May 31, 2020
                                                                                                                                                 24
Reconciliation of reported to organic revenue growth
Q1 2018 Q2 2018 Q3 2018 Q4 2018 FY2018
YoY Growth YoY Growth YoY Growth YoY Growth YoY Growth
Reported Revenue Growth 1.5% 6.6% 15.6% 21.0% 11.0%
Of which:
- Organic Revenue Growth 2.9% 1.3% 1.9% 4.2% 2.6%
- Acquisitions 0.0% 6.4% 14.7% 17.3% 9.4%
- Trading Day Impact 0.0% 0.0% 0.0% 0.0% 0.0%
- Translational FX (a) (1.4%) (1.1%) (1.0%) (0.5%) (1.0%)
Total 1.5% 6.6% 15.6% 21.0% 11.0%
Q1 2017 Q2 2017 Q3 2017 Q4 2017 FY2017
YoY Growth YoY Growth YoY Growth YoY Growth YoY Growth
Reported Revenue Growth (2.9%) 0.5% 4.4% 4.7% 1.5%
Of which:
- Organic Revenue Growth 1.1% 3.5% 5.9% 5.6% 3.9%
- Acquisitions 0.0% 0.0% 0.0% 0.0% 0.0%
- Trading Day Impact (1.7%) 0.0% 0.0% 0.0% (0.5%)
- Translational FX (a) (2.3%) (3.0%) (1.5%) (0.9%) (1.9%)
Total (2.9%) 0.5% 4.4% 4.7% 1.5%
(a) Translational FX is calculated by translating data of the current and comparative periods using a budget foreign exchange rate that is set
once a year as part of the Company’s internal annual forecast process
25You can also read