Fertilizer Outlook 2015-2019 - 83rd IFA Annual Conference Istanbul (Turkey), 25-27 May 2015 - International Fertilizer Association
←
→
Page content transcription
If your browser does not render page correctly, please read the page content below

A/15/67b
                                                                                   June 2015
                                                                                   Final Version

83rd IFA Annual Conference
Istanbul (Turkey), 25-27 May 2015

Fertilizer Outlook 2015-2019

Patrick Heffer and Michel Prud’homme
International Fertilizer Industry Association (IFA)

International Fertilizer Industry Association (IFA) – 28, rue Marbeuf – 75008 Paris – France
Tel. +33 1 53 93 05 00 – Fax +33 1 53 93 05 45/47 – ifa@fertilizer.org – www.fertilizer.org

Copyright © 2015 International Fertilizer Industry Association – All Rights Reserved
This public summary report was prepared by Patrick Heffer, Senior Director of the IFA
Agriculture Committee, and Michel Prud’homme, Senior Director of the IFA Production
and International Trade Committee. The first part looks at the global context and
agricultural situation. The second part provides global and regional fertilizer consumption
projections for the period 2014/15 to 2019/20. The third part provides projections of
fertilizer supply for the period 2015 to 2019.

This report is available to the general public on the IFA web site (http://www.fertilizer.org)
or by request to the IFA Secretariat.

The Fertilizer Outlook draws on the final versions of two reports prepared on the
occasion of the 83rd IFA Annual Conference held in Istanbul, Turkey in May 2015: the IFA
report Medium-Term Outlook for World Agriculture and Fertilizer Demand: 2014/15-
2019/20 and the IFA report Fertilizers and Raw Materials Global Supply: 2015-2019.
These two comprehensive reports are strictly reserved for IFA members.

   Copyright © 2015 International Fertilizer Industry Association - All Rights Reserved

                  Disclaimer of Liability for IFA Reports/Presentations
IFA endeavours to base its reports and presentations on accurate information, to the
extent reasonably possible under the circumstances. However, neither IFA nor its
members warrant or guarantee any information IFA publishes or presents, and they
disclaim any liability for any consequences, direct or indirect, arising from the use of or
reliance upon IFA publications or presentations by any person at any time.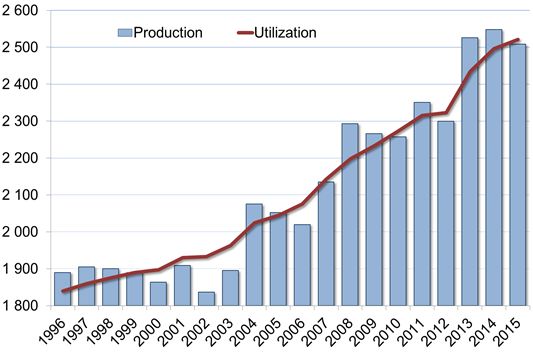
In India, the government is considering options
ECONOMIC AND POLICY                                             to improve the effectiveness of its fertilizer
CONTEXT                                                         subsidy scheme. The option that will be selected,
                                                                and when this option would enter into force,
                                                                remain unknown at this time. However, any
The world economy is progressively                              option is likely to impact growth in demand for
recovering, but remains fragile                                 urea and to rebalance the N:P:K ratio. In Sub-
                                                                Saharan Africa, firm fertilizer demand growth
Growth in world gross domestic product (GDP)                    reflects the establishment of fertilizer subsidy
remained disappointing in 2014. It is projected to              regimes in a number of countries and increasing
gain momentum from 2015, with increases of                      policy support to agricultural development. In
3.5% in 2015 and 3.8% in 2016. These                            developed countries there is a continuing
increases would reflect a robust recovery in 2015               emphasis on improving nutrient use efficiency. In
in advanced economies, which benefit from                       addition, the food industry is setting nutrient
lower oil prices. In emerging and developing                    management objectives as part of its
economies, growth would accelerate from 2016.                   sustainability standards.
In a five-year perspective the world output is
projected to expand by some 4% annually, with
rates slightly below 2% for advanced economies
and slightly over 5% for emerging and                           WORLD AGRICULTURE
developing economies. China’s GDP growth
would stabilize between 6 and 7%, while India’s
                                                                A third consecutive bumper cereal crop is
output would rise by almost 8% annually.
                                                                expected in 2015
Southeast Asia and Sub-Saharan Africa are
projected to experience growth rates above 5%.                  Favourable weather conditions in the main
Following four years of relative stability, crude oil           producing areas and still relatively attractive crop
prices dropped sharply at the end of 2014 and                   prices boosted the 2014 harvest. The world
the beginning of 2015 before rebounding in the                  cereal output in 2014 slightly surpassed the 2013
second quarter of 2015. A similar trend was                     record crop. This small increase was driven by a
observed, to a lesser extent, for a number of                   larger wheat crop. Following bumper harvests in
other commodities. This sharp fall in oil prices                2013 and 2014, world cereal inventories and
benefits oil-importing economies, but dampens                   stocks held by the major exporters rebounded
prospects in oil-exporting countries.                           sharply in 2014/15, triggering drops in cereal
                                                                prices.
Exchange rates have been subject to significant
movements during the past 12 months, with the                   In 2015, in response to declining and relatively
US dollar significantly appreciating against most               low crop prices, it is anticipated that farmers will
currencies.                                                     either reduce the area planted to cereals or
                                                                manage their cereal fields less intensively.
Among the main risks to the outlook are the                     Assuming average weather conditions and
evolution of oil prices and exchange rates,                     yields, the global cereal output is seen as
possible deflation in key markets, geopolitical                 contracting from the 2014 record. This crop
tensions in the Black Sea area and the Middle                   would still be the third largest ever. Early
East, and Greece’s potential exit from the                      forecasts point to a drop of less than 1% year-
Eurozone.                                                       on-year, as the increase in rice production would
                                                                partly offset smaller wheat and coarse grain
Policy developments will greatly influence                      crops. World demand is driven by feed and food
the outlook                                                     uses, as maize-based ethanol production in the
                                                                United States plateaus. Global cereal inventories
Policy developments are a major driver of future                are anticipated to moderately retreat in 2015/16.
fertilizer demand. In China, total fertilizer                   The cereal stock-to-use ratio at the end of the
consumption growth has been capped at 1%                        campaign would drop by one percentage point.
annually between 2015 and 2020 and no further                   With comfortable availabilities in the main
growth will be permitted beyond 2020. In view of                exporters, cereal prices are expected to remain
China’s share of world fertilizer consumption                   low compared to those in recent history.
(~30%), this change is expected to strongly
influence the global outlook.

                                       rd
                                       83 IFA Annual Conference, Istanbul, May 2015
                             “Fertilizer Outlook 2015-2019” P. Heffer and M. Prud’homme, IFA

                                                          -1-
World Cereal Production Supported by fairly attractive crop prices in the
and Utilization (million tonnes) first half of 2014, world consumption in 2014/15
is seen as up by 2.0% year-on-year, to 185
million tonnes (Mt) nutrients. Gains are expected
for all three nutrients: nitrogen (N) consumption
would rise moderately, by 1.3%, to 111.8 Mt;
phosphorous (P) consumption would rebound,
by 2.5%, to 41.3 Mt; and potassium (K)
consumption is seen as firmly up, by 4.2%, to
31.5 Mt. Aggregate consumption in 2014/15 is
anticipated to retreat in Eastern Europe &
Central Asia and in West Asia, as a result of
regional geopolitical tensions and weaker
economic performance. Due to declining crop
Source: FAO, May 2015 prices, consumption is also seen as contracting
in North America and Western & Central Europe.
International oilseed, sugar, cotton and biofuel It would increase in the rest of the world, with the
prices are also under pressure, reflecting strongest growth rates in Oceania and Africa. In
abundant supplies of all the main crop volume terms, the largest drop in consumption is
commodities. Meat and dairy prices are following anticipated in North America. Sizable volume
a downward trend, as well. increases are seen in East Asia, South Asia and
Latin America.
Agricultural markets are projected to tighten
in the medium term The outlook for 2015/16 is less positive,
reflecting low agricultural commodity prices
Production of cereals and oilseeds is projected relative to recent history. Global fertilizer demand
to expand steadily from 2016/17, with higher in 2015/16 is forecast to expand by 1.0% year-
growth rates for soybean and maize vs. wheat on-year, to 186 Mt. P demand would continue its
and rice. Yield improvements would dominate rebound (+1.1%, to 41.8 Mt). Following
the outlook. Some area expansion is seen in consecutive years of strong growth, demand for
countries with abundant land and water K would rise more modestly, by 0.8%, to 31.8 Mt.
resources, such as Brazil, Indonesia and Russia. Growth in N demand would be moderate, rising
by 1.0% to 112.9 Mt. Fertilizer demand would
Larger feed uses in developed and emerging
increase in all the regions but Oceania and Latin
economies, and food uses in least developed
America, where it would slightly retreat in
countries, are seen as driving future expansion
response to low crop prices. Assuming an
of cereal and oilseed utilization. Industrial uses,
improving geopolitical and economic context,
which have been the main driver of cereal
demand would rebound slightly in West Asia and
utilization during the past decade, would grow at
Eastern Europe & Central Asia. It would also
a comparatively slow pace since cereal-based
partly recover in North America and Western &
ethanol production is expected to rise only
Central Europe. Continuous growth is seen in all
modestly over the outlook.
the other regions. The main changes in volume
World inventories and stock-to-use ratios are are anticipated in South Asia, East Asia and
projected to contract for all commodities, from a North America.
high starting point in 2014/15. The largest drops
are anticipated for maize, soybean and cotton. Short-term Forecasts for
World Fertilizer Demand (Mt nutrients)
With prospects for progressively tighter market
N P2O5 K2O Total
conditions, international cereal prices might
12/13 108.1 41.6 29.1 178.8
slightly firm over the outlook but would remain 13/14 110.4 40.3 30.2 180.9
low in view of the large availabilities. 14/15 (e) 111.8 41.3 31.5 184.6
Change +1.3% +2.5% +4.2% +2.0%
15/16 (f) 112.9 41.8 31.8 186.5
Change +1.0% +1.1% +0.8% +1.0%
FERTILIZER DEMAND (e): estimate; (f): forecast
Source: P. Heffer, IFA, June 2015
World fertilizer demand is seen as rising
steadily in 2014/15 and 2015/16
rd
83 IFA Annual Conference, Istanbul, May 2015
“Fertilizer Outlook 2015-2019” P. Heffer and M. Prud’homme, IFA
-2-Global fertilizer demand is anticipated to In volume terms, South Asia, East Asia and Latin
reach 200 Mt in 2019/20 America would account for 27, 25 and 23%,
respectively, of the global increase in fertilizer
The medium-term outlook for agriculture is demand. Africa would contribute 9% of global
mixed, starting with high inventories and low expansion.
prices for the main agricultural commodities.
Assuming average weather conditions and no Medium-term Outlook for
major economic or policy changes, it may take a Total Regional Fertilizer Demand (Mt nutrients)
few years before stock-to-use ratios fall back to
more favourable levels and agricultural
commodity prices recover. The current context is
not very conducive for boosting fertilizer
demand, at least in the next two to three years.
Under the baseline scenario, world demand
would rise on average by 1.7% per annum (p.a.)
between the base year (average of the 2012/13
to 2014/15 campaigns) and 2019/20. Aggregate
global demand is projected to reach 200 Mt at
the end of the outlook period. K demand would
expand firmly (2.6% p.a. to 35.3 Mt); P demand
would grow more moderately (1.8% p.a. to 45.7
Source: P. Heffer, IFA, June 2015
Mt); N demand growth rates would continue to
decline progressively (1.3% p.a. to 119.2 Mt),
The forecast remains subject to major
reflecting N use efficiency gains in developed
uncertainties
countries and China.
Medium-term Forecasts for
IFA’s baseline forecast is subject to a number of
World Fertilizer Demand (Mt nutrients) uncertainties, in particular the evolution of the
N P2O5 K2O Total world economic context, weather-related crop
Av. 2012/13 shortfalls, the evolution of agricultural commodity
110.1 41.1 30.3 181.4 prices and of fertilizer prices relative to crop
to 2014/15 (e)
2019/20 (f) 119.2 45.7 35.3 200.2 prices, the evolution of the biofuel mandates, the
Av. Annual evolution of fertilizer subsidy regimes, and new
+1.3% +1.8% +2.6% +1.7%
Change policies aimed at increasing nutrient use
Source: P. Heffer, IFA, June 2015 efficiency and recycling of organic nutrient
sources.
The highest growth rates are found in Africa
(4.4% p.a.), especially in Sub-Saharan Africa1
(6.3% p.a.), where the policy and economic
environment in a number of countries is
stimulating demand. Demand would continue its
FERTILIZER SUPPLY
rapid expansion in Latin America (3.0% p.a.),
where the cropped area is increasing steadily, World fertilizer demand in 2014 showed a
and in South Asia (3.0% p.a.), where P and K modest increase. Fertilizer consumption was
demand is progressively recovering from its robust in East Asia, Latin America and Africa.
sharp retreat in 2011/12 and 2012/13. Demand Lower demand was seen in North America,
is also seen as rebounding in West Asia (2.9% Europe and West Asia, while demand remained
p.a.) and Eastern Europe & Central Asia (2.0% static in South Asia.
p.a), assuming easing geopolitical tensions. East
Meanwhile, fertilizer supply flourished, as global
Asian fertilizer demand growth continues to
production and trade reached record levels to
decelerate compared to the historical trend
meet world demand but also to replenish
(1.0% p.a.), reflecting China’s new policy of
distribution pipelines.
capping annual increases at 1% p.a. between
2015 and the end of the decade. Demand in The main exogenous factors impacting global
developed economies is forecast to evolve supply in 2014 were natural gas supply
marginally. shortfalls, rising uncertainties related to trade
measures, and the massive drop in energy
prices. Global fertilizer consumption in 2015
would show modest growth.
1
Not including South Africa.
rd
83 IFA Annual Conference, Istanbul, May 2015
“Fertilizer Outlook 2015-2019” P. Heffer and M. Prud’homme, IFA
-3-Global nutrient sales for all uses in 2014 were Nitrogen Outlook
estimated at 240 Mt nutrients, increasing 1%
over 2013. On average, the fertilizer industry Large ammonia capacity increases are
operated at 80% of installed capacity. expected in East Asia and Africa
Global fertilizer demand to grow by 1.5-2% Global ammonia capacity is projected to grow by
per annum in the next five years 16% compared with 2014, to 250 Mt NH3 in
2019. The main additions to capacity will be in
In the medium term, global fertilizer consumption East Asia (China, Indonesia), Eastern Europe &
would grow moderately at an annual rate of Central Asia (Russia), North America (the United
1.7%, to reach 199.4 Mt nutrients in 2019. States) and Africa (Algeria, Egypt, Nigeria).
Increases are projected for all three major
nutrients, with average annual growth rates of Modest growth of seaborne ammonia supply
1.3% for N, 2.1% for P and 2.4% for K.
Global seaborne ammonia availability in 2019
Total sales in the fertilizer and industrial sectors may increase 2% compared with 2014, to
in 2019 are forecast at 264 Mt nutrients, 18.8 Mt, assuming a gradual ramp-up of new
representing a 10% increase over 2014. capacity and completion of planned projects. The
integration of new downstream capacity would
Massive societal benefits: investments in reduce global seaborne ammonia availability in
new capacity will secure future fertilizer 2015 and 2016.
supply while creating employment
Firm demand in nitrogen industrial segments
Investments by the fertilizer industry will increase
and sustained fertilizer consumption in East
global fertilizer nutrient capacity, generate
Asia, South Asia, Latin America and Africa
thousands of temporary construction jobs, and
support global nitrogen consumption in the
create permanent direct and indirect
near term
employment. Between 2014 and 2019, the
fertilizer industry will invest close to Global nitrogen supply in 2019 is projected at
US$125 billion in more than 235 new capacity 174 Mt N and demand at 157 Mt N. Significant
units, increasing global capacity by over growth in demand would occur in East Asia
165 million tonnes products. IFA estimates that (+8.5 Mt N), South Asia (+2.7 Mt N) and Latin
worldwide, close to 1.4 million persons are America (+1.4 Mt N). In Africa, total demand
employed in the fertilizer sector. Over the next would show a substantial increase of 19%
five years, investments by the fertilizer industry compared with 2014, driven by rising fertilizer
would create more than 45,000 direct and consumption (4% per annum). Global industrial
95,000 indirect jobs. nitrogen demand is projected to expand overall
by 28% between 2014 and 2019, compared with
Global diversification leading to extra- a 6% increase in the fertilizer sector.
regional partnerships
Supply growth to exceed growth in nitrogen
Opportunities exist for margin expansion through
demand during the next five years
global diversification. Following in the steps of
large fertilizer companies in North America and Global potential supply would be more than
Europe, large companies in other regions are adequate to meet growing demand. Potential
now investing in Africa, Latin America and even annual surpluses would accelerate from 10 Mt N
China to expand their own diversification and in 2016 to 18 Mt N in 2019.
integration through strategic alliances.
Under a slow-growth supply scenario, global
Regions with strong resource competitiveness potential nitrogen supply would grow at 2.6% per
factors are expanding their production capacity annum, reaching 171 Mt N in 2019 compared
(North America, Eastern Europe & Central Asia, with the base-case level of 174 Mt N. The
West Asia, and North Africa). In large fertilizer- potential surpluses would remain stable during
consuming regions, extra-regional partnerships the period from 2017 to 2019 at around 14 Mt N,
are being developed with local producing and equating to 9% of potential supply.
distribution entities (Africa, Latin America).
rd
83 IFA Annual Conference, Istanbul, May 2015
“Fertilizer Outlook 2015-2019” P. Heffer and M. Prud’homme, IFA
-4-New urea capacity emerging in East Asia, Phosphate Outlook
Africa and North America
A large supply of phosphate rock emerging
Urea was the major component of nitrogen
in a few countries in Africa and West Asia
production in 2014, representing 55% of total
nitrogen output. Over the next five years, it is Global phosphate rock supply would grow 16%
estimated that urea will contribute 72% of the compared with 2014, to 255 Mt in 2019.
projected ammonia capacity increment. Together, it is estimated that Morocco,
Close to 60 new units are planned to come on Saudi Arabia, Jordan and China will account for
stream between 2014 and 2019, of which 20 80% of this 35 Mt increment.
would be located in China.
Growing phosphoric acid capacity in three
Most of the global increment post-2016 will occur exporting countries
outside China, in countries well-endowed with
natural gas reserves. Global phosphoric acid capacity in 2019 is
projected at 62.9 Mt P2O5, representing a net
Global urea capacity would increase by a net
increase of 7.8 Mt over 2014.
44 Mt between 2014 and 2019, to 252 Mt. This
corresponds to a compound annual growth rate Between 2014 and 2019, a total of 30 new acid
of 4%. On a regional basis, three regions will units would be put on stream, of which three-
account for two-thirds of the overall capacity quarters would be outside China.
growth. East Asia would contribute 35% of the
net increase in capacity, followed by Africa Large capacity additions would occur in
(18%) and North America (15%). Morocco, Saudi Arabia, China and Brazil.
The global supply of phosphoric acid is
Global urea supply is estimated at 179 Mt in estimated at 51.1 Mt P2O5 in 2019, increasing
2014 and 211 Mt in 2019, growing at a projected 2.5% per annum between 2014 and 2019.
average annual rate of 3.5% over 2014.
Moderate demand growth and a stable
Strong demand growth in urea industrial potential balance in the near term
uses, and sustained growth in agriculture
Global phosphoric acid demand is forecast to
Global demand for urea for all uses is forecast at grow at an annual rate of 2.4% compared with
198 Mt in 2019, increasing 32 Mt compared with 2014, to 48.3 Mt P2O5 in 2019. Global
2014 or at a 3.6% average annual growth rate phosphoric acid supply/demand potential
during the next five years. A significant increase conditions show stable potential balance in the
in urea fertilizer demand is seen in South Asia, short term, and a moderately growing potential
while industrial urea use would expand in East surplus in late 2018/early 2019.
Asia (China) and Europe.
A slow-growth supply scenario shows a
reduction in potential supply of 0.6 Mt P2O5 in
A soft balance in the short term, moving to
2019, leading to a possible surplus of less than
potential growing surpluses in the long term
2.3 Mt P2O5, equating to 4% of potential supply
During the next five years, the potential surplus in 2019.
would decline between 2014 and 2018 as global
demand growth exceeds supply growth. In 2019, Massive capacity expansions over the next
the emergence of large capacity and supply five years, with most being export-oriented
would lead to growing surpluses in the longer
Close to 30 new units for processed phosphates
term.
are planned between 2014 and 2019. Together,
A slow-growth scenario would suggest a static China and Morocco will account for half of these
potential surplus between 2016 and 2019, plants. Other plants will be realized in
averaging 8.8 Mt/a urea and equating to 4% of Saudi Arabia, Brazil and India.
potential supply.
Global capacity for the main processed
phosphate fertilizers would grow by 7.1 Mt P2O5
between 2014 and 2019, to 50.4 Mt P2O5. The
expansion of DAP capacity will account for the
bulk of this increase, but these new plants could
shift production to other phosphoric acid-based
fertilizers.
rd
83 IFA Annual Conference, Istanbul, May 2015
“Fertilizer Outlook 2015-2019” P. Heffer and M. Prud’homme, IFA
-5-Potash Outlook Sulphur Outlook
Major brownfield projects and four new A new supply of exportable sulphur in West
mines to come on stream between 2015 and Asia and lower import demand in the United
2019 States
Potash capacity will continue to expand at a Global production of elemental sulphur in 2019
rapid rate compared with 2014, as most projects would grow by an overall 27% compared with
initiated in the 2008-2012 period are now being 2014 (+15.2 Mt), to 70.8 Mt S, on account of
commissioned. About 25 expansion projects are higher sulphur recovery in the oil and gas
being carried out by established producers for sectors.
completion between 2015 and 2019. Four large
Large increases of exportable output are
greenfield projects are planned for completion by
projected in Abu Dhabi, Qatar, Russia,
2019 in Canada, Russia and Belarus. Global
Saudi Arabia and Turkmenistan. In the United
potassium capacity is forecast to increase 16%,
States, increased sulphur production would
from 52.2 Mt K2O in 2014 to 60.8 Mt in 2019.
reduce import demand in the near term.
North America and Eastern Europe & Central
Firm sulphur demand in industrial sectors,
Asia to account for 70% of world incremental
and moderate growth in the fertilizer sector
potash supply between 2014 and 2019
Global consumption of elemental sulphur is
Global potential potassium supply would
projected to grow at an annual rate of 3.3%
increase to 51.8 Mt K2O in 2019, representing an
compared with 2014, to 67.7 Mt S in 2019.
overall increment of 9 Mt, or 21% growth
compared with 2014. Three regions will account This increase is driven by firm demand growth
for the bulk of supply growth: North America for sulphuric acid in industrial segments and
(Canada) will contribute 7 Mt K2O, followed by moderate growth in the fertilizer sector.
Eastern Europe & Central Asia (Russia,
Belarus), with a net 1 Mt, and East Asia (China) Supply/demand deficit moving to a potential
with 1 Mt. growing surplus in the near term
Moderate potash demand growth over five Global supply of elemental sulphur would grow
years by an overall 27% during the next five years,
compared with 16% in the case of global
Global potassium demand for all uses would demand. The global supply/demand situation
reach 39.5 Mt K2O in 2019, representing an shows a marginal deficit in 2015, moving to a
average annual growth rate of 2.5% between growing surplus in the near term and reaching
2014 and 2019. 3 Mt S in 2019.
Short-term equilibrium moving towards a When taking into account historical slippage on
growing surplus in the long run projected supply, a slow-growth supply scenario
shows a growth rate of 4.5% per annum over
Global supply growth will exceed growth in 2019, resulting in a marginal surplus in 2016 and
demand in the long term. A moderate expansion 2017 followed by an acceleration to 1.8 Mt S by
of the prevailing surplus will continue until 2016; 2019.
by 2017, the global potential surplus would
accelerate as a result of the planned
commissioning of new large-capacity projects.
Under a slow-growth scenario, the five-year
global supply and demand would show relatively
stable potential surpluses of 8-9 Mt K2O in 2015
and 2016 and, by 2017, increase gradually to
11 Mt in 2019.
rd
83 IFA Annual Conference, Istanbul, May 2015
“Fertilizer Outlook 2015-2019” P. Heffer and M. Prud’homme, IFA
-6-You can also read