Trends in and outlook for the global and South African economies - Jorge Maia Head: Research and Information 6th CSIR Conference: Ideas that work ...
←
→
Page content transcription
If your browser does not render page correctly, please read the page content below
Trends in and outlook
for the global and
South African
economies

Jorge Maia
Head: Research and Information

6th CSIR Conference: Ideas that work
for industrial development

5 October 2017
Presentation layout

• Global economy: Developments and outlook

• South African economy:
   − Recent developments
   − Outlook

                                             2
Global economy:
Developments and outlook

                           3
Global economy:
  Expected developments

• World economy’s pace of expansion is expected to increase and become more broad-based in MT,
  but still below pre-GFC average. Global growth to be sustained at a relatively higher level over MT.
• Higher fixed investment activity globally to address back-logs. Global FDI flows rise, benefitting both
  advanced economies and emerging markets.
• Moderate inflationary pressures, gradual normalization of monetary policies.
• Trading relationships between major economic powers likely to be altered to some extent.
                                                                          Contributions to world GDP growth
                                              6
                                                                 EU                      Sub-Saharan Africa
                                                                 USA                     China                                       Forecast
                                                                 Japan                   Other
                                              5                  World (GDP growth)
                % share in world GDP growth

                                              4

                                              3

                                              2

                                              1

                                              0

                                              -1
                                                   2010   2011    2012     2013       2014   2015    2016     2017   2018   2019   2020   2021   2022
                  Source: IDC, compiled from IMF data

                                                                                                                                                        4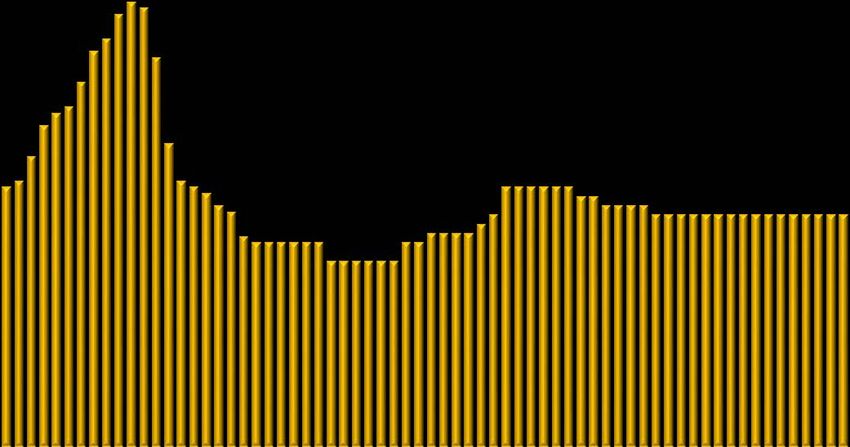
Global economy:
Outlook for key economies from an SA perspective
Africa (excluding SA):
United States European Union
Moderate economic recovery over ST on the back of improving global demand.
Japan
Growth sustained at modest pace (around Moderate growth supported by higher confidenceconditions
levels, which
2% p.a.), with Progressively higher export performance, supported abylow
improving trajectory. in
Select SAconsumer & investment
FDI stock source by underpin Economy
increased still
spending stuck & in
investment growth
activity
spending region/country
as key drivers. commodity markets.
in 2015
ECBactivity,
starts to Export
unwind performance
quantitative coming toraise the fore as rates
a driver
as of
Low
Otherinflationary pressures, gradual policy
Increased investment including
growth, inward
with FDI. easing,
stimulatory
policy
measures also supporting
inflation environment normalises
rate hikes.
regions: Improving growth performancevery andmodestly
macroeconomic positive balances
outcomes. (fiscal & trade
7% balances) over MTPaceto LT of growth sustained and broad-based over MT to LT
Increased spending on infrastructure and LT growth muted due to structural constraints.
high levels of employment will support Reduced liquidity constraints
Trade China
performance
in several affected
economies by Brexit
over and
MT changing
to LT trade
economic expansion. relations with USA
Japan contributes
Restructuring of economy 6.6% of global GDP.
continues.
US contributes 24.7% of global GDP. Africa (excl. SA) contributes 2.5%
Growth Japan of accounts
global GDP for 4.0%
EU contributes deceleration
21.8% of global GDP ofout,
bottoming world trade. at lower
stabilising
US accounts for 9.1% Selectof world trade.
regions/ Africa (excl. SA) accounts for but nonetheless
1.7%
Japan ofisworld sturdy rates.
trade of 10% of global FDI outflows.
theofsource
countries:
EU accounts for 33.7% world trade
US is the source of almost 21% of global Africa (excl. SA) is the Rising
source of wealth
only levels,
1.0% increased
forglobal
of FDI consumption
outflows spending.
93% EU is thesource Destination
of just over around 4.6%
32% of global ofFDISAoutflows
exports.
FDI outflows. Destination for 27.8%ofWage inflation
Destination
SA total
Sourcefor 22.6% of further
exports,just
of SA
39% dents
over of
2.4%
exports
competitiveness
SA manufactured
of FDI stock in ofexports.
low-value
SA.
Destination for 7.3% of SA exports. Source of 3.2% of FDI stock in SA
industries, but higher-tech expanding rapidly.
Europe is the sourcemeasures
Deleveraging of ca. 78.3% of FDI stock activity.
in SA
Source of 6% of FDI stock in SA. Japan: real affect
GDPinvestment
growth
Select export destinations share of 6.0 Trade relations with USA may be altered to some extent,
SA export basket
USA: in 2016 China:
real GDP real GDP growth
growth Rest of Africa
EU: real : real
GDP GDP growth
growth
16.0 8.0 5.0
affecting export performance and inward FDI.Forecast
5.0 4.0
Forecast Forecast
4.0 14.0 Forecast 7.0 4.0 Forecast
2.0 China contributes 14.9% of global GDP.
3.0 12.0 6.0 3.0 % growth
Other 2.0 China accounts for 13.1% of world trade.
2.0 10.0 5.0 0.0 China is the source of almost 13% of global FDI outflows.
% growth
% growth
regions:
1.0
% growth
% growth
1.0 28%
8.0 4.0
Select regions/ 0.0 Destination of 9.3% of SA exports, source of 18.1% of
-2.0
0.0
6.0 countries: 3.0-1.0 SA imports
-1.0 72%
-4.0
-2.0
4.0 2.0 Source of almost 3% of SA FDI stock.
-2.0 -3.0
2.0 1.0-4.0
-6.0
-3.0 2000 2002 2004 2006 2008 2010 2012 2014 2016 2018 2020 2022
-4.0 0.0 0.0 -5.0IDC, compiled from IMF data
Source:
2000
2000 2002 2004 2002
2006 2004
2008 2006
2010 2008
2012 2010
2014 2012
2016 2014
2018 2016
2020 2018 2020 2022 2000
2022 2002
2000 2004
2002 2006
2004 2008
2006 2010
2008 2012
2010 2014
2012 2016
2014 2018
2016 2020
2018 2022
2020 2022
Source: IDC, compiled from IMF data Source: IDC, compiled
Source: from from
IDC, compiled IMF data
IMF data
Source: IDC, compiled from IMF data
Source: IDC, compiled from IMF (GDP at market exchange rates), UNCTAD (Trade and FDI), SARS (SA trade 2016) and SARB (SA FDI 2015) data 5Global economy:
Risks associated with socio-political order
Global political order being challenged Geopolitical tensions escalating
• Major shifts occurring in the global political landscape: in traditional trouble-spots (Middle East, Korean
peninsula, Ukraine etc.), threatening world peace,
o Strong tendency towards a multi-polar world leading to mass migrations
o Inward-orientation and often confrontational stance of .
the Trump administration are fast eroding the traditionally
dominant position of the United States Terrorism on the rise
o Increasing contestation for primary global power taking unprecedented forms, becoming more
positioning and influence by countries/regions such as regionally widespread and indiscriminate, resulting in
China, EU and Russia numerous casualties
• Strong nationalist tendencies gaining strength in parts of
the world (US, Russia, China, UK, Turkey etc.), generally Religious conflict intensifying
characterized by unusually inciting and confrontational
leading to intra- as well as inter-regional tensions,
rhetoric at leadership level
reduced cooperation and security threats
• Regionalism under increased scrutiny, specifically the
distribution of benefits within regional blocs and, in the case
of the EU, the increased concentration of regulatory and Social unrest proliferating
economic power at the centre (Brussels)
due to rising inequality, youth populations increasingly
• Globalisation being widely challenged around the globe, dissatisfied with politico-economic order (esp. lack of
leading to calls for limiting its reach / pulling back / reforming job opportunities, corruption), with communication
global frameworks for a fairer distribution of benefits and to facilitated by social media
address negative repercussions
• Worrying signs of deteriorating commitments to global
cooperation Cyber attacks increasing
targeting governments, corporates and individuals,
• Divides between North-and-South, as well as between East- becoming more damaging, as well as harder to detect
and-West are becoming more pronounced and prevent 66South African economy:
Recent developments
7South African economy:
Out of technical recession, but ST prospects
remain weak
• SA’s economic performance rebounded in Q2 2017, with GDP growth of 2.5% on a
quarterly basis. Although the economy is out of a technical recession, the recovery
comes off a very low base.
• Agriculture was the main contributor (+0.7 of a %-point) due to the largest maize crop
on record. Excluding agriculture, real GDP would have risen by 1.6% in Q2 2017.
Real GDP growth
6
4
2
% Change (q-o-q)
0
-2
-4
-6
Recession
-8
Q1 Q3 Q1 Q3 Q1 Q3 Q1 Q3 Q1 Q3 Q1 Q3 Q1 Q3 Q1 Q3 Q1 Q3 Q1
2008 2009 2010 2011 2012 2013 2014 2015 2016 2017
Source: IDC, compiled from SARB data
8South Africa economy:
Higher output recorded across most broad
sectors
• Agriculture output supported by best maize crop on record, estimated at 16 million tons.
• Manufacturing output growth rebounded to 1.5% (q/q), following 3 consecutive quarterly
contractions. However, manufacturing output growth was still negative y-o-y in H1 2017.
• The tertiary sectors in general recorded higher growth, albeit from a very low base.
Real GDP growth by sector in Q2 of 2017
40
35
30
% Change (q-o-q)
25
20
15
10
5
0
-5
Agricul- Electri- Mining Finance & Transport Manufac- Personal Trade & Construc- Govern-
ture city business & turing services accomm. tion ment
services communi-
cation
Source: IDC, compiled from Stats SA data
9South Africa economy:
Manufacturing sector still under strain
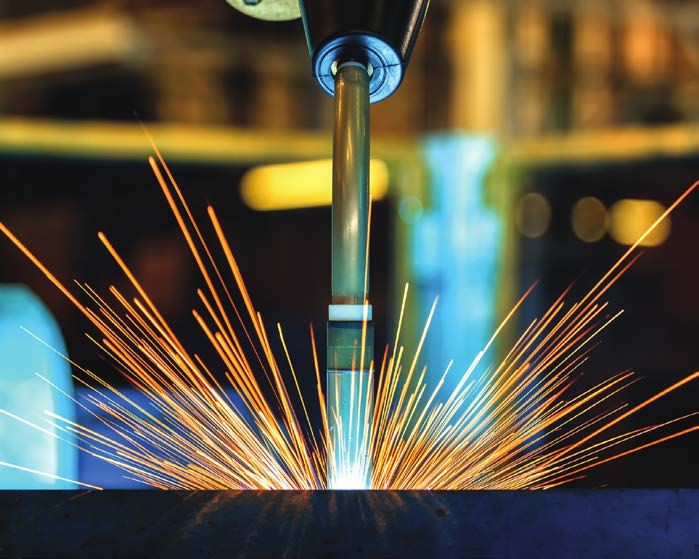
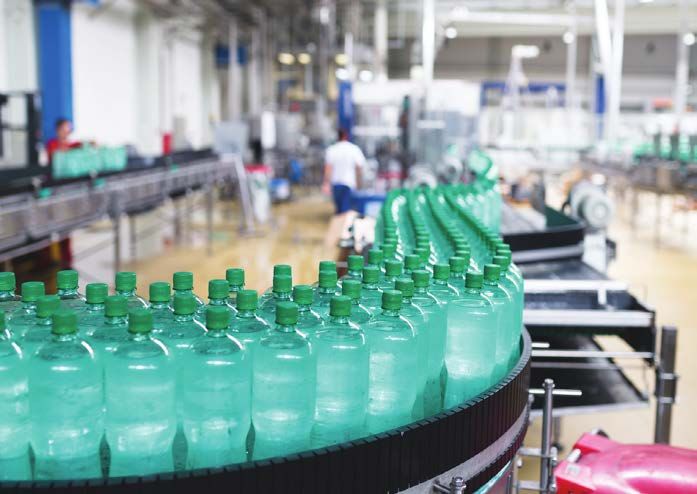
• Rebound in manufacturing output in Q2 2017 mainly due to strong rise in the production
of food & beverages, transport equipment, and TV, radio and communication equipment.
• Although output recovered quite strongly, the sector is still facing serious challenges.
• After falling to its worst level since 2009 in July, the manufacturing PMI recovered
slightly in August 2017, to a reading of 44 points.
Manufacturing performance by sub-sector
40
2016 Q3 2016 Q4 2017 Q1 2017 Q2
30
20
% Change (q-o-q)
10
0
-10
-20
Note: Growth rates are annualised
-30
Total Food & Textiles & Wood & Chemicals Non-metallic Metals & Electrical Radio & Transport Furniture &
Manufac- beverages clothing paper (12.7%) (22.1%) mineral machinery machinery TV (1.4%) equip. (7.4%) other
turing (24.4%) (3.2%) products (19.6%) (1.7%) industries
(3.9%) (3.6%)
Source: IDC, compiled from Stats SA data
10South African economy:
Mining showing some recovery, but challenges remain
• Mining sector showed some resilience in H1 2017, posting 5.1% growth y-o-y (this
followed a 4.3% contraction in output in 2016).
• Gold production continues on a long-term declining trend, while coal and PGMs output
dropped slightly in H1 2017 (y-o-y).
• Iron ore, chrome, copper and manganese production rebounded, albeit from very low
bases, but demand conditions remain largely unfavourable.
Trend in mining sector's volume of production
104
102
100 Q2 2017
Index: 2010 = 100
98
96
94
92
Note: 6-month moving average
90
2008 2009 2010 2011 2012 2013 2014 2015 2016 2017
Source: IDC, compiled from Stats SA data
11South African economy:
Consumer spending showing some resilience, but
challenges remain
• Although retail sales recovered in
Retail trade sales and consumer confidecne
15 30 Q2 2017, growth in H1 2017 stood
Retail trade sales
at only 0.6% (y-o-y).
Consumer confidence (Rhs)
10 20
• Consumer confidence remains low,
disposable incomes are growing at
% Change (y-o-y)
Q2 2017 a subdued pace, debt levels are still
Net balance
5 10 high, and employment prospects
are unsatisfactory. Weak economic
climate will continue to affect ability
0 0
and willingness of consumers to
spend.
-5 -10 • Recent downtrend in inflation and
lowering of repo rate (25 bps at the
MPC meeting of 20 July 2017)
-10 -20
2005 2006 2007 2008 2009 2010 2011 2012 2013 2014 2015 2016 2017 should, however, provide some
Source: IDC, compiled from Stats SA data
relief to consumers.
12South African economy:
Fixed investment activity still declining
• Fixed investment spending by the private sector has been declining in real terms since
2015, contracting by 1.4% in 2015, by 6.8% in 2016, and declining further in H1 2017.
• This has been in line with falling business confidence over an extended period to very
low levels at present.
• Weak investment activity not only affecting current economic growth, but also the
productive capacity of the economy, in the process limiting its future growth potential.
Private sector fixed investment and business confidence
100 25
Business confidence (Index)
90 20
Private sector GFCF (% change)
80 15
70 10
% Change (y-o-y)
60 5
Index
50 0
40 -5
30 -10
20 -15
10 -20
0 -25
Source: IDC, compiled from BER data
13South African economy:
Poor prospects for investment in manufacturing
• In real terms, fixed investment in manufacturing in 2016 was at a 7-year low.
• Subdued demand, locally and in global markets, has resulted in excess production
capacity in many industries, thus not justifying any additional fixed investment for
expansion of productive capacity. Supply-side constraints, especially cost pressures and
infrastructure-related challenges also impacted on private sector investment decisions.
• Manufacturers’ expectations of their investment spending in machinery and equipment
in 12-months’ time has deteriorated.
Manufacturing : Expected business conditions in 12 months' time
80
60
40
Net balance
20
0
-20
-40
Q2 of 2017 - worst reading on record
-60
1988 1990 1992 1994 1996 1998 2000 2002 2004 2006 2008 2010 2012 2014 2016
Source: IDC, compiled from BER data
14South African economy:
Export sector performance
• After making significant contributions to overall export growth in the past 2 years,
manufactured exports were under pressure in H1 2017. This was largely due to lower
export sales of motor vehicles, parts & accessories, but also machinery & equipment;
processed food; TV, radio & communication equipment; and electrical machinery.
• Mineral production and exports rebounded in H1 2017, albeit off a very low base.
Broad sector contributions to real growth in SA’s merchandise exports
8
Agriculture
6
Mining
4
Manufacturing
% Share
2
Other (incl.
0 electricity)
Total exports
-2
-4
2011 2012 2013 2014 2015 2016 2017 H1
Annualised
Source: IDC, compiled from SARS and Quantec data 15South African economy:
Export performance by global market
• The EU as an external market has contributed positively to the overall growth (in real
terms) in SA’s merchandise exports from 2014 to H1 2017.
• In contrast, the drop in exports to the USA and some members of the Southern African
Customs Union (SACU) in 2016 as well as in the 1st half of 2017 implied negative
contributions (i.e. detractions from overall export growth).
Contribution to real merchandise export growth by country and region
8
China
6 United States
EU
4
SACU
% Share
2 Japan
India
0
Other Africa
-2
Other
-4 Exports to world
2011 2012 2013 2014 2015 2016 2017 H1
Annualised
Source: IDC, compiled from SARS and Quantec data
17South Africa economy:
Government finances in the spotlight
• The fiscal deficit has remained large
Government's gross loan debt
at an average of 3.5% of GDP over 70
Forecast
past 4 financial years.
60
• Revenue squeeze and need to
contain expenditure requiring fine
50
balancing act to maintain fiscal
% of GDP
sustainability.
40
• Government debt is being closely
monitored by the credit rating 30
agencies, which are also concerned
with the high and rising govt. 20
guarantees to financially vulnerable Total gross loan debt: Budget 2017
SOEs. 10
Total gross loan debt, incl. guarantees
• Gross loan debt stood at R2.3
trillion in June 2017 – more than Source: IDC, compiled from SARB , Budget Review data Fiscal year to March:
double the figure of 6 years ago.
• Higher government debt resulting in
rising debt-servicing costs (fastest
growing fiscal expenditure item in
recent years, accounting for 11.2%
of total expenditure in 2016/17).
19South African economy:
Employment losses in a low-growth environment
• SA economy’s labour absorption
Change in employment : Q2 2017 vs Q1 2017 capacity has worsened, with its weak
Total employment performance having taken a toll on job
creation.
Trade, catering & accommodation
• The formal and informal sectors
recorded 113 000 job losses in Q2
Finance & business services
2017 (q-o-q), with most sectors
Manufacturing reporting lower employment.
Electricity, gas & water • Manufacturing sector now employs
Private households 15% or 310 000 fewer people than in
2008.
Other
Community, social & personal services
• Economy has only managed to add
1.7 million additional jobs since 2008
Transport, storage & communication
(an average of 175 000 new jobs p.a.).
Mining
• Unemployment rate remained at
Agriculture, forestry & fishing 27.7% in Q2 2017 (6.2 million people
Construction unemployed).
-125 -100 -75 -50 -25 0 25 50 75 • Subdued growth prospects in the
Source: IDC, compiled from Stats SA data Change in number ('000) (q-o-q) short- to medium-term do not bode
well for a meaningful recovery in
employment creation.
20South African economy:
Outlook
21SA economic forecasts:
Inflation and interest rates expected to moderate
• CPI peaked at an average of 6.6% in Q4 2016 (6.3% for 2016 as a whole). It is
estimated to decline to an average of 5.6% for 2017 and forecast at 5.1% in 2018.
• Lower food prices, subdued domestic demand and a stronger ZAR are likely to underpin
this improved performance.
• Subdued inflation environment provides scope for accommodative monetary policy. The
repo rate may thus be lowered by 25 bps in Q1 2018, followed by another drop of 25 bps
in Q1 2019 if the outlook for inflation remains relatively more benign.
Consumer price inflation and the Repo rate
14 14
Forecast
12 12
10 10
CPI : % Change (y-o-y)
Repo rate (%)
8 8
6 6
4 4
2 Repo rate (Rhs) 2
CPI: Targeted inflation measure
0 0
Source: IDC, compiled from SARB, Stats SA data, IDC forecasts
22SA economic forecasts:
Household spending under pressure
• A difficult consumer environment should persist over the short-term, affecting the ability
and willingness of households to raise their spending.
• Confidence remains low, disposable incomes are forecast to rise very gradually in
2017/18, debt levels are still high, and demand for credit is unlikely to gain momentum
as households attempt to restore their balance sheets.
• Spending on durable items (e.g. motor vehicles, furniture) will be most affected.
Household consumption expenditure
20
15
10
% Change (y-o-y)
5
0
-5
-10
-15 Total spending
-20 Durable goods
23SA economic forecasts:
Fixed investment expected to recover in the
medium-term
• Prevailing uncertainty regarding political developments, subdued economic growth and the risk of
further credit rating downgrades are weighing heavily on investor and business confidence.
Furthermore, many sectors of the economy are experiencing surplus production capacity, with weak
domestic demand exacerbating the situation.
• Both the private and public sectors are forecast to cut back on fixed investment spending in the ST,
with a recovery expected in the MT on the back of improving conditions in global markets and, very
gradually, in the domestic market. Facing a revenue squeeze, general government may be forced
to reduce spending on economic and social infrastructure in the shorter-term.
Gross fixed capital formation (GFCF)
15
10
% Change (y-o-y)
5
0
-5
-10
24SA economic forecasts:
Limited fiscal space, commitment to consolidation
• Government is committed to fiscal consolidation and debt sustainability under difficult
conditions.
• Facing a revenue squeeze in a low-growth environment, government is being forced to
cut back on expenditure. The fiscal balance (as a % of GDP) is forecast to improve
gradually over the outlook period.
• Gross loan debt of government (excl. guarantees to SOEs) is projected to peak at 53%
in 2019, before a gradual decline ensues.
The budget balance and government debt
2 55
Budget balance: % of GDP
1 50
Debt as % of GDP
0 45
-1 40
-2 35
-3 30
-4 25
-5 20
-6 15
25Economic forecasts:
Growth prospects to remain unsatisfactory in the
short-term, improving in the medium-term
• GDP growth of 0.6% is expected for 2017. Consumer spending is likely to remain subdued and fixed
investment to decline further in real terms. Exports, on the other hand, should made a significant
contribution to overall growth. Demand conditions are improving in global markets and the ZAR is
relatively competitive, providing significant opportunities for export development.
• Growth of around 1.2% is forecast for 2018, supported by modestly higher consumer spending,
some recovery in fixed investment and an improving export performance.
Real GDP growth and contribution of its respective components
8
Forecast
6
4
Percentage
2
0
-2
-4
2010 2011 2012 2013 2014 2015 2016 2017 2018 2019 2020 2021 2022
Consumer spending Government spending Fixed investment Exports
Imports Other GDP
Source: IDC, compiled from SARB data; IDC forecasts
26Thank you
You can also read