Addressing Glare in Solid State Lighting
←
→
Page content transcription
If your browser does not render page correctly, please read the page content below
White Paper
Date: January 2014
By: Jeff Shuster

Addressing Glare in Solid‐State Lighting
Abstract: Glare is a phenomenon caused by a bright light source that inhibits the
ability to view a task or scene, due to an uncomfortable or even blinding effect on the
viewer. Although many metrics have been developed attempting to quantify glare,
each has limitations and most are difficult to measure in the field. This paper briefly
examines several of these methods, provides general recommendations to reduce
glare, and assesses an installation of Ephesus Arena lights.

Introduction
Glare can be divided into two categories: disability glare and discomfort glare. Disability
glare is a reduction in visibility due to scattered light in the eye, and is commonly used in the
context of automotive head lamps. It is not necessarily associated with physical discomfort,
only reduced visibility. Figure 1 below shows an illustration of how disability glare impacts
the eye by scattering light and reducing contrast in an image. Tests for disability glare
measure the ability of a subject to detect an object in the presence of a glare source.

                            Figure 1: Mechanism of Disability Glare 2

By contrast, discomfort glare is defined as an annoying or painful sensation when exposed
to a bright light in the field of view, without necessarily impairing vision. Discussions of glare
in sports lighting generally refer to the discomfort type of glare. Unlike disability glare,
discomfort glare is subjective and hasn’t been directly linked to a physiological cause. There
are a number of different models and variables that are used in quantifying discomfort glare.
Measurements of glare are based on measurements of light, so it’s important to understand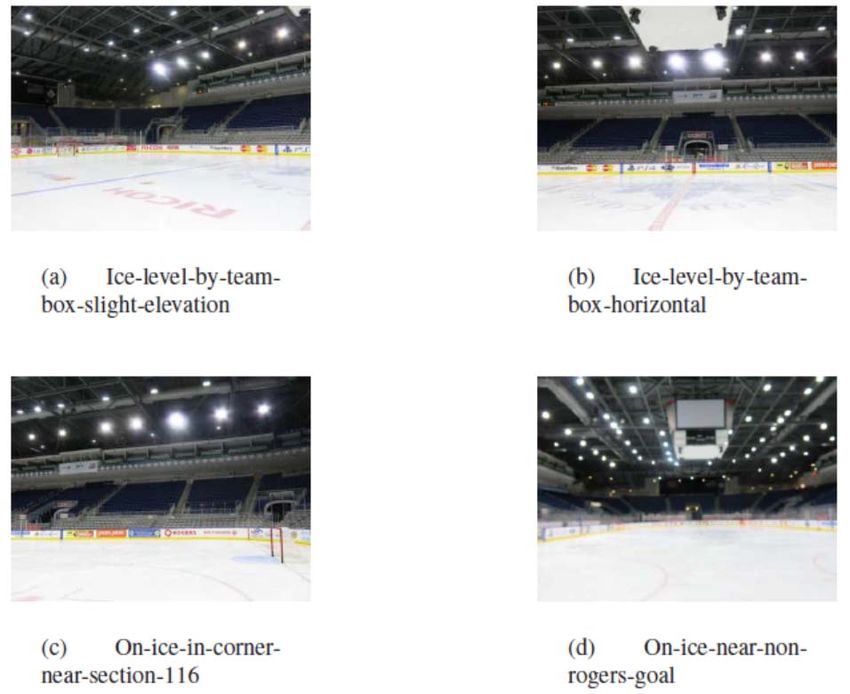
some basics of how light is measured before discussing glare further. The strength of a light
or light source is quantified in terms of both illuminance and luminance. Illuminance is how
much light (luminous flux) is incident to a surface or area, basically how much light is going
into an area. It is measured in lux (which is a lumen/m2) or foot-candles by a hand-held
illuminance meter. These meters are relatively inexpensive ($3000) and therefore less common than the illuminance
counterpart. It is also limited by the need to have the source subtend the entire field of view
of the meter for accurate readings, which means at a certain distance away the
measurement is no longer accurate. To bypass this limitation, a digital camera can also be
used to measure luminance with the proper settings and calibration1. For a Canon G15
digital camera, the field of view of a pixel is 0.017 degrees in the wide angle lens position
and 0.0034 degrees in the telephoto position. This is a much finer resolution that the
standard 1 degree view of a luminance meter making it a much more versatile for field
measurements. In terms of glare, luminance is most often measured directly toward a light
source from a given viewing location.
Methods of Quantifying Glare
The following list provides a brief overview of several methods to quantify disability glare. As
a subjective property with no widely accepted measurement standard, there are additional
methods not described here, but the methods described below are most readily used to
classify a given lighting situation. The methods of UGR and GR are most useful in
conjunction with lighting software, and the GR and luminance measures are more practical
for measurement in a field application.
CIE, Unified Glare Rating (UGR) – this model was developed by the international
commission on illumination, CIE, for applications of interior lighting [CIE 117-1995 -
Discomfort Glare in Interior Lighting]. UGR is based on a measurement of the
luminance of a fixture for a specified direction of line of sight.
2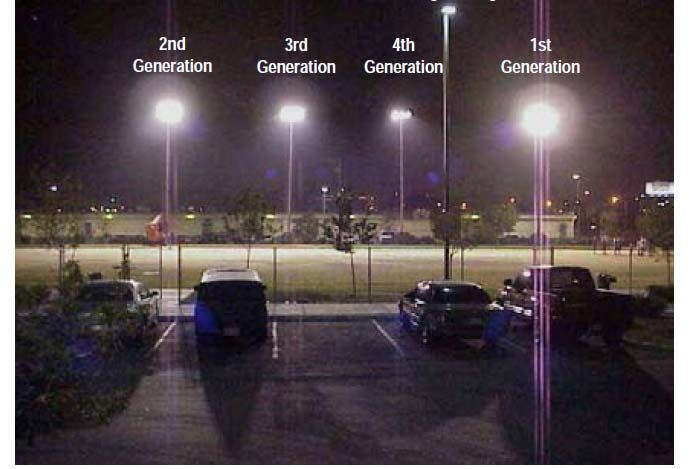
Figure 2: Unified Glare Rating3

The formula includes terms for background luminance (LB), luminaire luminance (L)
summed for all luminaires, the solid angle of the source from the viewer’s position in
steradians (ω), and the Guth position index (р). The Guth position index is based on
two angles: α= angle from vertical of the plane containing the source and the line of
sight in degrees and β = angle between the line of sight and the line from the
observer to the source. The Guth position index is expressed as9:

                    exp 35.2     0.31889       1.22          10

                                  21    0.26667       0.0029663      10
Based on these terms, the formula for UGR is given as:

                                              . 25    Lω
                               UGR     8log
                                               L      p

This produces values that range from 5 to 40, where anything at 10 or below is
negligible and anything above 30 is unacceptably glaring, see table 1. UGR is
generally known to only be accurate for small source sizes. It is limited to source
sizes between 0.0003 steradians and 0.1 steradians. This corresponds
approximately to minimum of a 2-inch source (like a standard incandescent bulb)
from about 32 feet away up to maximum fixture 3-feet wide from 10 feet away. This
calculation is integrated into many photometric software packages, such as AGI32,
based on a specified direction. For this reason, it is a good indicator for glare in an
indoor planning situation. Due to the complex interaction of angles and the need to
measure each fixture individually, it is difficult to measure in the field.

                                         3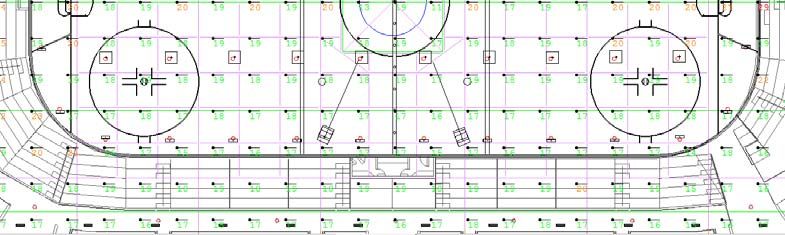
Table 1: UGR Criteria 3
UGR Hopkinson’s Criterion
10 Imperceptible
13 Just perceptible
16 Perceptible
19 Just acceptable
22 Unacceptable
25 Just uncomfortable
28 Uncomfortable
CIE, Glare Rating (GR) – this model was developed by the international commission
on illumination, CIE, for applications in outdoor lighting [CIE document 112-1994].
Glare rating is calculated based on illuminance on the eye when observing each
point in an array of points from a single observer position as shown in Figure 2
below.
Figure 3: Glare Rating 4
The calculation of Glare Rating includes terms for veiling luminance on the eye (LVL)
and veiling luminance by the environment (LVE). The use of the term luminance here
is somewhat misleading because it’s calculation relies only on an illuminance
measurement. Veiling luminance on the eye is a summation across all luminaires of
the illuminance perpendicular to the line of sight (EEYEi) and divided by a factor of the
angle between the viewer’s line of sight and the direction of the light (qi). Veiling
luminance by the environment includes the average horizontal illuminance (EHOR,AV),
the reflectance (ρ) and the unity solid angle in steradians (Ω). Glare rating is given
as:
4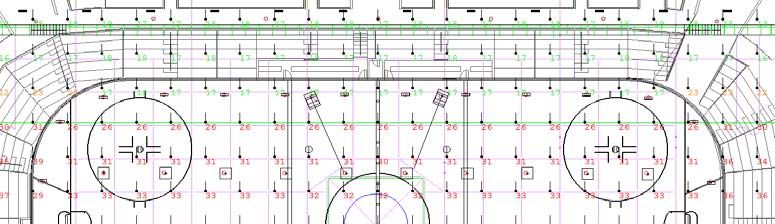
24 27 log .
10
, ∗
0.035 ∗
∗Ω
This results in values ranging from 10 to 90, where 10 and below is unnoticeable and
90 is considered unbearable, see table 2 below4. For outdoor sports competition, it’s
recommended the GR remain below 50. Similar to UGR, this calculation is integrated
into photometric software packages, so is useful to apply in a planning situation for
an outdoor field. It should also be noted that the calculation of this value is done from
a single observer’s point within the area being lit, so it’s largely dependent on what
points are chosen. Due to the difficulty of separately measuring each luminaire,
particularly in outdoor sporting venues which have hundreds of lights, this quantity is
also very difficult to capture in the field.
4
Table 2: Glare Rating Criteria
GR Classification
10 Unnoticeable
20
30 Noticeable
40
50 Just Admissible
60
70 Disturbing
80
90 Unbearable
LRC, Discomfort Glare (DG) – The Lighting Research Center (LRC) of Rensselaer
Polytechnic Institute, has developed their own empirical model to quantify discomfort
glare. Through series of studies in both indoor and outdoor scenarios, they had
subjects rate the level of discomfort glare on the DeBoer scale (see table 3) and
statistically analyzed the results. It’s worth noting that the DeBoer scale works in the
opposite direction of the previously mentioned ratings, so the higher the number the
less glare is present.
5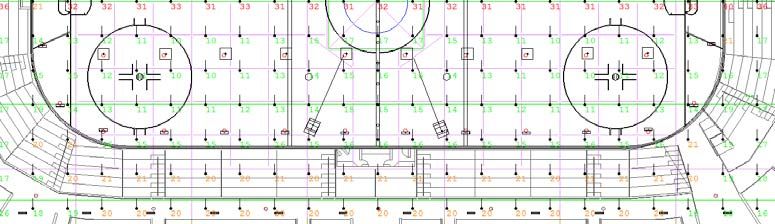
Table 3: DeBoer Scale
                                   DB    Classification
                                   9    Just Noticeable
                                   8
                                   7    Satisfactory
                                   6
                                   5    Just Permissible
                                   4
                                   3    Disturbing
                                   2
                                   1    Unbearable

In contrast to the CIE UGR model, the LRC found ratings of discomfort glare were
much more strongly correlated to the illuminance, rather than the luminance of the
source5. However, this effect is limited to a certain source size – when the source
was larger within the field of view, subtending more than 0.3 degrees, they found
luminance carried a greater influence. Their model for discomfort glare uses four
terms: illuminance from the source (EL), luminance of the source (LL), illuminance
from the area surrounding the source (ES) and ambient illuminance (EA) if the glare
source and the light system it were part of were not installed. Discomfort glare is then
given as5:

                           log               0.6 log             0.5log
Note the value for surround illuminance, ES, must be non-zero for this expression to
work. In correspondence with the LRC, they listed the surround and ambient
illuminance in a black room as 0.01 lux. Additionally, they reported about 0.02 lux for
outdoor rural areas, 0.2 lux for suburban areas and 2 lux in urban areas. This value
for DG is then converted into a rating on the DeBoer scale using the formula:
                                                                 50,000
                             6.6   6.4 log             1.4 log
The final term of this equation, containing luminance of the source (LL) is only
included if the source size subtends more than 0.3 degrees in the field of view. At 20
feet away, a source of about 1.25 inches or larger would meet this criteria. At 50 feet
away, a source of about 3 inches or larger would meet this criteria. This is
comparatively a more simple calculation to the CIE methods, because it measures
glare from a single source, rather than requiring summing all sources. For field
measurement of an isolated single source, this is a valuable method. However, in
certain types of lighting systems where there is a bank or cluster of lights it may be
impractical to turn a single light on or off to take these measurements independent of
the other lights.

                                        6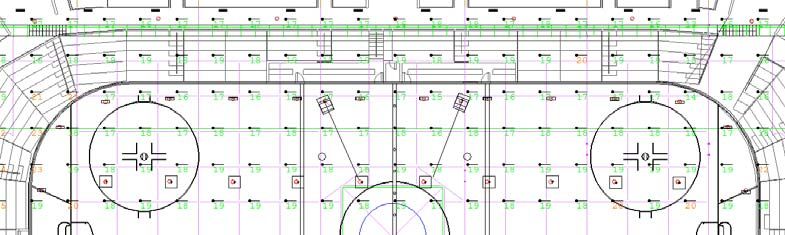
Luminance Criteria – Although the aforementioned methods provide a repeatable,
independent measurement of glare, they leave something to be desired when a
simple comparative measurement is all that’s required. In some cases of LED
installations, it’s enough to know if glare will be better or worse than the current
lighting. To this end, there are a number of criteria that use luminance
measurements as an indication of glare. Some take a ratio approach, measuring
luminance between the task being viewed and the glare source. These have
proposed various ranges of acceptable luminance ratios from 100:1 down to 10:1,
but found limited degrees of applicability based on individual perception6.
Another study of office environments suggested any luminance above 1500 cd/m2
was likely to be a source of glare7. It’s important to acknowledge the lighting
requirements in sporting venues are often up to eight times higher than those of a
standard office environment, so this luminance threshold may be overly conservative
when applied to a sporting venue due to the high surround illuminance. Luminance
measurements taken from an off-angle, outside the target area of the source, can
provide an indication of the level of light spillage. Research is ongoing to determine
an appropriate comparison threshold for sporting venues and similar lighting
systems. Some combination of source luminance and illuminance at the eye may be
the most appropriate for a comparative field measurement. At any rate, these
measurements provide a more straightforward way to quickly assess glare in a field
application.
Considerations to Reduce Glare
Reducing the effects of glare involves two primary considerations: light spillage and fixture
position. Light spillage is a property of the luminaire design and is related to how well the
luminaire limits projected light to the intended area. Figure 4 below shows an
implementation of four different designs as the manufacturer worked to improve the fixture
design 8. Often shades, reflectors or special lensing can be incorporated into a design to
reduce light projection in an unintended direction, thereby reducing glare. Spillage is
typically most concerning when lights aimed vertically emit unintended light in the horizontal
plane, causing a bright source in a viewer’s eyes.
7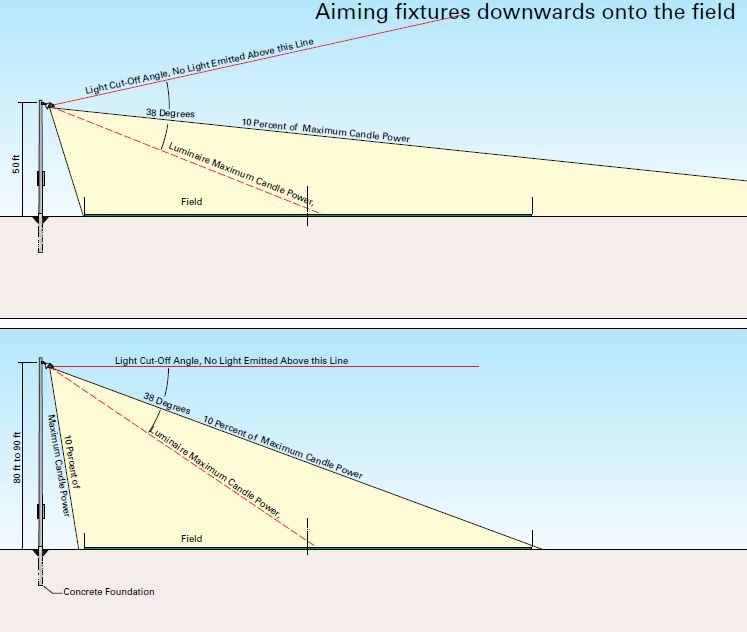
Figure 4: Light Spillage as a result of Luminaire Design

The other property which influences the amount of glare is the fixture position. In general
fixtures positioned higher from the target area and more directly overhead result in less
discomfort glare than fixtures that are lower and further off-center from the targeted area.
Figure 5 illustrates this effect for a sports field installation shown with a 50 foot mounting
height and a 90 foot mounting height8. The higher pole shown in the bottom half of the figure
allows for better cutoff of light and eliminates spillage into the sky. If the mounting position of
the luminaire cannot be changed, aiming the center point of the luminaire closer to the
mounting location can also help to reduce glare. In many cases, this is a competing
requirement with supplying adequate light levels to the target area, so requirements must be
prioritized.

                     Figure 5: The Importance of Light Position to Reduce Glare

                                                  8
Assessment of Glare in an Ephesus Installation
This section applies the UGR and luminance criteria methods for quantifying glare
discussed earlier to an installation of Ephesus Arena LED luminaires at Ricoh Coliseum in
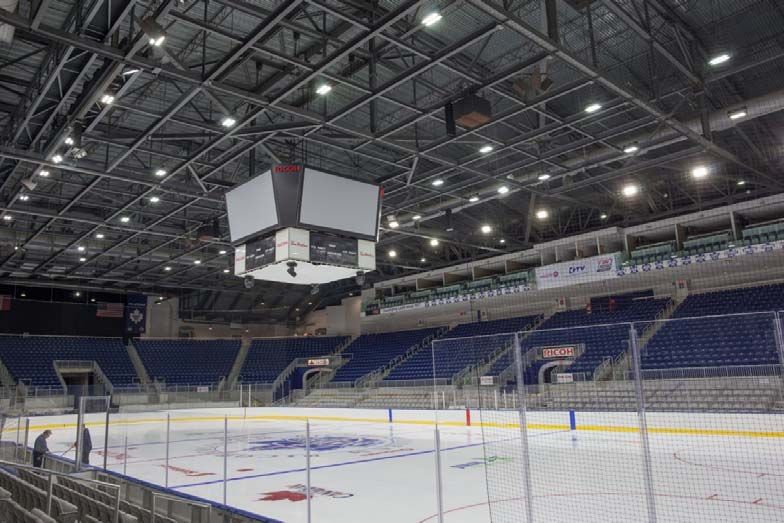
Toronto, Canada. As shown in Figure 6, this installation includes a mixture of overhead
lights pointed directly downward and a row of side lights angled in toward the ice.
Figure 6: Ephesus Arena Lighting in Ricoh Coliseum, Toronto
It’s expected that the lights angled in from the side will contribute most significantly as a
glare source, since they are lower and more likely to cross a viewer’s line of sight. The first
evaluation uses a 3D model of the Ricoh Coliseum and calculates the UGR along a 10 x 10
horizontal grid, 4 feet above the surface of the ice. AGI32 software was used to perform this
analysis. Calculation of UGR is based on a specified direction for line of sight, so evaluation
was performed looking both from the left to the right along the length of the ice and from the
bottom to the top across the width of the ice. Figure 7 below shows the UGR looking down
the length of the ice. The maximum values are around 20 which is within the acceptable
range listed in Table 1. This viewing angle allows glare to be assessed with minimal
contributions from the side lights. This acceptable result indicates no unintended spillage
from the overhead lights is causing glare.
9Figure 7: Evaluation of UGR at Ricoh, Left to Right
Figure 8 shows the UGR with the line of sight rotated 90 degrees, looking across the width
of the ice. Now the contribution of the angled side lights is worst case and a number of
points across the snapshot are in the uncomfortable range (28 or higher). Although resulting
in some glare, these sidelights provide several important functions by eliminating shadows
along the inside edges of the boards and greatly increasing the vertical illuminance. Vertical
illuminance is essential for quality television broadcasting. Additionally, the high overall
lighting levels of the arena help to minimize the potentially uncomfortable effect, because
the lights aren’t in stark contrast to a dark surrounding.
Figure 8: Evaluation of UGR at Ricoh, Bottom to Top
10A third party evaluation of the Ricoh Coliseum based on luminance criteria was performed
by Peter Hiscocks, of Syscomp Electronic Design Limited. Based on the glare criteria of
1500 cd/m2 mentioned previously, he assessed luminance from ten positions in the Ricoh
Center, both from the ice and in the viewing stands. Using a calibrated digital camera with
appropriate filters, he was able to capture multiple fixtures in each frame and report
luminance values from each light fixture. A few sample figures from the analysis are copied
in Figure 9 below.
Figure 9: Ricoh Luminance Assessment
It was found the fixtures that were aimed vertically had well controlled spillage and were not
a source of glare, like the fixtures in the far left of (a) in Figure 9. The fixtures aimed in at
sides of the rink produced luminance readings an order of magnitude higher than the
threshold of 1500 cd/m2, such as those in the center of (b) and (c) in Figure 9. This agrees
with the results from the UGR analysis that these side lights are the most likely culprits for
glare in this installation. As viewed down the length of the ice, from behind the goal,
luminance values were all below the glare threshold, shown in (d) of Figure 9. Keeping in
mind this threshold was suggested primarily for office environments, where typical
horizontal illuminance values are 30-40 foot-candles versus 150 foot-candles at the Ricoh
Center, this is a remarkable result.
11Conclusion
There are many approaches to quantifying discomfort glare, but with any approach it
remains a subjective measurement. CIE methods of Unified Glare Rating (UGR) and Glare
Rating (GR) are helpful in planning situations, where software can complete the complex
calculations. The LRC’s method of Discomfort Glare (DG) provides a robust empirical
model, but requires measurements of a single light at a time, which may be impractical for
field measurements in a large installation like a sporting venue. Lastly, the luminance criteria
method provides a practical field measurement, but lacks the inclusion of other potential
contributing factors, most noticeably illuminance at the eye.
Glare results from a combination of both luminaire design, and position. Even the best
designs can produce glare if positioned a certain way. Measuring the Ephesus Arena
installation with both the analytical method of UGR and the more simplistic luminance
criteria indicates the general spillage control of the fixture is very good. This means the
element of glare associated with fixture design is adequate. The greatest likelihood of glare
with an Ephesus fixture is related simply to its aiming position.
12References
1) Hiscocks, Peter. Measuring Luminance with a Digital Camera. September 16, 2011.
http://www.ee.ryerson.ca/~phiscock/
2) Perel, Michael. Headlamp Glare Through the Ages: How to measure it? What to do about it?
http://www.cormusa.org/uploads/2013_Grum_Lecture___PEREL.pdf
3) AGI32 WebHelp. Calculations UGR Concepts.
http://docs.agi32.com/AGi32/Content/adding_calculation_points/Calculations_UGR_Concepts
.htm
4) AGI32 WebHelp. Calculations Glare Rating Concepts.
http://docs.agi32.com/AGi32/Content/adding_calculation_points/Calculations_Glare_Rating_
Concepts.htm
5) Alliance for Solid-State Illumination Systems and Technologies (ASSIST). ASSIST
recommends…A Method for Estimating Discomfort Glare from Exterior Lighting Systems.
Volume 9, Issue 1. April 2011. www.lrc.rpi.edu/programs/solidstate/assist/pdf/AR-
DiscomfortGlare.pdf
6) Linney, Andrew Scott. Maximum Luminances and Luminance Ratios and their Impact on
Users Discomfort Glare Perception and Productivity in Daylit Offices. Thesis, Victoria
University of Wellington, Master of Building Science, 2008.
http://researcharchive.vuw.ac.nz/bitstream/handle/10063/651/thesis.pdf?sequence=1
7) Osterhaus, W.. Recommended Luminance Ratios And Their Applications In The Design Of
Daylighting Systems For Offices. Centre for Building Performance Research, School of
Architecture Victoria University of Wellington, New Zealand. 2002.
8) McGowan Broz Engineers/DMD. Understanding Glare, Not All Sports Fixtures Are Created
Equal. 2001. http://www.seattle.gov/parks/proparks/projects/LoyalHeightsBoards.pdf
9) Wonwoo Kim, Jeong Tai Kim. A Formula of the Position Index of a Glare Source in the
Visual Field. Deparment of Architectural Engineering, Kyung Hee University, Yongin 46-701,
Korea. May 27, 2010.
13You can also read


