Numerical analysis of the Venda Nova II powerhouse complex
←
→
Page content transcription
If your browser does not render page correctly, please read the page content below
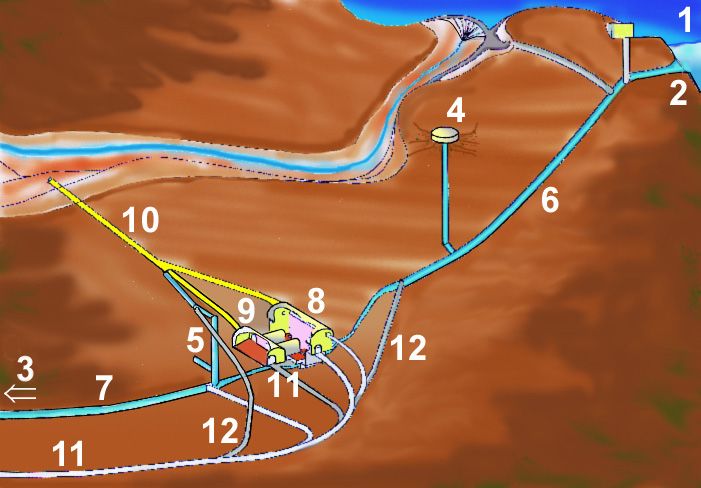
Numerical analysis of the Venda Nova II powerhouse complex

T. Miranda & A. Gomes Correia
University of Minho, Department of Civil Engineering, Guimarães, Portugal
S. Eclaircy-Caudron & D. Dias
INSA, Lyon, France
C. Lima
EDP-Produção, Porto, Portugal
L. Ribeiro e Sousa
University of Porto, Department of Civil Engineering, Porto, Portugal

ABSTRACT: In the North of Portugal a hydroelectric scheme called Venda Nova II was re-
cently built in order to optimize the resources of the reservoirs created by Venda Nova and
Salamonde dams. The scheme, almost fully composed by underground structures and built in a
predominantly granite rock mass, include several tunnels with a total length of about 7.5km, in-
clined and vertical shafts with a total length of 750m and two caverns which compose the pow-
erhouse complex. The complex consists of two caverns interconnected by two galleries at a dept
of about 350m. For this complex, 2D and 3D numerical models were developed considering the
different construction stages. The geomechanical parameters of the granite formation for the
numerical models were obtained using GEOPAT. This software is a knowledge based system
which allows obtaining geomechanical parameters for underground structures modelling in
granite formations. The 2D model was developed in the Phases2 software while the 3D model in
FLAC3D. In this paper results of these models are analysed. Some comparisons are carried out
between the models results and the monitored data. The numerical results show in general a
good agreement with the monitored ones.

1 INTRODUCTION

In the 90’s the CPPE (Portuguese Company of Electricity Production) decided to reinforce the
power of Venda Nova hydroelectric scheme by building a new one, named Venda Nova II, that
took advantage of the high existing head – about 420m – between two reservoirs (Lima et al.,
2002; Plasencia, 2003). Venda Nova II is equipped with two reversible units in order to opti-
mize the use of the water resources for energy production. It was built in a predominantly good
quality granite rock mass and involved the construction of important geotechnical underground
works of which the following can be mentioned:
- the access tunnel to the caverns, with about 1.5km, 10.9% slope and 58m2 cross-section;
- the hydraulic circuit with a 2.8km headrace tunnel with 14.8% slope and a 1.4km tailrace
   tunnel and 2.1% slope, with a 6.3m diameter modified circular section;
- the powerhouse complex located at about 350m depth with two caverns, for the powerhouse
   and transforming units, connected by two galleries;
- an upper surge chamber with a 5.0m diameter and 415m height shaft and a lower surge
   chamber with the same diameter and 60m height.

  Figure 1 shows a general perspective of the power reinforcement scheme.
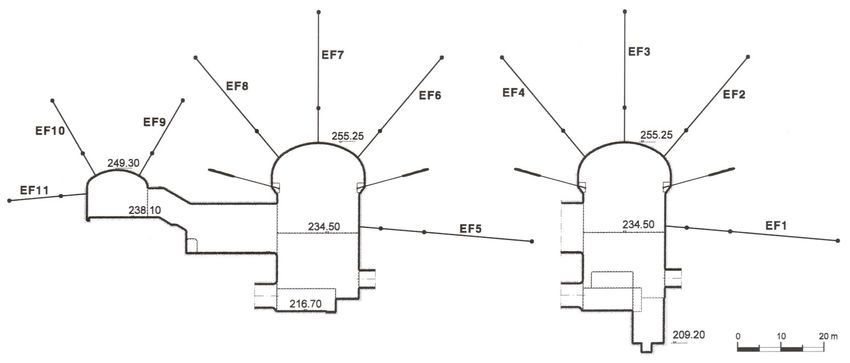
1 – Venda Nova reservoir        7 – Tailrace tunnel;
  2 – Upper intake                8 – Powerhouse cavern
  3 – Lower intake                9 – Transformer cavern
  4 – Upper surge chamber         10 – Ventilation galleries
  5 – Lower surge chamber         11 – Access tunnel
  6 – Headrace tunnel             12 – Auxiliary tunnels

Figure 1. General perspective of the power reinforcement scheme (Lima et al., 2002)

2 THE UNDERGROUND POWERHOUSE COMPLEX
2.1 Description
The powerhouse complex, located in a intermediate position of the hydraulic circuit, was built at
a depth of approximately 350m. It is composed by two caverns interconnected by two galleries
(Figure 2). The dimensions of the main cavern are, in plan, 19.0x60.5m while for the transform-
ing units cavern are 14.1x39.8m. The distance between their axes is 45.0m.

Figure 2. Powerhouse complex

   The caverns are located in an area where the existence of two subvertical discontinuities was
detected as shown in Figure 3. These discontinuities are identified as E and F. Based on the in-
terpretation of the geotechnical survey results, it was decided to move the caverns in the NE di-
rection.
Figure 3. Implantation of the powerhouse complex

   A coarse porphyritic, both biotitic and moscovitic, granite prevails in the region. The rock
mass on which the hydroelectric complex is installed is characterized by medium-size grain
granite of a porphyritic trend with quartz and/or pegmatitic veins and beds, which are occasion-
ally, rose. The rock mass also presents embedment of fairly quartzitic mica-schist.

2.2 Geotechnical survey and monitoring plan
The complex was built in a granite rock mass with good geomechanical quality. To characterize
the rock mass in the area of the caverns, four vertical boreholes with continued sample recovery
were performed (Plasencia, 2003). The lengths of these boreholes varied between 271.0m and
381.6m and their positioning controlled each 50m. A total of 98 samples were collected. The
laboratory tests performed in these samples allowed the zoning of the rock mass as presented in
Table 1. Caverns are located in the ZG1C zone. Lugeon permeability tests were also executed.

Table 1. Geological-geotechnical zoning of the rock mass
            Weathering      Disc.         RQD        Perm.       Ir (MPa)        UCS (MPa) Er (GPa)
  ZG3C      W3/W4-5         F3/F4-5       0-90       >10 UL      3.8             57.7        42.0
  ZG2C      W1-2/W3         F1-2/F3       50-90      0-8 UL      6.3             96.9        51.0
  ZG1C      W1/W2           F1/F2         90-100
Table 2. Characteristics of the four main families of discontinuities (Plasencia, 2003)
Family 1 2 3 4
Direction N81ºE N47W N8E N50E
Inclination 77NW 12NE 83NW 80NW
Continuity 1 to 3 m 1 to 10 m 3 to 10 m 3m
Alteration W1-2, occasion- W1-2 W1-2, occasion- W1-2
ally W3 ally W4
Opening closed at 0.5mm closed at 0.5mm closed at 0.5mm, closed
sometimes 2.5mm
Thickness none at 0.5mm none at 0.5mm none, sometimes none
2.5mm
Roughness undulating poorly Undulating poorly rough plane, undulating poorly
rough to rough rough, sometimes sometimes pol- rough
rough stepped ished
Seepage Dry Dry Dry, occasionally Dry
with continuous
water flow
Spacing 2 to 3m, some- 2 to 3m, some- 1 to 2m 5 to 6m
times 1 or 4m times 1m
b)
a)
Figure 4. Cross-sections of the monitoring plan
0,50
0,00
-0,50
-1,00
-1,50
-2,00
Displacement (mm)
-2,50
-3,00
-3,50
-4,00
-4,50 EF5.5
-5,00
EF5.15
-5,50
EF5.40
-6,00
EF11.6
-6,50
-7,00 EF11.18
-7,50
15-Dez-00
3-Fev-01
25-Mar-01
14-Mai-01
3-Jul-01
22-Ago-01
11-Out-01
30-Nov-01
19-Jan-02
10-Mar-02
29-Abr-02
18-Jun-02
7-Ago-02
26-Set-02
15-Nov-02
4-Jan-03
23-Fev-03
14-Abr-03
3-Jun-03
23-Jul-03
11-Set-03
31-Out-03
20-Dez-03
8-Fev-04
29-Mar-04
18-Mai-04
7-Jul-04
time (day)
Figure 5. Evolution of displacements in extensometers EF5 and EF11
For the numerical models developed in this work, the geomechanical parameters were ob-
tained using GEOPAT which is a Knowledge Based System especially developed at University
of Minho for this purpose (Miranda, 2003). It uses well organized and structured knowledge
from experts together with artificial intelligence techniques for decision support in the geome-
chanical parameters calculation and has been used with success in different applications. Using
the gathered geotechnical information together with GEOPAT the following geomechanical pa-
rameters were obtained: deformability modulus E = 45GPa, friction angle φ’ = 54º and cohesion
c’ = 4MPa.3 NUMERICAL MODELLING
The 3D model was developed using the finite difference software FLAC3D to simulate the
complex geometry of the powerhouse complex and its construction sequence. It is composed by
43930 zones, 46715 grid-points and 1100 structural elements (Figure 6). Since the filed stress
around the caverns was constant it was possible to simplify the mesh in order to be computa-
tionally more efficient. This way instead of the real 350 m depth of the cavern axis only 200 m
was modelled.
The section analysed through the 2D numerical modelling was section a) referred in Figure 4.
When comparisons between the two models are performed they are always referred to the re-
sults obtained for this cross-section where reliable monitoring values are available.
300 m 460 m
200 m
75 m
Figure 6. The 3D mesh.
The sprayed concrete was simulated by shell elements with a linear elastic and isotropic con-
stitutive model, with a Young modulus of 15 GPa and a Poisson ratio of 0.2. The rock bolts
were simulated by cable elements which can yield tensile strength with two nodes and one axial
degree of freedom.
For the numerical modelling, the construction sequence was simplified relatively to those de-
fined in design. Therefore, the adopted stages are the ones presented in Table 3.
The construction sequence adopted for the 2D modelling was very similar. The only differ-
ence was the way the two interconnecting galleries were simulated. Three different approaches
were carried out in a preliminary analysis: i) considering the total excavation of the galleries; ii)
non considering the effect of the galleries excavation due to their small influence in the global
behaviour of the structure; iii) replacing the material in the area of the galleries for another with
lower equivalent geomechanical properties. The first approach led to unrealistic results with
multiple shearing zones and high displacement levels which were not observed in the field.
Since the model was developed considering plain strain conditions this consideration was too
unfavourable. The remaining two approaches showed very similar results. The differences were
insignificant therefore it was chosen not to consider the effect of the interconnecting galleries
excavation in the following analysis.
The in situ tests pointed out for a K0 coefficient between 2 and 3. For this analysis a starting
value of 2 was considered. Due to the high K0 ratio and the span of the main cavern vertical
wall, the higher displacements are expected to take place in that area. Figure 7 presents the dis-
placements contours along with the corresponding vectors for the two models in the referred
cross-section. It is possible to observe the same qualitative displacement patterns in both mod-
els. The displacement vectors show the strong influence of the high horizontal stress translated
by higher displacements in the vertical walls of the main cavern.Table 3. Adopted construction stages for the 3D numerical model
Stage Model Description
Excavation of the upper part of the main cavern arch. Appli-
1 cation of 25cm of fiber sprayed concrete on the arch and 6m
length and 25mm diameter rockbolts in a 2x2m mesh.
2 Excavation of the remaining main cavern arch.
Excavation of the main cavern until the base level of the in-
terconnecting galleries and the transforming units caverns.
3 Application of 25cm of fiber sprayed concrete on the arch of
the second cavern and 6m length and 25mm diameter rock-
bolts in a 2x2m mesh.
Excavation of the two interconnecting galleries and applica-
4 tion of 25cm of fiber sprayed concrete in the roof of the gal-
leries.
5 Completion of the main cavern excavation.
.
Figure 7. Displacement contours and vectors for the 2D (upper image) and 3D modelsFor a more thorough analysis Figure 8 shows the computed displacements along lines coin-
ciding with extensometers 5 and 7 (near the wall and roof of the main cavern, respectively). The
displacements of the 2D calculation along the sub-horizontal line are much higher than for the
3D model which was expected due to the plain strain consideration. For the 3D model the
maximum displacement along this line is approximately 10mm while for the 2D model is almost
50% higher. The displacements near the ceiling of the main cavern are small for the two models.
In this zone the gravity loads, which would cause a downward movement, are almost compen-
sated with the high horizontal stress which pushes the arch upwards causing a near-zero dis-
placement.
16 2
Wall Roof
14
12
2D 2D
3D 3D
Displacement (mm)
Displacement (mm)
10
8
6
4
2
0
0 10 20 30 40 0 10 20 30 40
Distance (m) Distance (m)
Figure 8. Computed displacement near the wall and roof of the main cavern
Due to the good overall quality of the rock mass the displacements magnitude is small. The
maximum computed displacements in the rock mass are 15cm for the 2D model and 10.5cm for
the 3D case. Moreover, there are a small number of yielded zones which are confined to small
areas near the arch and wall of the main cavern.
The behaviour of the structure and surrounding rock mass is almost elastic. This means that
the most important parameters for the behaviour prediction of the structure are E and K0. Also,
the maximum computed shear strains were low with values ranging from 0.02% and 0.1% for
the 2D model and 0.015% and 0.04% for the 3D model. Once more lower values were obtained
for the 3D model. These values are within the expected range considering the quality of the rock
mass and the construction method which caused very low damage to the rock mass.
Figure 9 compares the results of the models with the measures of extensometers 5 to 11. The
results of the 2D and 3D models are very similar for most of extensometers. Also, the computed
values follow the same qualitative trend as the observed ones. The worst results are observed for
the inclined extensometers of the main cavern (6 and 8) where the displacement values are
clearly overestimated. In the remaining cases the 3D model is more accurate for the measure-
ments of extensometers 5, 7 and 9 while the 2D model slightly outperforms the 3D model for
extensometers 10 and 11. In a qualitative perspective it can be concluded that, excepting for ex-
tensometers 6 and 8, the results of the models are very acceptable.
For a more thorough insight of the results, some statistical analysis was carried out. Tests
were performed to the mean values of the measured and computed values in the extensometers
and they can be considered statistically identical. The mean computed displacement is 2.47mm
(equal for both models) and the measured is 2.34mm.
The Shapiro-Wilk normality test was performed to the error values of the models. It was veri-
fied that they follow a normal distribution for a 95% significance level. This fact suggests a
good distribution of the errors with a mean value near 0 (≈0.14mm) and points out for the good
quality of the results. Also, a Smirnov test was performed and it was concluded that the ob-
served and the computed values follow the same statistical distribution.12
10
displacement (mm)
8
2D
6 3D
Measured
4
2
0
EF 0
8
EF 5
40
30
30
30
EF 0
EF .6
EF .6
EF 5
EF 8
EF 8
EF 8
EF 6
.2
.1
1
2
5.
6.
7.
8.
9.
10
11
5.
5.
6.
7.
8.
9.
10
11
EF
EF
EF
EF
EF
Extensometer
Figure 9. Comparison between computed and measured displacements
For the 3D model a calculation of the factor of safety was carried out. FLAC3D uses the
method defined by Dawson et al. (1999) in which the strength parameters are consecutively re-
duced until significant plastic flow appears in some zone of the structure. The computed factor
of safety was 4.63 which can be considered satisfactory in terms of security level. Figure 10
shows an image of the last non-equilibrium state produced by the methodology of strength re-
duction applied to calculate the factor of safety. The shear strain contours allow the visualiza-
tion of the failure mode.
Yielding zone
Figure 10. 3D visualization of the shear strain contours for the last non-equilibrium state
Plastic flow appears in the connection zone between the vertical wall and the beginning of the
arch which is an area of stress concentration. This fact can be corroborated by the observation of
Figure 10 where a cutting plane through one of the interconnecting galleries shows the shear
strain contours and velocity vectors. It can be seen that potential instability zones are located
near the connections between the vertical walls of the main cavern and the ceiling arch mainly
near the high span vertical wall (opposite to the interconnecting galleries).Figure 10. 2D visualization of the shear strain contours and velocity vectors
4 CONCLUSIONS
The Venda Nova II hydroelectric scheme built in the North of Portugal includes a set of very
important underground structures. In this work 2D and 3D numerical models of the powerhouse
complex were developed considering the different construction stages. The powerhouse com-
plex is composed by two caverns connected by two galleries. Through the models their behav-
iour was analysed and compared with the monitored values by extensometers placed in the cav-
erns.
The scheme is located mainly in a granite rock mass with good geomechanical characteristics
as shown by the results of the geotechnical survey. The geomechanical parameters used in the
models were obtained through a knowledge based system called GEOPAT. The system was de-
veloped at the University of Minho with the purpose of calculate geomechanical parameters in
granite formations.
The computed displacements are small and the structure behaviour is almost elastic due to the
good quality rock mass. The displacements configuration is very much influenced by the high
horizontal stress perpendicular to the caverns axis. The maximum displacement values are ob-
served near the high span vertical wall of the main cavern.
The results of the models, in a qualitative perspective, are close to the observed values. Ex-
cepting for extensometers 6 and 8, the fit can be considered acceptable for both models which
present similar values. Also in a statistical point of view it is concluded that the produced results
are of good quality. The mean computed displacement by the numerical models was 2.47mm
against the measured 2.34mm. The errors between measured and computed values follow a
normal distribution with a mean value close to 0 which also corroborates the good quality of the
fit. Concluding, in an engineering point of view, the results of the models fits very satisfactory
to the observed displacements. This is especially true since the monitored displacements are
very small which turns the fit more difficult to obtain (due to lack of precision in the readings,
simplifications of the constructions sequence and constitutive models, etc.).
The computed factor of safety on the 3D model is 4.63 which translate an acceptable security
level. The most probable failure mode taken from this calculation is plastic flow in the connec-
tion between the beginning of the arch and the vertical wall of the main cavern since its an area
of stress concentration.
Backanalysis of the geomechanical parameters is being carried out using the measured and
computed displacements of the 3D model. The preliminary results are presented in other work.
Different techniques are being used namely the optimization software Sidolo which uses con-
ventional search algorithms and an evolutionary algorithm. This is very innovative technique
and is intended that it overcomes some limitations of conventional algorithms like the conver-
gence to local minima.AKNOWLEDGMENTS
The authors wish to express their acknowledge to EDP Produção EM for authorization and
making available the necessary data. This work was financed by the Foundation for Science and
Technology (FCT) in the framework of the research project POCI/ECM/57495/2004, entitled
Geotechnical Risk in Tunnels for High Speed Trains.
REFERENCES
Dawson, E., Roth, W., Drescher. 1999. Slope stability analysis with finite element and finite difference
methods. Géotechnique 49(6), 835-840.
ISRM. 1978. Suggested methods for the quantitative description of discontinuities in rock masses. Inter-
national Journal of Rock Mining Sciences & Geomechanics Abstracts, Vol. 15, nº 16, pp. 319-368.
Lima, C.; Resende, M.; Plasencia, N.; Esteves, C. 2002. Venda Nova II hydroelectric scheme power-
house geotechnics and design. ISRM News, Vol. 7, no. 2, pp. 37-41.
LNEC. 1997. Seismic tomography between boreholes in the mass interesting the central cavern of the
Venda Nova II scheme. Lisboa (in Portuguese).
Miranda, T. 2003. Contribution to the calculation of geomechanical parameters for underground struc-
tures modelling in granite formations. MCs thesis, UM, Guimarães, 186p (in Portuguese).
Plasencia, N. 2003. Underground Works – Aspects of the engineering geology contribution and design.
MSc thesis, IST, Lisboa, 155p (in Portuguese).
Plasencia, N.; Coelho, M. J.; Lima, C., Fialho, L. 2000. Contribution of the seismic tomography for the
characterization of the mass interesting the central cavern of the Venda Nova II scheme. 7th Geotech-
nical Portuguese Congress. Porto, pp. 113-122 (in Portuguese).You can also read